

Abstract
Tumor suppressor p53 is a master regulator of apoptosis and plays key roles in cell cycle checkpoints. p53 responds to metabolic changes and alters metabolism through several mechanisms in cancer. Lactate dehydrogenase A (LDHA), a key enzyme in glycolysis, is highly expressed in a variety of tumors and catalyzes pyruvate to lactate. In the present study, we first analyzed the association and clinical significance of p53 and LDHA in breast cancer expressing wild‐type p53 (wt‐p53) and found that LDHA mRNA levels are negatively correlated with wt‐p53 but not with mutation p53 mRNA levels, and low p53 and high LDHA expression are significantly associated with poor overall survival rates. Furthermore, p53 negatively regulates LDHA expression by directly binding its promoter region. Moreover, a series of LDHA gain‐of‐function and rescore experiments were carried out in breast cancer MCF7 cells expressing endogenous wt‐p53, showing that ectopic expression of p53 decreases aerobic glycolysis, cell proliferation, migration, invasion and tumor formation of breast cancer cells and that restoration of the expression of LDHA in p53‐overexpressing cells could abolish the suppressive effect of p53 on aerobic glycolysis and other malignant phenotypes. In conclusion, our findings showed that repression of LDHA induced by wt‐p53 blocks tumor growth and invasion through downregulation of aerobic glycolysis in breast cancer, providing new insights into the mechanism by which p53 contributes to the development and progression of breast cancer.
Keywords: aerobic glycolysis, breast cancer, lactate dehydrogenase A, p53, tumor progression
1. INTRODUCTION
Although normal cells use mitochondrial respiration to provide energy, the majority of tumor cells tend to use aerobic glycolysis, which is also known as the Warburg effect. The Warburg effect is defined as increased dependence on glycolysis for ATP synthesis even in the presence of abundant oxygen rather than the use of the more effective pathway of oxidative phosphorylation.1, 2 Cells absorb metabolites, such as glucose and glutamine, into the metabolic pathway, producing important precursors required for DNA replication, transcription, translation and other growth activities.3, 4, 5 Therefore, metabolic reprogramming has a strong impact on tumor proliferation, apoptosis, metastasis, and angiogenesis.
Multiple oncogenes and tumor suppressor genes are involved in the regulation of metabolic pathways, affecting the course of malignancy. Recent studies have shown that the regulatory function of wild‐type p53 (wt‐p53) in energy metabolism represents its key function of tumor suppression. As a tumor suppressor gene, p53 is involved in regulating metabolic pathways through a variety of methods in various types of cancer.6 As a transcription factor, wt‐p53 mainly exerts its function of tumor suppression through transcriptional regulation of its target genes to initiate various cellular responses, including cell cycle arrest, apoptosis, metabolism and ferroptosis.1, 7, 8 Parkin (PARK2), glutaminase 2 and hexokinase 2 (HK2) are direct targets of p53 and contribute to the functions of p53 in tumor suppression through regulation of energy metabolism.9, 10
LDHA, a subunit of lactate dehydrogenase (LDH), plays a critical role in regulating glycolysis by catalyzing pyruvate to lactate in the final step of anaerobic glycolysis.11 This enzyme is receiving a great deal of attention as a potential diagnostic marker or predictive biomarker for many types of cancer and as a therapeutic target for new anticancer treatments. LDHA is highly expressed in various types of cancer and is associated with poor prognosis.12 Targeting LDHA through RNA interference (RNAi) or using a small‐molecule inhibitor may offer novel opportunities for selective therapeutic targeting of cancer cells.13 The SIRT1‐p53‐LDHA‐Myc pathway plays a vital role in the cell cycle, metabolism, proliferation, differentiation and epigenetics.14 However, the molecular mechanism of p53 regulation of LDHA expression remains unclear.
In the present study, we analyzed the association and clinical significance of wt‐p53 and LDHA expression in breast cancer with wt‐p53 expression and explored the mechanism of p53 regulation of LDHA at the transcription level. Furthermore, we carried out rescue experiments to identify the functional role and molecular mechanism of wt‐p53 and LDHA in breast cancer in vitro and in vivo. In summary, our findings show that p53 can directly regulate the expression of LDHA at the transcriptional level to control aerobic glycolysis, cell growth and invasion in breast cancer.
2. MATERIALS AND METHODS
2.1. Cell lines
The human breast cancer cell lines MCF7 (with endogenous wt‐p53) and MAD‐MB‐231 (with endogenous mut‐p53) were obtained from American Type Culture Collection (Manassas, VA, USA) and preserved in our laboratory. These breast cancer cells were cultured in DMEM (Invitrogen Life Technologies, Carlsbad, CA, USA) supplemented with 10% FBS (Gibco, Thermo Fisher Scientific, Waltham, MA, USA), 100 units/mL penicillin (Invitrogen Life Technologies), and 100 mg/mL streptomycin (Invitrogen Life Technologies) and in a humidified incubator with 5% CO2 at 37°C.
2.2. Cell transfections
Cells were seeded in a 6‐well plate at 2.5 × 10⁵ cells per well. When cells achieved 60% to 80% confluency, the cells were transfected with 2.5 μg pcDNA.3/p53 (wt‐p53) using Lipofectamine 3000 Reagent (Invitrogen, Carlsbad, CA, USA) according to the manufacturer's protocol, and pcDNA3 empty vector was used as a negative control.
2.3. Cell viability and colony‐forming assays
Cells were plated in a 96‐well plate with five replicates per sample, and cell numbers were counted every day using the CCK‐8 assay (Biotool, Houston, TX, USA) for 4 days. For colony‐forming assays, cells were plated in 6‐well plates at a density of 500 cells per well and cultured for 2 weeks. The medium was replaced with fresh medium every 3 days. After 2 weeks, the medium was removed, and cell colonies were stained with crystal violet (0.1% in 20% methanol) for 10 minutes. Colonies were photographed, and the number of colonies was counted using ImageJ software (National Institutes of Health, Bethesda, MD, USA).
2.4. Cell migration and cell invasion assays
Migration and invasion assays were carried out with 8.0‐μm pore inserts (Millipore, Bedford, MA, USA) in 24‐well plates. For migration assays, 2 × 10⁶ cells were seeded into the upper compartment of Transwell inserts. The invasion assay was carried out with Matrigel‐coated filters (BD Biosciences, Franklin Lakes, NJ, USA). Cells were allowed to incubate for 24 and 48 hours. Migrated and invaded cells were fixed and stained with 0.1% (w/v) crystal violet. We selected five visual fields for counting invaded cells under a high‐power microscope. Each experiment was carried out in triplicate.
2.5. Determination of lactate, LDH, ATP, pyruvate dehydrogenase and glucose
Briefly, 1 × 10⁵ cells were seeded in a 6‐well plate. Culture medium was changed to fresh DMEM after incubation overnight. After 48 hours of transfection, the cell culture supernatant was collected and the concentration of lactate and glucose as well as the activity of LDH and pyruvate dehydrogenase (PDH) were assayed using a lactate assay kit (Jiancheng Bioengineering, Nanjing, China), glucose assay kit (Jiancheng Bioengineering), LDH activity assay kit (Jiancheng Bioengineering), and PDH activity assay kit (Jiancheng Bioengineering) according to the manufacturer's protocol, respectively. As for ATP concentration, cells were collected and lysed with ATP lysis buffer after 48 hours of transfection, and ATP concentration was measured using an ATP assay kit (Beyotime Biotechnology, Shanghai, China) following the manufacturer's protocol. Values were normalized to the protein content of the cell lysate and expressed as a fold increase over vector control.
2.6. Luciferase assay
Cells were cotransfected with LDHA promoter luciferase reporter (pLuc‐LDHA) and p53 overexpression vector or control for 48 hours, and pRL‐TK was used as an internal control. After transfection, luciferase assays were carried out according to the manufacturer's protocol (Promega, Madison, WI, USA). Data were normalized to the control.
2.7. Chromatin immunoprecipitation assay
Tumor cells (2 × 10⁶) were prepared for ChIP assays using a ChIP Assay Kit (Millipore) according to the manufacturer's protocol. The resulting precipitated DNA specimens were analyzed by PCR to amplify the region of the potential binding site (BS) included in the LDHA promoter based on the following primers: 5′‐CCTGGGTGACAGAGTGAGAC‐3′ (forward) and 5′‐CTTTCTACTGCCCACCCCAC‐3′ (reverse), and Bak1 was used as a positive control, and the PCR primer sequence was as follows: 5′‐GGTCAAGGGCAGAGAGAGAA‐3′ (forward) and 5′‐GGAGCAGGTAGAGCCTCAGA‐3′ (reverse). The PCR products were resolved electrophoretically on a 2% agarose gel and visualized using ethidium bromide staining.15
2.8. MCF7 tumor xenograft model
A total volume of 150 μL of MCF7 cells (5 × 10⁶ cells) transfected with negative control, wt‐p53, or p53 plus LDHA were injected s.c. into the left flanks of female BALB/c nude mice (5 weeks of age, 15 mice were divided into three groups randomly). Mice were injected with 17‐β‐estradiol every 2 days until the tumor could be measured. Then, tumor volume was measured with a caliper every other day. Tumor volume was evaluated using the following formula: volume = length × width2/2. After 22 days, the mice were killed for detection of final tumor weight and expression of key molecules related to cell cycle and apoptosis.
2.9. Immunohistochemistry staining and scores
Paraffin sections were baked for 1 hour at 65°C for deparaffinization and rehydration. After inhibition of endogenous peroxidase activity for 30 minutes with methanol containing 0.3% H2O2, the sections were blocked with 2% BSA in PBS for 30 minutes and then incubated with anti‐p53 (dilution 1:1000; Proteintech, Rosemont, IL, USA), anti‐LDHA (dilution 1:1000; Proteintech), anti‐p21 (dilution 1:500; Proteintech, Rosemont, IL, USA), anti‐CCND1 (dilution 1:100; CST, Danvers, MA, USA), anti‐cleaved‐poly ADP ribose polymerase (PARP) (dilution 1:100; CST) and anti‐ki67 (dilution 1:500; CST, Danvers, MA, USA). The immune complex was visualized using the MaxVision HRP‐polymer IHC Kit Detection System, Peroxidase/DAB, Rabbit/Mouse (MaxVision, Fuzhou, China) according to the manufacturer's protocol. The nuclei were counterstained with hematoxylin (Beyotime Biotechnology). Regarding IHC analysis scores, IHC staining was evaluated at 200× magnification using light microscopy. A semiquantitative evaluation of p53, LDHA, CCND1, p21, c‐PARP and ki67 protein was done using a method described in our previous studies.16, 17, 18, 19
2.10. Statistical analysis
Data were analyzed using SPSS 16.0 software (Abbott Laboratories, Chicago, IL, USA) and are expressed as mean ± SEM of at least three independent experiments. Student's t test was used to assess the significance of differences between two groups, and ANOVA and Dunnett's multiple comparisons test were used for multiple‐group comparisons. Multi‐way classification ANOVA was used to evaluate the results of the CCK‐8 assay. All statistical tests were two‐sided. P < .05 was considered statistically significant.
3. RESULTS
3.1. Wild‐type p53 expression is negatively associated with LDHA expression in human breast cancer tissue
We first monitored wt‐p53 and LDHA in a breast cancer expression public Gene Expression Omnibus (GEO) dataset containing 251 tumor samples (GSE3494). This dataset was divided into two groups, 205 cases with wild‐type p53 and 46 cases with mutant p53, based on profiling analysis and sequencing.20 Then, we classified and analyzed the expression levels of p53 and LDHA in 205 breast cancer tissues with wt‐p53 and 46 breast cancer tissues with mut‐p53. LDHA expression is negatively correlated with the level of wt‐p53 expression but not with mut‐p53 (Figure 1A,B). Overall survival rates of breast cancer patients with high LDHA expression and low wt‐p53 expression is poorer than that with low LDHA expression and high wt‐P53 expression (Figure 1C). Consistent with the previous study, p53 expression was reduced in node‐positive patients but increased in node‐negative patients. In contrast, LDHA expression was increased in node‐positive breast cancer patients but reduced in node‐negative patients (Figure 1D,E).
Figure 1.
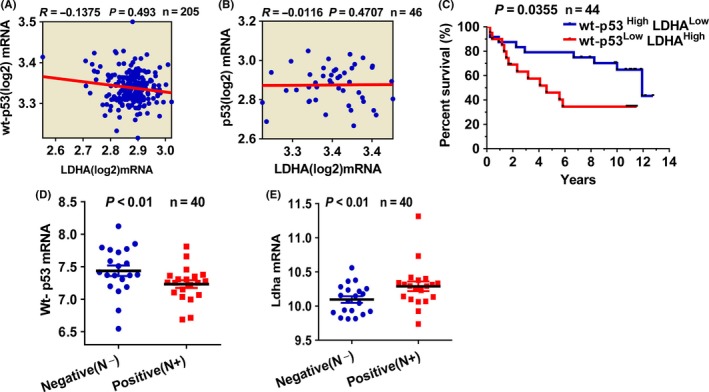
Expression of wt‐p53 and lactate dehydrogenase A (LDHA) in breast cancer tissues. A, Correlation analysis of LDHA and p53 expression in 205 breast cancer tissues with endogenous wild‐type p53 deposited in NCBI Gene Expression Omnibus (GEO) database (GSE3494). B, Expression correlation analysis for LDHA and p53 in 46 breast cancer tissues with endogenous mutant p53. C, Survival analysis of patients with high p53 expression plus low LDHA expression and low p53 expression plus high LDHA expression. D, Differential expression of p53 in 40 lymph node‐negative and ‐positive tumor tissues with endogenous wt‐p53. E, Differential expression of LDHA 40 lymph node‐negative and ‐positive breast cancer tissues with wt‐p53
3.2. Lactate dehydrogenase A is a direct transcriptional target of p53
To investigate whether dynamic expression of p53 could influence LDHA expression, we analyzed mRNA and protein expression of LDHA using qPCR and western blotting analysis, respectively, in MCF7 cells expressing endogenous wt‐p53 after ectopic expression of p53. As a result, ectopic expression of p53 could downregulate the expression of LDHA in both mRNA and protein levels in MCF7 cells (Figure 2A,B). However, overexpression of p53 could not change the expression of LDHA in MDA‐MB‐231 cells with endogenous mut‐p53 (Figure S1A‐C). Considering that p53 is a transcription factor, we then investigated whether p53 regulates the promoter activity of LDHA. As we have previously constructed a luciferase vector containing the LDHA potential promoter region (pLuc‐LDHA),15 we then transfected pLuc‐LDHA alone or cotransfected the p53 expression plasmid and pLuc‐LDHA into HEK293 and MCF7 cells and then detected the effect of p53 on the activity of the LDHA potential promoter using dual luciferase assays. As expected, ectopic expression of p53 greatly decreased the luciferase activity of the LDHA promoter in both MCF7 and HEK293 cells (Figure 2C,D). These results indicate that p53 negatively regulates LDHA expression by inhibiting the activity of the LDHA promoter at the transcriptional level. To further define the mechanism of the regulation of p53 on LDHA expression, we analyzed the sequence of the LDHA promoter of potential p53‐binding elements using the JASPAR Database and MatInspector. We identified one putative p53‐binding element in the above LDHA promoter region. Then, ChIP assays were carried out in MCF7 cells with ectopic expression of p53/Flag. Results of ChIP‐PCR showed that p53 could directly bind to the binding site of the LDHA promoter region (Figure 2E). These results suggest that p53 negatively regulates the transcription activity of LDHA by directly binding to its transcription regulation region.
Figure 2.
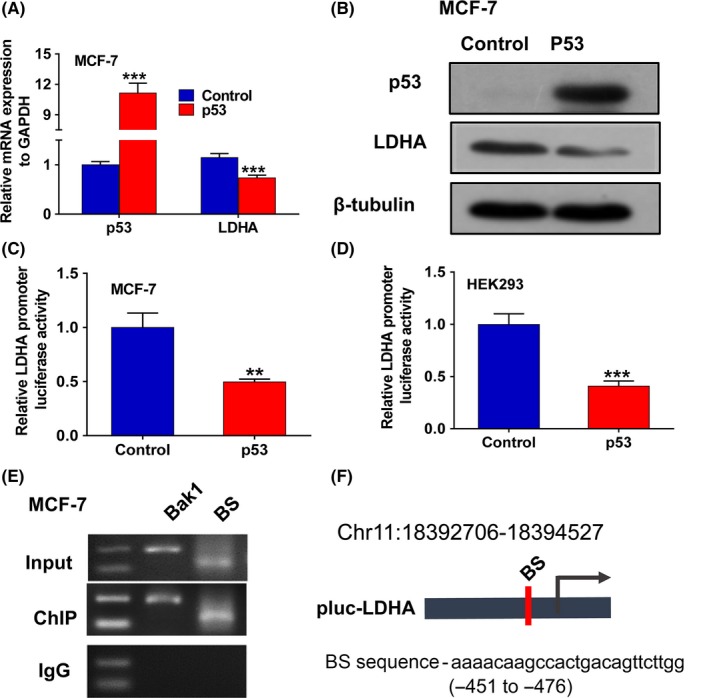
Lactate dehydrogenase A (LDHA) was identified as a direct target of p53. A, qPCR analysis of the expression of p53 and LDHA in MCF7 cells transfected with wt‐p53. B, Western blot analysis of the expression of p53 and LDHA in MCF7 cells transfected with wt‐p53. C, Dual‐luciferase reporter system assay evaluated the effect of p53 overexpression on LDHA promoter activity in MCF7 cells. D, Dual‐luciferase reporter system assay evaluated the effect of p53 overexpression on LDHA promoter activity in HEK293 cells. E, ChIP‐PCR analysis of p53‐binding sites in the LDHA potential promoter region. Bak1 was used as a positive control. BS represents four potential p53 binding fragments from the LDHA promoter region. F, Schematic diagram showing the locations of predicted p53‐binding sites in the LDHA promoter region on chromosome 11. All values are presented as mean ± SEM of triplicate measurements and have been repeated three times. Bars, SE **P < .01, ***P < .001
3.3. Restoring the expression of LDHA can reverse inhibition of the Warburg effect induced by wt‐p53 in breast cancer
As a key enzyme, LDHA plays vital roles in aerobic glycolysis in diverse types of cancer, including breast cancer, gastric cancer, renal cell carcinoma, pancreatic cancer, esophageal squamous cell carcinoma and others.12 Given that p53 decreases LDHA expression levels by directly negatively regulating LDHA, we hypothesized that LDHA mediates the function of p53. To test this hypothesis, we restored the expression of LDHA by overexpressing LDHA in p53‐overexpressing cells. As a result, low levels of lactate production and LDH activity and high levels of ATP and glucose concentration and PDH activity were detected in p53‐overexpressing MCF7 cells (p53 group), whereas the values returned to control levels in the P53 plus LDHA group (Figure 3A‐E). However, no significant change was found in lactate production and LDHA activity when p53 was overexpressed in MDA‐MB‐231 cells with endogenous mut‐p53 (Figure S1D,E). Furthermore, overexpression of p53 enhanced the inhibitory effects of 2‐deoxy‐d‐glucose (2‐DG) and oxamate, two types of glycolytic inhibitor, on cell proliferation in MCF7 cells, whereas restoring the expression of LDHA decreased p53‐mediated enhancement of the inhibitory effects of 2‐DG and oxamate on MCF7 cell proliferation (Figure 3F,G). Together, these results show that p53 could inhibit glycolysis by targeting LDHA in wt‐p53 breast cancer cells.
Figure 3.
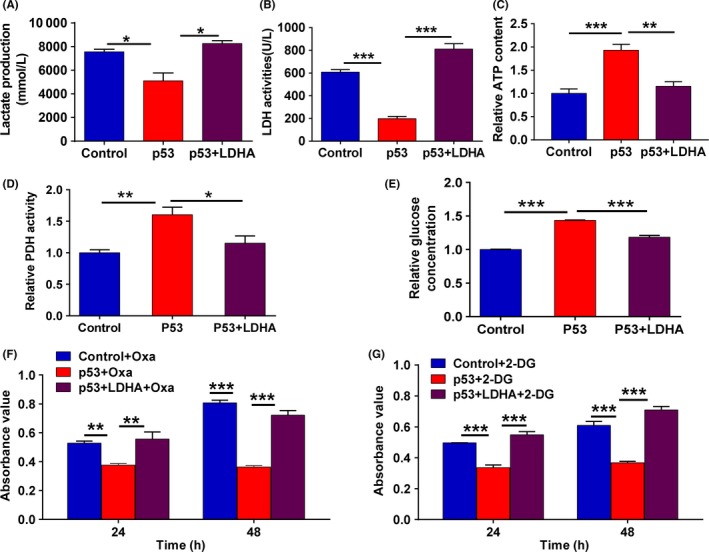
p53 dampens aerobic glycolysis through inhibition of lactate dehydrogenase A (LDHA) expression in breast cancer MCF7 cells. A, Production of lactate was detected in MCF7 cells transfected with p53 alone or cotransfected with p53 plus LDHA expression plasmids. B, LDH activity was detected in MCF7 cells transfected with p53 alone or cotransfected with p53 and LDHA expression plasmids. C, ATP production was detected in MCF7 cells transfected with p53 alone or cotransfected with p53 and LDHA expression plasmids. D, Pyruvate dehydrogenase (PDH) activity was detected in MCF7 cells transfected with p53 alone or cotransfected with p53 and LDHA expression plasmids. E, Glucose consumption was detected in MCF7 cells transfected with p53 alone or cotransfected with p53 and LDHA expression plasmids. F, Cell viability was measured using CCK‐8 assays in MCF7 cells transfected with p53 alone or p53 plus LDHA expression plasmids and treated with 50 mmol/L oxamate for 48 h. G, Cell viability was measured using CCK‐8 assays in MCF7 cells transfected with p53 alone or p53 plus LDHA expression plasmids treated with 4 mmol/L 2‐deoxy‐d‐glucose (2‐DG) for 48 h. All values are presented as mean ± SEM of triplicate measurements and were repeated three times. Bars, SE. *P < .05, **P < .01, ***P < .001
3.4. Restoring LDHA expression significantly rescues the tumor‐suppressive effects of p53 in breast cancer cells
Given the vital role of LDHA in cell growth and cell metabolism, we further investigated the biological functions of LDHA. Assays were carried out by transfecting wt‐p53‐overexpressing cells with LDHA‐overexpression plasmid. As expected, restoration of LDHA expression rescued p53‐induced inhibition of cell proliferation, colony formation and cell cycle progression in MCF7 cells (Figure 4A‐C), whereas p53 overexpression did not significantly affect cell proliferation in MDA‐MB‐231 cells with endogenous mut‐p53 (Figure S1F). Furthermore, restoring the expression of LDHA in p53‐overexpressing MCF7 cells also reversed p53‐induced cell apoptosis (Figure 4D). Simultaneously, we verified LDHA, CCND1, P21, CDK4, total‐PARP and cleaved‐PARP protein expression in cells with p53 overexpression and LDHA restoration. Consistent with the above results, p53 overexpression significantly reduced LDHA, CCND1 CDK4 and total‐PARP expression and increased p21 and cleaved‐PARP expression in p53‐overexpressing MCF7 cells. In contrast, restoring LDHA expression recovered expression of the above proteins related to the cell cycle and apoptosis (Figure 4E). Therefore, these results show that LDHA can reverse the regulation of cell growth and apoptosis by p53 in breast cancer cells with endogenous wt‐p53.
Figure 4.
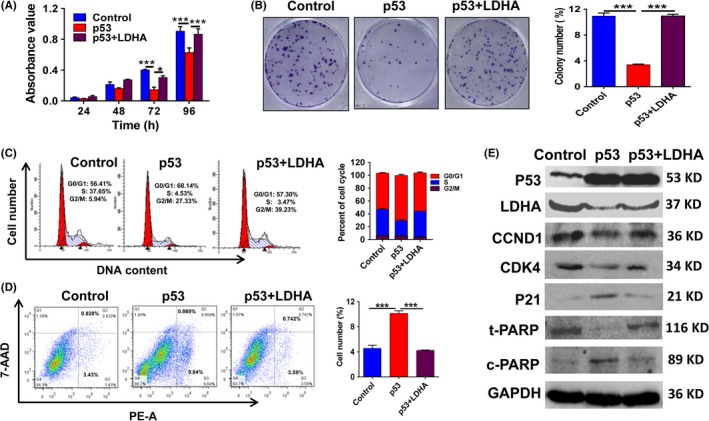
Lactate dehydrogenase A (LDHA) reverses the p53‐mediated malignant phenotype by inhibition of cell proliferation, cell cycle and cell apoptosis in MCF7 cells. A, CCK‐8 assays of MCF7 cells transfected with p53 alone or p53 plus LDHA expression plasmids. B, Colony‐forming assay images (left panel) and quantification of colony number percentages (right panel). C, Flow cytometry was done to assess variations in cell cycle distribution. Histogram of cell cycle distribution of MCF7 cells (right panel). D, Flow cytometry was carried out to assess variations in cell apoptosis distribution. Histogram of cell apoptosis distribution in MCF7 cells (right panel). E, Western blot confirmed p53, LDHA, CCND1, CDK4, P21, total‐poly ADP ribose polymerase (PARP), and cleaved‐PARP protein expression levels. All values are presented as mean ± SEM of triplicate measurements and were repeated three times. Bars, SE. *P < .05 ***P < .001
Several studies have shown that epithelial‐mesenchymal transition (EMT) in cancer cells is related to aerobic glycolysis (Warburg effect). For example, Lin et al21 showed that EMT in vitro and in vivo is connected with the origin of the Warburg effect and citrate synthase deregulation. To further determine whether p53 inhibits cell migration and invasion through LDHA in breast cancer cells, we designed the same rescue experiment as mentioned above. As expected, p53 overexpression attenuated the migration and invasive capabilities of MCF7 cells, whereas restoring LDHA expression significantly rescued cell migration and invasion deficit induced by p53 overexpression (Figure 5A,B). These results suggest that p53 can inhibit cell migration and invasion by negatively regulating LDHA in breast cancer cells. Then, we further examined the expression of some critical EMT‐related markers, including epithelial molecule marker Claudin1 and the mesenchymal molecule markers β‐catenin and Vimentin. The results showed that p53 upregulates the level of Claudin1 and downregulates the expression of β‐catenin and Vimentin, whereas restoring LDHA expression significantly rescues the regulation of p53 on Claudin1, β‐catenin and Vimentin in MCF7 cells (Figure 5C). The above results suggest that p53 inhibits EMT progression by inhibiting LDHA expression. Overall, these data suggest that p53 inhibited cell growth, cell migration and cell invasion and induced cell apoptosis by directly regulating LDHA in breast cancer cells with endogenous wt‐p53.
Figure 5.
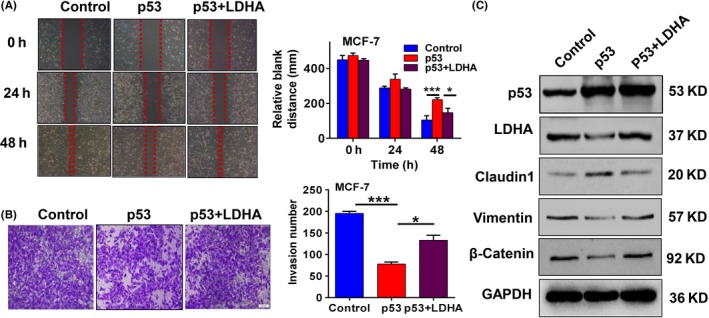
Lactate dehydrogenase A (LDHA) can reverse the inhibition effect of p53 on cell migration and invasion in breast cancer cells. MCF7 cells transfected with p53 alone or p53 plus LDHA expression plasmids. A, Cell migration detected by wound scratch assay. Data are summarized as the width ratio of migratory inhibition (right panel). B, Matrigel invasion assay shows different invasive abilities. Histogram of number of invasive MCF7 cells (right panel). C, Western blot confirmed p53, LDHA, Claudin1, Vimentin and β‐catenin protein expression levels. All values are presented as mean ± SEM of triplicate measurements and were repeated three times. Bars, SE. *P < .05, ***P < .001
3.5. Lactate dehydrogenase A reverses p53‐mediated tumor growth suppression in vivo
To further corroborate our results in vitro, we established nude mice transplant tumor models by s.c. injecting MCF7 cells transfected with negative control, wt‐p53, or p53 plus LDHA into skin on the left side of intact nude mice. As expected, ectopic expression of p53 decreased the growth rate and weight of the xenograft tumors, whereas restoring the expression of LDHA significantly rescued the inhibitory effect of p53 on tumor growth (Figure 6A‐D), and expression of p53 and LDHA in vivo was verified by immunohistochemistry analysis (Figure 6E). To further confirm the effect of the restoration of LDHA on tumor growth and apoptosis in vivo, we analyzed the expression levels of Ki67, p21, CCND1 and cleaved‐PARP, which are related to cell proliferation, the cell cycle and apoptosis by immunohistochemistry analysis. Consistent with the results in vitro, restoration of LDHA caused a significant increase in the expression of Ki67 and CCND1 expression and a reduction in p21 and cleaved‐PARP (C‐PARP) expression in vivo (Figure 7A). These results indicate that LDHA could rescue the tumor‐suppressive effect of p53 on tumor growth of breast cancer.
Figure 6.
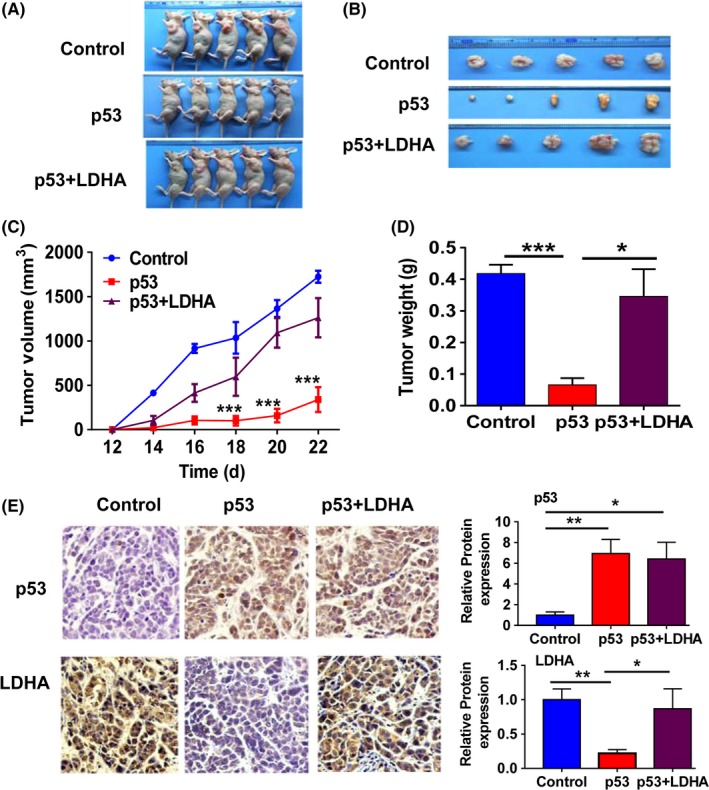
Lactate dehydrogenase A (LDHA) reversed the tumor growth suppressive effect of p53 in vivo. A‐B, Images of the MCF7 xenograft model in nude mice. C, Tumor growth curve of the MCF7 xenograft model in nude mice. D, Tumor weight quantification of the MCF7 xenograft model. E, Immunoblot analysis of p53 and LDHA expression in xenograft tumor tissues. Histogram of the different protein expressions (right panels). Bars, SE. *P < .05, **P < .01, ***P < .001
Figure 7.
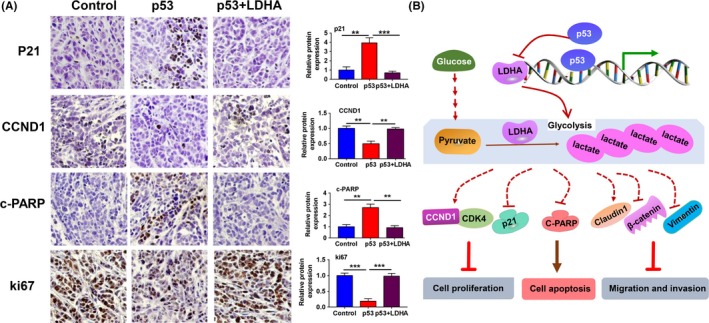
Lactate dehydrogenase A (LDHA) reversed the expression of some critical molecules related to cell proliferation, cell cycle and apoptosis induced by p53 in vivo. A, Immunoblot analysis of the expression of p21, CCND1, cleaved‐poly ADP ribose polymerase (PARP) and Ki67. Histogram of the different protein expressions (right panels). B, Schematic map showing that wt‐p53 inhibits breast cancer cell proliferation, invasion and metastasis by reducing glycolysis through direct inhibition of LDHA expression. **P < .01, ***P < .001
4. DISCUSSION
Lactate is the product of pyruvate catalyzed by LDHA in glycolysis, which cancer cells can use to fuel biochemical reactions providing sustenance for cancer cells. Abnormalities in glycolysis enzymes and epigenetic inheritance result in changes in the cell malignant phenotype, including cell proliferation, apoptosis, migration and invasion.22, 23 For example, M2 isoform of pyruvate kinase (PKM2), which is one of the critical enzymes in the Warburg effect, suppresses tumor growth through regulating glycolytic metabolites and cell proliferation.24 LDHA expression is elevated in both clinical samples and cell lines in breast cancer, and forced expression of LDHA promoted tumor growth and metastasis of breast cancer cells.12, 25, 26 Taxol‐resistant cells show increased LDHA expression and activity, which plays critical roles in Taxol resistance and cancer treatment.27 Therefore, LDHA might offer a promising therapeutic strategy for breast cancer. Herein, we found that the prognosis of breast cancer patients with high LDHA expression and low p53 expression was poorer than that with low LDHA expression and high p53 expression. In addition, increased LDHA expression was shown in lymph node‐positive breast cancer. However, the mechanism underlying LDHA overexpression in breast cancer remains unclear.
Many oncogenic proteins and tumor suppressors may regulate carcinogenesis through their regulatory roles in bioenergetics and metabolic pathways.15, 28, 29, 30 p53 represses the expression of several glycolytic enzymes in an indirect or direct way. Pyruvate can be converted into either lactate or acetyl‐coenzyme A (CoA) in reactions that are catalyzed by LDH and PDH, respectively. p53 increased PDH activity by downregulating the expression of mitochondrial PDH kinase 2 (PDK2).31 In the present study, we show that LDHA expression can be reduced by wt‐p53 through inhibiting the activity of the LDHA promoter at the transcriptional level. p53 directly binds to the transcriptional regulation region of LDHA in the BS#1 site. As we know, LDHA catalyzes pyruvate to lactate to promote glycolysis. Thus, reductions in LDHA expression via p53 directly reduce lactate production and thus influence the ability of glycolysis. Therefore, we detected the effect of the p53/LDHA axis on glycolysis. The results showed that low levels of LDH activity and lactate production and high levels of ATP content, PDH activity and glucose concentration were identified in the p53‐overexpressing group compared to the control, whereas restoring LDHA expression reverses the results in p53‐overexpressing cells. Our results suggest that the p53/LDHA axis plays critical roles in aerobic glycolysis in breast cancer.
Glycolysis is closely related to the malignant phenotype of tumors as described above.32 Therefore, we further carried out experiments to investigate the effect of the p53/LDHA axis on the malignant phenotype of breast cancer cells. The results indicated that overexpression of p53 in breast cancer cells results in tumor‐suppressive effects that were assessed by a series of experiments related to cell viability, cell cycle, apoptosis, migration, invasion and xenograft tumor models. In addition, restoring LDHA expression reverses the inhibitory effect of p53 on cell proliferation, cell cycle progression, apoptosis initiation, migration and tumor formation in breast cancer cells both in vitro and in vivo. LDHA regulates cell growth and migration in vitro and tumorigenesis in vivo by increasing c‐PARP and p21 and downregulating CCND1 and CDK4.33 In addition, 2‐DG, a glucose analogue, significantly inhibits growth, migration, and capillary formation and induces apoptosis. Oxamate, a competitive LDHA inhibitor, inhibits the growth of cervical, breast and liver cancer cells in vitro.34 Here, we reported that ectopic expression of p53 could increase 2‐DG or oxamate‐mediated cell proliferation inhibition, whereas restoring LDHA expression rescues the additive effect of p53. These findings are consistent with the notion that increased glycolysis contributes to the maintenance of cancer cell malignant phenotypes, suggesting that the p53/LDHA axis plays suppressive roles in breast cancer mainly or partially through the inhibition of glycolysis.
Lactate production is related to EMT in cancer cells, and dysregulated lactate metabolism and signaling are key elements in carcinogenesis.35, 36, 37 ATP levels can inhibit AMPK/p38AMPK signaling and upregulate Glut1 and Glut3 expression, thus regulating glucose uptake and glycolytic enzyme expression. Reactivating p53/TIGAR and SCO2 pathways can regulate EMT.21 Our assays showed that overexpressing wt‐p53 increases ATP levels and reduces lactate production, whereas restoring LDHA expression rescues the changes in ATP and lactate production that result from p53 overexpression. Therefore, reduced lactate production and increased ATP levels resulting from activation of the p53/LDHA axis inhibit cancer cell migration and invasion.
The p53 gene is one of the most frequently altered genes in a wide variety of tumor cells, the majority of p53 mutations apparently result in loss of function. Breast cancer is a tumor with a high frequency of p53 mutations, and most of the mutations occur in the DNA‐binding region of p53. p53 functions as a transcription factor through the formation of a homotetramer in the nucleus through its encoded protein, and any mutation in homotetramer subunits may affect the function of transcription regulation of the p53 tetramer. Thus, when a mutant p53 allele coexists with wt‐p53, the assembled p53 tetramer is a mixture of mutant and wild‐type p53 proteins and has no transcriptional regulatory function.38, 39, 40 Based on the dominant‐negative regulation of mutant p53 on wild‐type p53, we fully considered the background of p53 in breast cancer cells or tissues when we studied the effect of p53 on LDHA expression and biological phenotype. Our results demonstrated that transcriptional expression of p53 was negatively correlated with LDHA in wt‐p53 breast cancer tissues and cells. In wt‐p53 breast cancer cells, p53 regulates LDHA transcription activity and expression by directly binding to the LDHA promoter region, thereby inhibiting cell proliferation, cell cycle, cell migration, invasion and glycolysis and inducing apoptosis (Figure 7B). However, overexpression of wt‐p53 in MDA‐MB‐231 cells with p53 mutation, expression of LDHA, glycolysis and cell proliferation showed no significant changes. This finding also indicates that the tetramer formed by wt‐p53 and mutant p53 loses its inhibitory effect on LDHA expression and related biological phenotypes, suggesting that p53 is involved only in the inhibition of glycolysis and malignant biological phenotypes in wild‐type breast cancer cells or tissues through targeting LDHA regulation.
In conclusion, our study showed that wt‐p53 inhibits glycolysis and tumor growth and metastasis through direct inhibition of LDHA expression in breast cancer.
CONFLICTS OF INTEREST
Authors declare no conflicts of interest for this article.
Supporting information
ACKNOWLEDGMENTS
This work was supported by grants from the National Natural Science Foundation of China (grant nos. 81772990 and 81572748), the “111” project (grant no. 111‐2‐12), the Free Exploration Program of Central South University (grant nos. 2018zzts233 and 2018zzts823).
Zhou Y, Niu W, Luo Y, et al. p53/Lactate dehydrogenase A axis negatively regulates aerobic glycolysis and tumor progression in breast cancer expressing wild‐type p53. Cancer Sci. 2019; 110: 939–949. 10.1111/cas.13928
Yao Zhou and Weihong Niu Contributed equally.
REFERENCES
- 1. Puzio‐Kuter AM. The role of p53 in metabolic regulation. Genes & Cancer. 2011;2:385‐391. [DOI] [PMC free article] [PubMed] [Google Scholar]
- 2. Vander HM, Cantley LC, Thompson CB. Understanding the Warburg effect: the metabolic requirements of cell proliferation. Science. 2009;324:1029‐1033. [DOI] [PMC free article] [PubMed] [Google Scholar]
- 3. Vousden KH, Ryan KM. p53 and metabolism. Nat Rev Cancer. 2009;9:691‐700. [DOI] [PubMed] [Google Scholar]
- 4. Fu Y, Liu S, Yin S, et al. The reverse Warburg effect is likely to be an Achilles’ heel of cancer that can be exploited for cancer therapy. Oncotarget. 2017;8:57813‐57825. [DOI] [PMC free article] [PubMed] [Google Scholar]
- 5. Lunt SY, Vander HM. Aerobic glycolysis: meeting the metabolic requirements of cell proliferation. Annu Rev Cell Dev Biol. 2011;27:441‐464. [DOI] [PubMed] [Google Scholar]
- 6. Gomes AS, Ramos H, Soares J, Saraiva L. p53 and glucose metabolism: an orchestra to be directed in cancer therapy. Pharmacol Res. 2018;131:75‐86. [DOI] [PubMed] [Google Scholar]
- 7. Levine AJ, Oren M. The first 30 years of p53: growing ever more complex. Nat Rev Cancer. 2009;9:749‐758. [DOI] [PMC free article] [PubMed] [Google Scholar]
- 8. Gnanapradeepan K, Basu S, Barnoud T, et al. The p53 Tumor Suppressor in the Control of Metabolism and Ferroptosis. Front Endocrinol. 2018;9:124. [DOI] [PMC free article] [PubMed] [Google Scholar]
- 9. Zhang C, Lin M, Wu R, et al. Parkin, a p53 target gene, mediates the role of p53 in glucose metabolism and the Warburg effect. Proc Natl Acad Sci USA. 2011;108:16259‐16264. [DOI] [PMC free article] [PubMed] [Google Scholar]
- 10. Hu W, Zhang C, Wu R, et al. Glutaminase 2, a novel p53 target gene regulating energy metabolism and antioxidant function. Proc Natl Acad Sci USA. 2010;107:7455‐7460. [DOI] [PMC free article] [PubMed] [Google Scholar]
- 11. Chung FZ, Tsujibo H, Bhattacharyya U, Sharief FS, Li SS. Genomic organization of human lactate dehydrogenase‐A gene. Biochem J. 1985;231:537‐541. [DOI] [PMC free article] [PubMed] [Google Scholar]
- 12. Miao P, Sheng S, Sun X, Liu J, Huang G. Lactate dehydrogenase a in cancer: A promising target for diagnosis and therapy. IUBMB Life. 2013a;65:904‐910. [DOI] [PubMed] [Google Scholar]
- 13. Allison SJ, Knight JRP, Granchi C, et al. Identification of LDH‐A as a therapeutic target for cancer cell killing via (i) p53/NAD(H)‐dependent and (ii) p53‐independent pathways. Oncogenesis. 2014;3:e102‐e102. [DOI] [PMC free article] [PubMed] [Google Scholar]
- 14. Ong ALC, Ramasamy TS. Role of Sirtuin1‐p53 regulatory axis in aging, cancer and cellular reprogramming. Ageing Res Rev. 2018;43:64‐80. [DOI] [PubMed] [Google Scholar]
- 15. Niu W, Luo Y, Wang X, et al. BRD7 inhibits the Warburg effect and tumor progression through inactivation of HIF1α/LDHA axis in breast cancer. Cell Death Dis. 2018;9:519. [DOI] [PMC free article] [PubMed] [Google Scholar] [Retracted]
- 16. Liu Y, Zhao R, Wei Y, et al. BRD7 expression and c‐Myc activation forms a double‐negative feedback loop that controls the cell proliferation and tumor growth of nasopharyngeal carcinoma by targeting oncogenic miR‐141. J Exp Clin Cancer Res. 2018;37:64. [DOI] [PMC free article] [PubMed] [Google Scholar]
- 17. Zhao R, Liu Y, Wang H, et al. BRD7 plays an anti‐inflammatory role during early acute inflammation by inhibiting activation of the NF‐κB signaling pathway. Cell Mol Immunol. 2017;14:830‐841. [DOI] [PMC free article] [PubMed] [Google Scholar]
- 18. Liu Y, Zhao R, Wang H, et al. miR‐141 is involved in BRD7‐mediated cell proliferation and tumor formation through suppression of the PTEN/AKT pathway in nasopharyngeal carcinoma. Cell Death Dis. 2016;7:e2156. [DOI] [PMC free article] [PubMed] [Google Scholar]
- 19. Luo Y, Wang X, Niu W, et al. Elevated microRNA‐125b levels predict a worse prognosis in HER2‐positive breast cancer patients. Oncol Lett. 2017;13:867‐874. [DOI] [PMC free article] [PubMed] [Google Scholar]
- 20. Drost J, Mantovani F, Tocco F, et al. BRD7 is a candidate tumour suppressor gene required for p53 function. Nat Cell Biol. 2010;12:380‐389. [DOI] [PubMed] [Google Scholar]
- 21. Lin CC, Cheng TL, Tsai WH, et al. Loss of the respiratory enzyme citrate synthase directly links the Warburg effect to tumor malignancy. Sci Rep‐UK. 2012;2:785. [DOI] [PMC free article] [PubMed] [Google Scholar]
- 22. Pacini N, Borziani F. Cancer stem cell theory and the Warburg effect, two sides of the same coin? Int J Mol Sci. 2014;15:8893‐8930. [DOI] [PMC free article] [PubMed] [Google Scholar]
- 23. Xie H, Hanai J, Ren JG, et al. Targeting lactate dehydrogenase‐A inhibits tumorigenesis and tumor progression in mouse models of lung cancer and impacts tumor‐initiating cells. Cell Metab. 2014;19:795‐809. [DOI] [PMC free article] [PubMed] [Google Scholar]
- 24. Anastasiou D, Yu Y, Israelsen WJ, et al. Pyruvate kinase M2 activators promote tetramer formation and suppress tumorigenesis. Nat Chem Biol. 2012;8:839‐847. [DOI] [PMC free article] [PubMed] [Google Scholar]
- 25. Li L, Kang L, Zhao W, et al. miR‐30a‐5p suppresses breast tumor growth and metastasis through inhibition of LDHA‐mediated Warburg effect. Cancer Lett. 2017;400:89‐98. [DOI] [PubMed] [Google Scholar]
- 26. Giatromanolaki A, Koukourakis MI, Simopoulos C, et al. c‐erbB‐2 related aggressiveness in breast cancer is hypoxia inducible factor‐1alpha dependent. Clin Cancer Res. 2004;10:7972‐7977. [DOI] [PubMed] [Google Scholar]
- 27. Zhou M, Zhao Y, Ding Y, et al. Warburg effect in chemosensitivity: targeting lactate dehydrogenase‐A re‐sensitizes taxol‐resistant cancer cells to taxol. Mol Cancer. 2010;9:33. [DOI] [PMC free article] [PubMed] [Google Scholar]
- 28. Shi M, Cui J, Du J, et al. A Novel KLF4/LDHA Signaling Pathway Regulates Aerobic Glycolysis in and Progression of Pancreatic Cancer. Clin Cancer Res. 2014;20:4370‐4380. [DOI] [PMC free article] [PubMed] [Google Scholar]
- 29. Cui J, Shi M, Xie D, et al. FOXM1 promotes the Warburg effect and pancreatic cancer progression via transactivation of LDHA expression. Clin Cancer Res. 2014;20:2595‐2606. [DOI] [PMC free article] [PubMed] [Google Scholar]
- 30. Guan SY, Leng RX, Tao JH, et al. Hypoxia‐inducible factor‐1alpha: a promising therapeutic target for autoimmune diseases. Expert Opin Ther Targets. 2017;21:715‐723. [DOI] [PubMed] [Google Scholar]
- 31. Kruiswijk F, Labuschagne CF, Vousden KH. p53 in survival, death and metabolic health: a lifeguard with a licence to kill. Nat Rev Mol Cell Biol. 2015;16:393‐405. [DOI] [PubMed] [Google Scholar]
- 32. Warburg O. On respiratory impairment in cancer cells. Science. 1956;124:267‐269. [PubMed] [Google Scholar]
- 33. Sheng SL, Liu JJ, Dai YH, et al. Knockdown of lactate dehydrogenase A suppresses tumor growth and metastasis of human hepatocellular carcinoma. FEBS J. 2012;279:3898‐3910. [DOI] [PubMed] [Google Scholar]
- 34. Sheng H, Tang W. Glycolysis inhibitors for anticancer therapy: a review of recent patents. Recent Pat Anticancer Drug Discov. 2016;11:297‐308. [DOI] [PubMed] [Google Scholar]
- 35. San‐Millan I, Brooks GA. Reexamining cancer metabolism: Lactate production for carcinogenesis could be the purpose and explanation of the Warburg effect. Carcinogenesis. 2016;38:119. [DOI] [PMC free article] [PubMed] [Google Scholar]
- 36. Kroemer G, Pouyssegur J. Tumor cell metabolism: cancer's Achilles’ heel. Cancer Cell. 2008;13:472‐482. [DOI] [PubMed] [Google Scholar]
- 37. Hirschhaeuser F, Sattler UGA, Mueller‐Klieser W. Lactate: a metabolic key player in cancer. Cancer Res. 2011;71:6921‐6925. [DOI] [PubMed] [Google Scholar]
- 38. Sigal A, Rotter V. Oncogenic mutations of the p53 tumor suppressor: the demons of the guardian of the genome. Cancer Res. 2000;60:6788‐6793. [PubMed] [Google Scholar]
- 39. Cadwell C, Zambetti GP. The effects of wild‐type p53 tumor suppressor activity and mutant p53 gain‐of‐function on cell growth. Gene. 2001;277:15‐30. [DOI] [PubMed] [Google Scholar]
- 40. Willis A, Jung EJ, Wakefield T, Chen X. Mutant p53 exerts a dominant negative effect by preventing wild‐type p53 from binding to the promoter of its target genes. Oncogene. 2004;23:2330. [DOI] [PubMed] [Google Scholar]
Associated Data
This section collects any data citations, data availability statements, or supplementary materials included in this article.
Supplementary Materials