Abstract
Nanotransducer-mediated photothermal therapy (PTT) has emerged as an attractive therapy modality against cancer, but its efficacy is often limited by the amount of nanoparticles delivered to tumors. Previous studies showed a vasculature modulation treatment, which dilates or prunes tumor blood vessels, may enhance tumor uptake of nanoparticles. However, exploiting these approaches for improved PTT has seldom been studied. In this study, we investigated the impact of mild hyperthermia or anti-angiogenesis therapy on PTT. Briefly, we gave tumor-bearing balb/c mice low doses of sunitinib or submerged tumors in a 42 °C water bath. Next, we injected PEGylated reduced graphene oxide (RGO-PEG) and irradiated the tumors to induce PTT. We then followed up the treatment with multi-parameter MRI. Contrary to expectation, both vessel modulation strategies led to diminished PTT efficacy. Our results show that vessel modulation does not warrant improved PTT, and should be carefully gauged when used in combination with PTT.
Keywords: photothermal therapy, reduced graphene oxide, nanoparticles, magnetic resonance imaging, hyperthermia1
Introduction
Photothermal therapy, or PTT, is emerging as a new type of cancer treatment modality. PTT employs nanotransducers that can efficiently convert photon energy to thermal energy. Under photo-irradiation, nanotransducers generate a large amount of heat and can induce thermal ablation of adjacent cancer cells. PTT is focal, is minimally invasive, and incurs no resistance1. Unlike other focal therapy options such as photodynamic therapy and radiation therapy, PTT is not dependent on tissue oxygen levels. Hence, it may be exploited to kill cancer cells lying within the hypoxia region of a tumor. PTT can work alone or in combination with other treatment modalities including radiation therapy2, chemotherapy3, immunotherapy4, and photodynamic therapy.5 These unique features have stimulated intensive research, leading to the generation of a wealth of nanomaterials with high photo-to-heat conversion efficiency. Examples include gold nanorods6, gold nanocubes7, gold nanoshells8, graphene oxides9, 10, transition metal sulfide or oxide nanocrystals11–14, and porphyrin-based nanoassemblies1, 15, 16. Among them, PTT with silica-cored gold nanoshells (Aurolase Therapy) has entered clinical trials for treatment of primary and/or metastatic lung tumors and refractory and/or recurrent head and neck tumors17.
However, PTT, like many other cancer therapy options, is limited by the amount of therapeutic agents, in this case nano-transducers, that are delivered to the tumor areas. The tumor accumulation is mainly mediated by the enhanced permeability and retention (EPR) effect, referring to the fact that tumor vasculature is often leaky and more accessible to long circulating nanoparticles 17. However, the EPR effect is dependent on tumors of different types, stages, and locations 18–20. Factors such as interstitial fluid pressure (IFP) and impaired blood supply may adversely affect the overall tumor uptake of nanoparticles and their penetration into the central area of a tumor, leading to incomplete tumor ablation 17, 21–23. To address the issue, it is proposed that a vessel modulation treatment is applied prior to PTT to improve the nanotransducer delivery. The approaches include anti-angiogenesis therapy 22, hyperthermia 24, and vasculature-targeting photodynamic therapy 25, which can dilate or prune tumor blood vessels thereby augmenting nanoparticle extravasation and deposition. These approaches have shown promise in enhancing the delivery of macromolecule- or nanoparticle-based chemotherapeutics 25–28. Studies on utilizing these methods to enhance PTT, however, are relatively few.
In this study, we investigate whether mild hyperthermia or low-dose anti-angiogenesis therapy can enhance PTT (Figure 1). For mild hyperthermia, we submerged tumors in 42 °C water bath for 1 h. Similar incubation conditions were used by other groups and are clinically relevant 29. This temperature is insufficient to induce effective cancer cell death but would enhance blood perfusion and vessel permeability, an impact that may last for several hours post heating 29–31. As a comparison, temperature higher than 42 °C would cause hemorrhage and stasis in tumor vessels 30. For anti-angiogenesis therapy, we used sunitinib, an FDA-approved multi-targeted receptor tyrosine kinase inhibitor 32. Previous studies showed that sunitinib at a relatively low dosage can transiently normalize tumor vasculature, leading to enhanced blood inflow and oxygenation33. With regard to PTT, we used PEGylated reduced graphene oxide (RGO-PEG). RGO-PEG affords high photothermal efficiency, low toxicity, and a long circulation half-life, making it a very promising nanotransducer for PTT 10, 34. We performed RGO-PEG PTT in 4T1 tumor bearing balb/c mice, subsequent to mild hyperthermia or sunitinib treatment. Vascular changes in tumor were monitored by dynamic contrast enhanced-magnetic resonance imaging (DCE-MRI). We then followed the therapy by magnetic resonance imaging (MRI), using diffusion weighted imaging (DWI), and T2*-weighted imaging. The treatment timeline is shown in Figure S1.
Figure 1.
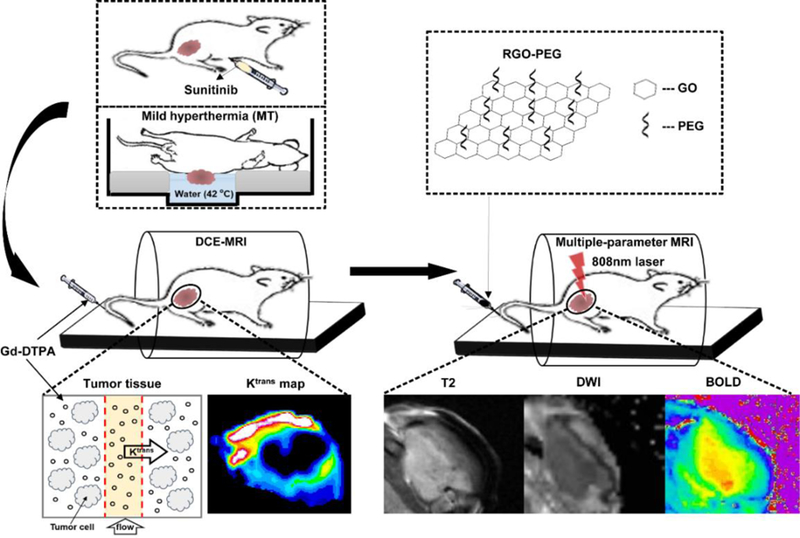
Schematic illustration of dynamic contrast-enhanced MRI, diffusion-weighted MRI and T2*-weighted MRI detection of tumor response to vasculature modification-PTT combination therapy.
Methods
Preparation of PEG-RGO
PEG-RGO was prepared following our published protocol 34. Briefly, RGO was obtained by reducing graphene oxide (GO), prepared by a modified Hummer method with flake expandable graphite) with hydrazine hydrate at 95°C for 24 h under magnetic stirring. The product was collected by filtration and purified by washing with deionized water. Subsequently, RGO was modified with PEGylated poly(maleic anhydride-alt-1-octadecene), or C18PMH. The amphiphilic conjugate, C18PMH-PEG5000-NH2, was synthesized by incubating C18PMH with a mixture of mPEG-NH2 (5 kDa, PEG Bio, China) and Boc-NH-PEG-NH2 (5 kDa, PEG-Bio, China) at a ratio of 1:3 for 1 h. The Boc group was removed afterward by trifluoroacetic acid. The raw product was dialyzed against deionized water with dialysis membrane (MWCO=14 kDa) and then lyophilized. Finally, PEGylation of RGO was achieved by sonicating a mixture of RGO (0.5 mg) and C18PMH-PEG5000-NH2 (5 mg) for 90 min followed by centrifugation at 15000 rpm for 3.5 h. The final product was collected by membrane filtration (0.1 μm) removing excess C18PMH-PEG5000-NH2.
Characterization of RGO-PEG
RGO-PEG size was characterized by atomic force microscopy. 1 ml of RGO-PEG (28, 56, and 112 μg /mL in PBS) in centrifuge tubes was irradiated with an 808-nm laser. The temperature chang was monitored by a FLIR Ax5 camera. Phantoms of RGO-PEG (0.05, 0.10, 0.20, 0.39, 0.78, and 1.55 mg/mL) were studied by PA imaging on an Endra Nexus 128 system.
In vivo therapy
All animal procedures were approved by the Animal Care and Use Committee (ACUCC) of Xiamen University in China. 1×10⁶ 4T1 cells were injected subcutaneously in the right hind flank of female Balb/c mice (5–6 weeks) in 100 μL of PBS. Mice were randomized into three groups (n=5) for similar average tumor size in each group. Mice were treated when tumors grew to 80–100 mm3. The end point of survival is when tumor volume reaches 600 mm3. Mice were anesthetized during treatment and imaging with isoflurane (1.5% in air).
In this study, mild hyperthermia (MT) and sunitinib (SU) were selected to modulate tumor vasculature. For MT-treated group, mice were anesthetized and placed in a special holder with tumors being submerged in a 42 °C water bath for 1 h. Previous studies showed that MT-induced vascular changes can remain for 24 h post treatment 35. For SU-treated group, mice were i.p. injected with sunitinib (Pfizer, Inc., 40 mg/kg body weight daily) in DMSO/PBS (2:1) for 4 consecutive days.
DCE-MRI was performed on all mice before and after tumor vessel modulation to assess tumor vascular changes (details are depicted in the MRI protocol and data analysis section). After the second DCE-MRI acquisition, mice were i.v. injected with RGO-PEG (2 mg/mL, 200 μL). Photoacoustic (PA) tomography imaging was then conducted with preclinical PA computerized tomography scanner (Endra Nexus 128) to monitor particle accumulation in tumors at different time points p.i. up to 24 h. At 24 h post i.v. administration of RGO-PEG, photothermal therapy (PTT) was carried out by irradiating the tumor of each mouse with an 808-nm laser. The local temperature in tumor reached ~52°C in ~1.5 min and was then maintained for 15 min by adjusting laser power (1.5–2 W/cm2). Local temperature and infrared thermographic maps were obtained by real-time thermal imaging with FLIR Ax5 camera.
MRI protocol and data analysis
All MRI measurements were done on a 9.4T small animal MRI scanner (Bruker, Germany). For imaging, all the mice were anesthetized with 1.5% isoflurane/air (v/v) by inhalation and were placed in a prone position stretching on a respiration sensor.
DCE-MRI was conducted before and after tumor vessel modulating treatment to assess tumor vascular changes prior to laser-induced tumor therapy. Gd-DTPA (Magnevistt, Schering, Berlin) was used as the contrast agent for DCE-MRI. Firstly, the required baseline T1 map was obtained via an inversion recovery fast low angle shot gradient echo sequence: TR/TE = 1200 ms/10.0 ms, filed of view (FOV) = 3×3 cm, matrix = 256×256, slice thickness = 1.00 mm, FA = 180°, averages = 1, 3 slices. Then dynamic T1-weighted images were acquired with the following parameters: TR/TE = 44.8 ms/4.6 ms, FOV = 3×3 cm, matrix = 64×64, slice thickness = 1.00 mm, FA = 45°, averages = 1, 5 slices, number of repetitions = 500. A bolus of Gd-DTPA (0.05 mmol/kg) was delivered via a jugular catheter using a syringe pump at a rate of 2.4 mL/min 1 min 23 s after the start of the dynamic scan.
Anatomic MRI, T2*-weighted MRI, and DWI were performed to follow laser-induced therapeutic outcomes in all mice before and after PTT at indicated time points (30 min, 1, 2, 3, 5, 7, and 10 days).
Two-dimensional T2-weighted axial and coronal fast spin-echo sequence images were first acquired to monitor tumor volume changes during therapy using the following parameters: TR/TE = 2500 ms/33 ms, FOV = 4×4 cm, matrix = 256×256, FA =180°, slice thickness = 1 mm, 13 contiguous slices.
T2*-weighted imaging was conducted to obtain R2* values using multi-echo sequence based on the following parameters: TR = 1500 ms, TE =10, 16, 22, 28, 34, 40, 46, 52, 58, 64 and 70 ms, FOV = 4×4 cm, matrix = 256×256, FA =180°, slice thickness = 1.5 mm, 11 contiguous slices. T2*-maps were generated by using built-in software (Paravision5.1, Bruker);
DWI was acquired to assess the change of ADC (apparent diffusion coefficient) values using standard spin echo sequence, which is TR/TE = 3000 ms/27 ms, FOV= 4×4 cm, matrix = 128×128, FA = 90°, slice thickness = 1.5 mm, 11 contiguous slices, b values=0, 1000 s/mm2. Diffusion gradients were applied in three orthogonal gradient directions (x, y, and z). Trace images were obtained using the same software mentioned above. ADC maps were acquired in all groups.
In the data analysis for DCE-MRI, the kinetic parametric maps were determined by non-linear least-squares fittings of the time-course data in each voxel with the generalized kinetic model, or the extended Kety model 36–39:
where Ct and Cp are the tracer concentration in the tissue and blood plasma, respectively; Ktrans is the volume transfer constant; and ve and vp are the extravascular extracellular volume fraction and blood plasma volume fraction in the tissue, respectively. The arterial input function (AIF) is individually determined for each animal with an automated AIF extraction algorithm searching for the voxels containing arteries with minimum partial volume contamination in the DCE datasets 40. Before the model fitting, the DCE-MRI data were visually examined and some poor-quality time points with strong subject’s motion were manually removed. All MRI image processing and data analyses were performed using in-house programs written in MATLAB (The Mathworks, Natick, MA, USA).
The maximum diameters of a tumor in three dimensions were measured using a caliper tool provided by the viewing and analysis software on axial and coronal T2-weighted images. Tumor volumes were calculated based on A×B×C×0.5, where A, B, and C are the maximum diameters of a tumor in anterior to posterior, left to right (in axial T2-weighted images), and cranial to caudal direction (in coronal T2-weighted images), respectively. T2* maps and ADC maps were calculated on a pixel-by-pixel basis using the built-in software. T2* was calculated using a nonlinear exponential fit of the gradient-echo signal of the multiple gradient-echo and spin-echo sequence41.
For T2* value and ADC value measurement, the region of interest (ROI)s of tumor were drawn on the image of the first echo of multi-TE T2*-weighted imaging with no diffusion sensitizing gradient of DWI, which most clearly delineate tumor boundary, and they were subsequently copied to the parametric maps. T2* relaxation time and ADC values were obtained by averaging values of all voxels within each ROI. ROIs were drawn as 1 mm peripheral shell of the whole tumor at both host-tumor and skin-tumor interfaces for each slice. To minimize a potential dependence of the results on the accuracy of ROIs definition, the ROI analyses were carried out by two independent readers and the results were determined by consensus.
Histological studies
After the last DCE-MRI imaging scan, one animal from each group was sacrificed and the tumors were harvested for CD31 analysis. Tumors were imbedded in optimal-cutting-temperature (O.C.T.) compound and later on sectioned into 4-µm thick slices. Tumor sections were fixed with ice-cold acetone for 20 min. After blocking non-specific binding sites with 1% BSA for 30 min, the sections were incubated with anti-CD31 antibody (Abcam) for 1 h at room temperature. After PBS wash, the sections were incubated with Alexa Fluor 488 anti-rat secondary antibody (Invitrogen) at room temperature. The slides were then mounted with DAPI-containing mounting medium after PBS wash. Fluorescence images were taken on a fluorescence microscope (Leica, Germany). Quantitative analysis of CD31-positive area was performed by ImageJ software. For hematoxylin and eosin (H&E) staining, one tumor from each group was collected 5 days post PTT and fixed with 4% formaldehyde solutions at room temperature for 48 h.
Statistical analysis
The experimental data were analyzed by two-tailed student’s t-test and one-way ANOVA followed by Bonferroni’s post hoc test. P <0.05 indicates a significant difference.
Results
Preparation and characterization of RGO-PEG
We prepared RGO following our published protocol 34, 42. C18PMH-PEG5000-NH2, an amphiphilic compound, was imparted to the RGO surface through hydrophobic-hydrophobic interaction. The resulting RGO-PEG was well dispersed in PBS and can be visualized as individual nanosheets under atomic force microscopy (AFM, Figure 2A). The physical and pharmacological properties of RGO-PEG have been reported by us and others43–45. The size of RGD-PEG was 50–60 nm according AFM analysis and it agreed with previous studies 43, 44. The intrinsic relatively high tumor uptake was observed in previous studies with radionuclide 131I labeled RGO-PEG 43. Due to strong and broad absorbance in the near-infrared (NIR) spectrum window, RGO-PEG mediates efficient light-to-heat conversion 10. We assessed this by irradiating RGO-PEG solutions of three different concentrations (28, 56, and 112 μg/mL) using an 808 nm laser (0.5 W cm−2, Figure 2B), and then monitoring the temperature changes by a FLIR Ax5 camera. For all three concentrations, we observed time-dependent temperature increase. For 112 µg/ml RGO-PEG in particular, the temperature increased to ~70°C within 5 min of photo-irradiation (Figure 2C). We also assessed the photo-thermal effect by photoacoustic (PA) imaging in a separate phantom study using an Endra Nexus 128 system (Figure 2D). We observed a concentration dependent response (Figure 2D), again confirming the efficient light-to-heat conversion by RGO-PEG.
Figure 2.
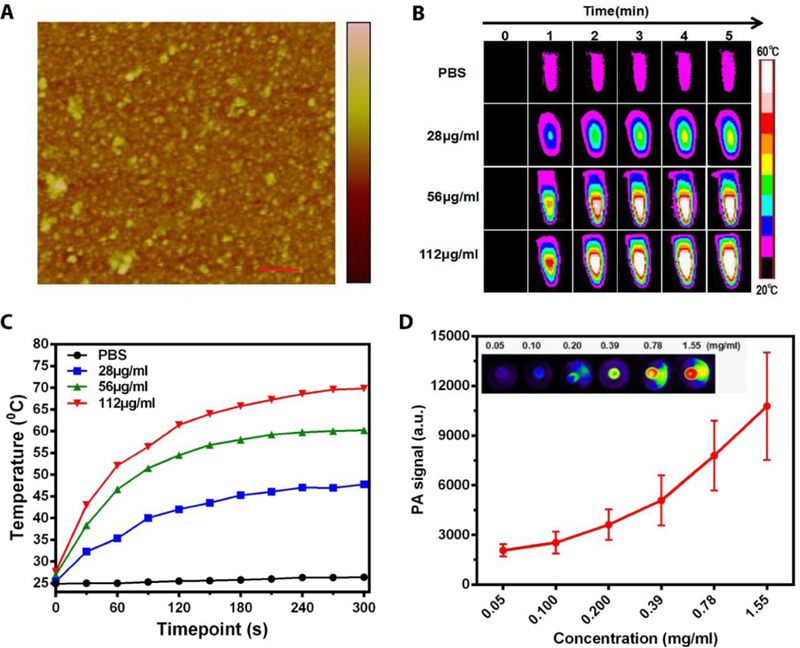
Characterization of RGO-PEG. (A) Atomic force microscopy (AFM) image of RGO-PEG. scale bar, 200nm. (B) The photothermal effect of RGO-PEG in PBS was investigated in vitro by irradiation with an 800-nm laser (0.5 W cm−2, 5 min). (C) Temperature increase curve for sample and PBS in (B). (D) Photoacoustic effect of RGO-PEG in vitro.
Impact to vasculature
We assessed the vasculature impact in vivo with balb/c mice bearing ~100 mm3 4T1 tumors (n = 5). For the mild hyperthermia (MT) group, we bathed the tumor area in 42°C water for 1 h. Temperature calibration studies of MT were performed with phantoms of water and RGO aqueous solution. Our water bath system heated the samples to 42°C within 5 min (Figure S2B and C). The temperature stayed at 42°C with negligible fluctuation (Figure S2A). For the sunitinib (SU) group, we intraperitoneally (i.p.) injected the drug at 40 mg/kg/day to the animals for a consecutive of 4 days. For comparison, we also included a group of animals receiving no treatment. We then assessed the vasculature permeability in tumor areas by DCE-MRI. One issue is that the central areas of tumors are often desvascularized, which manifest as non-enhanced regions with misleading low signals. To minimize the impact from these necrotic cores, we only analyzed signal changes in the peripheral region of a tumor (~1 mm thick) 46, 47. Moreover, it is common that the skin-tumor and host-tumor interfaces show marked difference in DCE-MRI. For better analysis, we circled ROIs for both regions (Figure 3A) and plotted the time-signal intensity (TSI) curves separately (Figure 3B).
Figure 3.
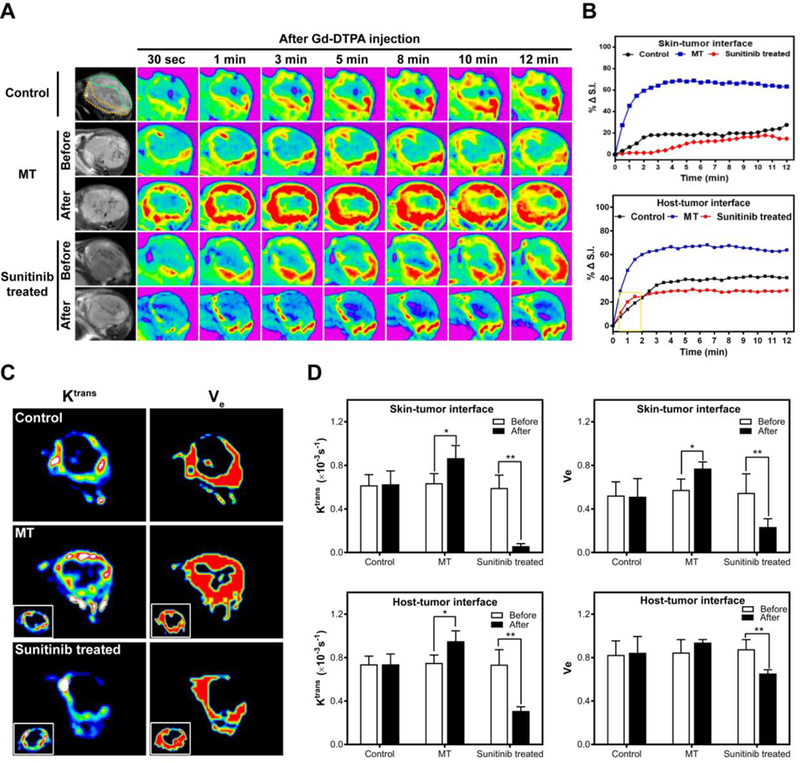
DCE-MRI of control, MT-treated and sunitinib-treated tumors. (A) T1-weighted images were taken at different time points after iv injection of Gd-DTPA. (B) Relative signal intensity (%ΔS.I.) time curve of the ROI. (C) Ktrans – and Ve –mapping. (D) Ktrans and Ve changes after vasculature modification. * P<0.05, ** P<0.01.
Relative to the control group, the MT group showed a significant signal increase in DCE-MRI (Figure 3B). Specifically, at 12 min, the signal intensity increase relative to the 0 min (%ΔS.I.) was 58.9% and 60.8% at the skin-tumor and host-tumor interfaces, respectively. As a comparison, the 12-min %ΔS.I. was 22.58% and 40.51% in the control group. This was attributed to the ability of MT to dilate blood vessels and enhance the permeability. Surprisingly, the SU group showed lower enhancement than the control, showing %ΔS.I. values of 9.72% and 29.92%, respectively, at the skin-tumor and host-tumor interfaces.
We also analyzed Ktrans and Ve (Figure 3C and3D). These are important parameters for understanding the underlying features of vascular anatomy and physiology. In particular, Ktrans is an indicator of blood flow and vessel permeability 48, and Ve describes the extravascular space volume fraction 49. For the MT group, we observed increase of Ktrans and Ve at both the skin-tumor and host-tumor interfaces, although the Ve change at the host-tumor interface was barely significant (P=0.18). For the SU group, on the other hand, Ktrans and Ve values for both the skin-tumor and host-tumor interfaces were decreased. The impact was more dramatic at the skin-tumor interface, where the Ktrans and Ve values were reduced by 71% and 33%, respectively.
Next, we assessed the impact of the treatments on tumor vascularity using anti-CD31 immunohistochemistry staining (Figure 4A). We found a comparable vasculature density in the MT group relative to the control group. On the contrary, much reduced vasculature density was observed in the SU group. By Image J analysis, we found that CD31 positive staining area was reduced by 27% after SU treatment (Figure 4B). These results suggest that the anti-angiogenesis treatment led to decreased vascularity, and the latter was a main factor behind the reduced %S.I., Ktrans, and Ve. The increase of these values in the MT group, on the other hand, is likely attributed to heat-induced vessel dilation, IFP decrease, and vascular permeability enhancement, which were observed in previous studies 50.
Figure 4.
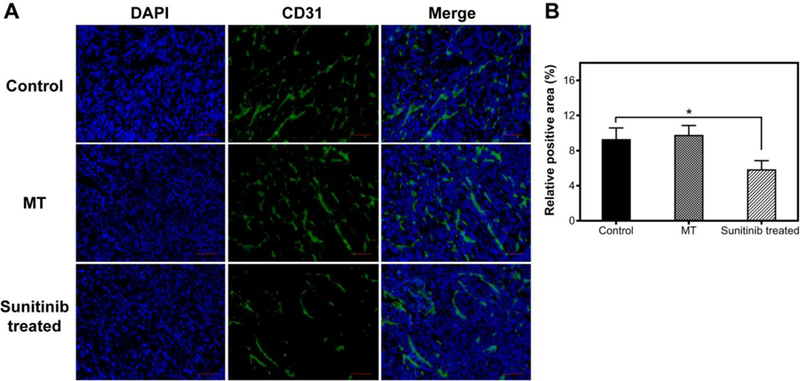
(A) CD31 staining of tumors with or without vasculature modification. (B) Quantitative analysis of CD31 positive areas using Image J software. Scale bars, 100 μm.
Impact to tumor uptake of RGO-PEG
We next assessed the impact of the MT or SU on tumor uptake of RGO-PEG. We used the same MT and SU procedures to treat 4T1 tumor bearing mice, and then i.v. injected RGO-PEG (2 mg/ml, 200 µl) into the animals (n=5). Dewhirst et al. found that MT in the range from 40 to 42°C led to increased nanoparticle extravasation, with higher temperature causing more significant tumor deposition. Interestingly, the enhancement effect is not transient but can persist for as long as 6 hours post heating 30. Similar sustained vessel dilation was also observed by others 29. We performed photoacoustic (PA) tomography at selected time points to monitor the particle accumulation in tumor areas (Figure 5A). Consistent with the DCE-MRI observations, MT-treatment led to enhanced RGO-PEG accumulation in tumors, showing a relative PA signal intensity increase by 80% at 24 h (Figure 5B). On the other hand, there was only a marginal increase of signal in SU treated tumors (10% at 24 h, Figure 5B).
Figure 5.
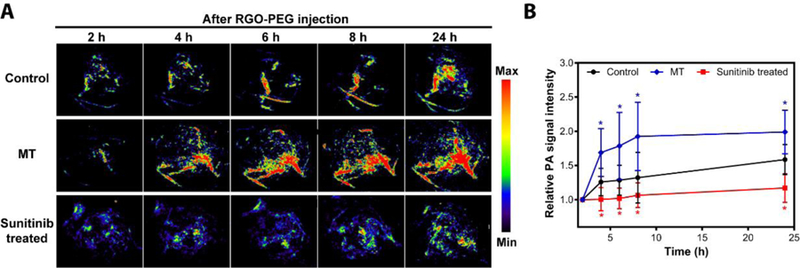
(A) In vivo photoacoustic imaging of tumors with or without vasculature modification at different time points after iv injection of RGO-PEG. (B) PA signal intensity curve in tumors (n = 5).
Photothermal therapy and longitudinal MRI follow-up
Finally, we examined the impact of MT/SU treatment on RGO-PEG-mediated PTT. We first used the same MT or SU protocols to treat animals. On the day of PTT, we i.v. injected RGO-PEG (200 µl, 0.4 mg per mouse) into 4T1 tumor bearing animals and applied an 808 nm laser (1–2.5 W/cm2, 15 min) at 24 h post injection (p.i.) to the tumor areas. The tumor temperature was monitored in real-time by a FLIR Ax5 thermal camera (Figure 6A). For comparison, mice receiving PTT only or PBS only was also studied. Surprisingly, the most effective treatment came from the PTT only group. In that case, the tumor size continuously shrank after irradiation, and was almost completely eradicated by Day 10 (Figure 6B). For the MT and SU groups, on the other hand, the tumor growth was arrested early, but followed by a relapse after Day 10 (Figure 6B). Such a difference in therapy outcomes was also confirmed by histology studies with tissue samples taken at 15 min after PTT. Compared to the MT and SU groups, the PTT-only group manifested a significantly reduced level of viable cells (Figure 7).
Figure 6.
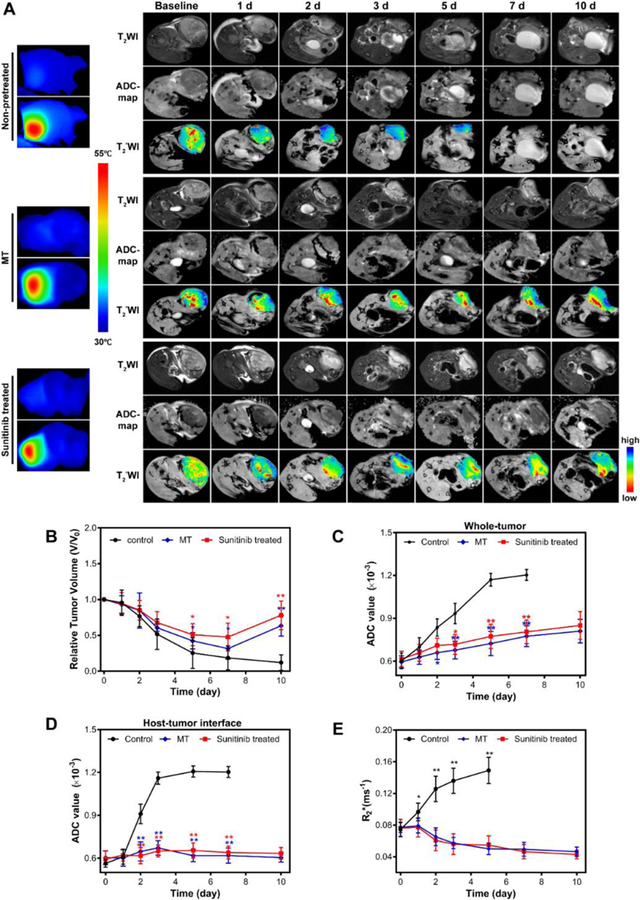
(A) Temperature mapping of tumors during PTT and T2–weighted, ADC map and T2*-weighted images taken at different time points after PTT of pretreated or non-pretreated tumors. Pseudocolor R2*-map was overlapped with T2*-weighted images to highlight the signal intensity changes. (B) Tumor growth curve measured by T2–weighted MRI. (C) ADC value changes of whole tumor after PTT combined with vasculature modification or not. (D) ADC value changes of host-tumor interface. (E) Tumor R2* changes. Lower R2* values indicate better tissue oxygenation.
Figure 7.
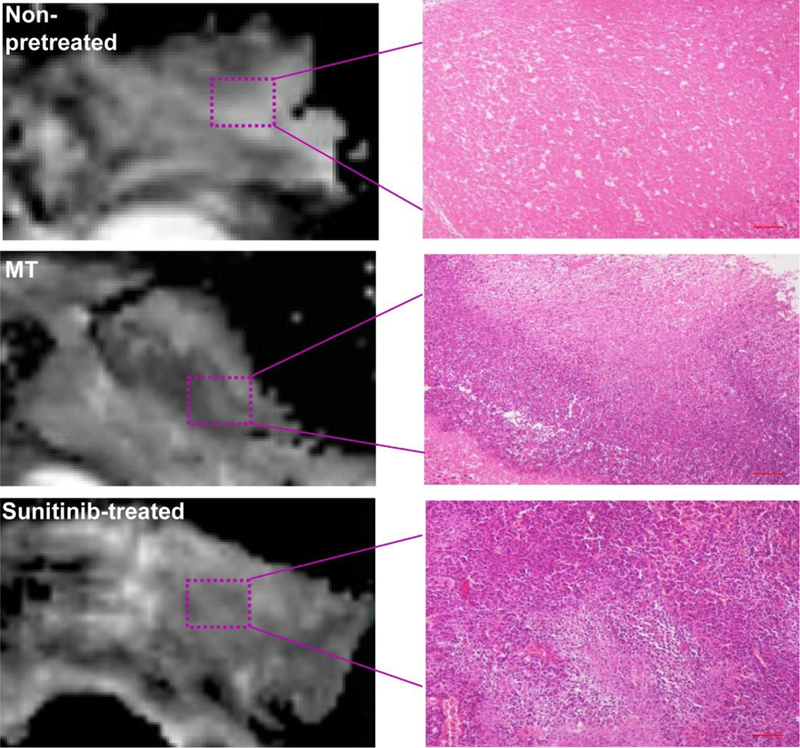
Representative ADC-maps as well as H&E images of tumors after PTT treatment. Scale bars, 500 µm.
To better understand the therapy outcomes, we performed DW and T2*-weighted MRI to follow up the treatment (Figure 6A). The PTT-only group showed the most significant increase of apparent diffusion coefficient (ADC). Specifically, the value increased from (0.601 ± 0.054) ×10−3 mm2/sec on Day 0, to (0.933 ± 0.071) ×10−3 mm2/sec on Day 5, to (1.17 ± 0.044) ×10−3 mm2/sec on Day 7. As a comparison, both MT and SU groups only showed moderate ADC increase (Figure 6C). Such a difference in ADC is even more dramatic at the host-tumor interface. For the PTT-only group, the ADC value in the region increased from (0.563 ± 0.038) × 10−3 mm2/sec on Day 0 to (1.16 ± 0.043) ×10−3 mm2/sec on Day 3 (Figure 6D). According to our recent studies, such a leap of ADC post treatment suggests good prognosis 51. As a comparison, both MT and SU groups showed only marginal increase at the host-tumor interface throughout the 10-day study (Figure 6D). These results corroborate with the histology observations (Figure 7), indicating that both approaches negatively affect the ability of PTT to eradicate cancer cells lying deep beneath the skin.
Finally, we studied the impact of vessel modulation on tissue oxygenation by T2*-weighted MRI. Previous studies showed that R2* value is negatively correlated with tissue oxygenation level. In particular, a higher R2* indicates worse tissue oxygenation and better prognosis 47. For all treatment groups, we circled ROIs encompassing the 1-mm-thick tumor peripheral at the host-tumor interface (Figure 6A). PTT-only group showed a significant increase in R2* value, which was 0.074 ± 0.009, 0.126 ± 0.016, and 0.149 ± 0.017 ms−1 on Day 0, Day 2, and Day 5, respectively. In contrast, there was a constant drop of R2* value in the SU and MT groups (Figure 6E). All of these data suggest that the SU and MT treatment did not facilitate PTT, but rather made it less efficient.
Discussion
In this study, we treated 4T1 tumor-bearing animals with either mild hyperthermia or low-dose sunitinib and then assessed the impact of the treatment on RGO-PEG-mediated PTT. Compared to PTT alone, both treatments led to reduced therapy efficacy. This is in contrast to our expectation since many previous studies showed that vasculature-modulating treatments facilitate nanoparticle-based therapy. The explanation is likely to differ between the two approaches. For sunitinib, it seems that the treatment mainly reduced the microvessel density rather than normalized vasculature, despite the opposite observation in previous studies 33. The anti-vascular effects led to significantly decreased accumulation of RGO-PEG in tumor (Figure 4 and 5), and diminished PTT efficiency. It suggests that different tumor types have varied response to anti-angiogenesis therapy and needs to be gauged carefully for enhanced nanoparticle delivery.
On the other hand, our results imply that local MT increases tumor vasculature permeability, which facilitates RGO-PEG accumulation in tumors. Still, the resulting PTT is less effective than PTT alone. This observation seems counterintuitive and the exact cause is unknown. According to Liu et al., under MT, the intratumoral nanoparticle distribution is largely heterogeneous, with the extravasation and accumulation at the tumor periphery much more significant than in the center 52. Soni et al. investigated the extent of PTT thermal energy penetration by Monte Carlo simulation 53. Their calculations reveal that when nanoparticles are mostly accumulated at the tumor periphery, the majority of the thermal energy would be deposited close to the skin. This increases surface temperature significantly, while the temperature in the tumor core remains unchanged. We speculate that a similar impact is behind the less efficient PTT after MT. While the overall RGO-PEG tumor accumulation was increased after MT, the enhanced PTT was most effective at the superficial position. It is even possible that the surface RGO-PEG absorbs so much incident light that cancer cells lying deep become less accessible to the irradiation. This speculation is supported by the observation that R2* at the host-tumor interface was decreased in the MT group, despite of an overall increased nanoparticle accumulation. However, the current observation was made with one tumor model and one type of PTT agent. Future studies are needed to better understand the mechanisms and potentially exploit them for improved PTT. Possible solutions include improving intratumoral nanoparticle diffusion and optimizing irradiation plans (nanoparticle-light interval, doses, and fluence rates, etc.)
In summary, our results suggest that vasculature modulation does not necessarily improve treatment efficacy of PTT. In particular, while the overall tumor uptake of PTT agents is increased after MT, the PTT outcomes could be diminished, possibly due to inhomogeneous nanoparticle distribution and associated with that, the negative impact of superficial nanoparticles on light penetration. For optimal PTT, it is important to elucidate the relationship between intratumoral nanoparticle distribution and energy deposition and monitor spatiotemporal temperature distribution during PTT 54.
Supplementary Material
Acknowledgement
This work was supported by the Department of Defense (CDMRP grant CA140666, J.X.), the National Science Foundation (CAREER grant NSF1552617, J.X.), and the National Institutes of Health (R01 grants R01EB022596, J.X., and R01NS093314, F.W.). We also thank the National Natural Science Foundation of China (NSFC) (81471655, F.Z.).
Footnotes
Abbreviations: ADC, apparent diffusion coefficient; AFM, atomic force microscopy; BSA, bovine serum albumin; C18PMG, poly(maleic anhydride-alt-1-octadecene); DAPI, 4',6-diamidino-2-Phenylindole, dihydrochloride; DCE-MRI, dynamic contrast enhanced magnetic resonance imaging; DWI, diffusion weighted imaging; FA, flip angle; FOV, field of view; Gd-DTPA, gadopentetic acid; GO, graphene oxide; H & E: hematoxylin and eosin; i.v., intravenously; i.p., intraperitoneally; MRI, magnetic resonance imaging; MT, mild hyperthermia; PA, photoacoustic; O. C. T., optimal-cutting-temperature; PBS, phosphate buffered saline; p.i., post injection PTT, photothermal therapy; RGO-PEG, PEGylated reduced graphene oxide; ROI, region of interest; SU, sunitinib; TE, time to echo; TEM, transmission electron microscopy; TR, time repetition; TSI, time-signal intensity.
Reference
- 1.Jin CS, Lovell JF, Chen J and Zheng G, Ablation of hypoxic tumors with dose-equivalent photothermal, but not photodynamic, therapy using a nanostructured porphyrin assembly. ACS nano 2013;7:2541–50 [DOI] [PMC free article] [PubMed] [Google Scholar]
- 2.Zhou M, Chen Y, Adachi M, Wen X, Erwin B, Mawlawi O, et al. , Single agent nanoparticle for radiotherapy and radio-photothermal therapy in anaplastic thyroid cancer. Biomaterials 2015;57:41–9 [DOI] [PMC free article] [PubMed] [Google Scholar]
- 3.Zhang W, Guo Z, Huang D, Liu Z, Guo X and Zhong H, Synergistic effect of chemo-photothermal therapy using PEGylated graphene oxide. Biomaterials 2011;32:8555–61 [DOI] [PubMed] [Google Scholar]
- 4.Chen Q, Xu L, Liang C, Wang C, Peng R and Liu Z, Photothermal therapy with immune-adjuvant nanoparticles together with checkpoint blockade for effective cancer immunotherapy. Nat Commun 2016;7:13193. [DOI] [PMC free article] [PubMed] [Google Scholar]
- 5.Cao J, An H, Huang X, Fu G, Zhuang R, Zhu L, et al. , Monitoring of the tumor response to nano-graphene oxide-mediated photothermal/photodynamic therapy by diffusion-weighted and BOLD MRI. Nanoscale 2016;8:10152–9 [DOI] [PubMed] [Google Scholar]
- 6.Dickerson EB, Dreaden EC, Huang X, El-Sayed IH, Chu H, Pushpanketh S, et al. , Gold nanorod assisted near-infrared plasmonic photothermal therapy (PPTT) of squamous cell carcinoma in mice. Cancer letters 2008;269:57–66 [DOI] [PMC free article] [PubMed] [Google Scholar]
- 7.Wu X, Ming T, Wang X, Wang P, Wang J and Chen J, High-photoluminescence-yield gold nanocubes: for cell imaging and photothermal therapy. ACS nano 2010;4:113–20 [DOI] [PubMed] [Google Scholar]
- 8.Day ES, Thompson PA, Zhang L, Lewinski NA, Ahmed N, Drezek RA, et al. , Nanoshell-mediated photothermal therapy improves survival in a murine glioma model. Journal of neuro-oncology 2011;104:55–63 [DOI] [PMC free article] [PubMed] [Google Scholar]
- 9.Yang K, Zhang S, Zhang G, Sun X, Lee ST and Liu Z, Graphene in mice: ultrahigh in vivo tumor uptake and efficient photothermal therapy. Nano letters 2010;10:3318–23 [DOI] [PubMed] [Google Scholar]
- 10.Robinson JT, Tabakman SM, Liang Y, Wang H, Casalongue HS, Vinh D, et al. , Ultrasmall reduced graphene oxide with high near-infrared absorbance for photothermal therapy. J Am Chem Soc 2011;133:6825–31 [DOI] [PubMed] [Google Scholar]
- 11.Wang S, Chen Y, Li X, Gao W, Zhang L, Liu J, et al. , Injectable 2D MoS2 -Integrated Drug Delivering Implant for Highly Efficient NIR-Triggered Synergistic Tumor Hyperthermia. Advanced materials 2015;27:7117–22 [DOI] [PubMed] [Google Scholar]
- 12.Liu J, Zheng X, Yan L, Zhou L, Tian G, Yin W, et al. , Bismuth sulfide nanorods as a precision nanomedicine for in vivo multimodal imaging-guided photothermal therapy of tumor. ACS nano 2015;9:696–707 [DOI] [PubMed] [Google Scholar]
- 13.Liu T, Wang C, Gu X, Gong H, Cheng L, Shi X, et al. , Drug delivery with PEGylated MoS2 nano-sheets for combined photothermal and chemotherapy of cancer. Advanced materials 2014;26:3433–40 [DOI] [PubMed] [Google Scholar]
- 14.Zhou Z, Kong B, Yu C, Shi X, Wang M, Liu W, et al. , Tungsten oxide nanorods: an efficient nanoplatform for tumor CT imaging and photothermal therapy. Scientific reports 2014;4:3653. [DOI] [PMC free article] [PubMed] [Google Scholar]
- 15.Zou Q, Abbas M, Zhao L, Li S, Shen G and Yan X, Biological Photothermal Nanodots Based on Self-Assembly of Peptide-Porphyrin Conjugates for Antitumor Therapy. Journal of the American Chemical Society 2017;139:1921–1927 [DOI] [PubMed] [Google Scholar]
- 16.Lovell JF, Jin CS, Huynh E, Jin H, Kim C, Rubinstein JL, et al. , Porphysome nanovesicles generated by porphyrin bilayers for use as multimodal biophotonic contrast agents. Nature materials 2011;10:324–32 [DOI] [PubMed] [Google Scholar]
- 17.Chen F and Cai W, Nanomedicine for targeted photothermal cancer therapy: where are we now? Nanomedicine (Lond) 2015;10:1–3 [DOI] [PMC free article] [PubMed] [Google Scholar]
- 18.Bertrand N, Wu J, Xu X, Kamaly N and Farokhzad OC, Cancer nanotechnology: the impact of passive and active targeting in the era of modern cancer biology. Advanced drug delivery reviews 2014;66:2–25 [DOI] [PMC free article] [PubMed] [Google Scholar]
- 19.Yan Y, Such GK, Johnston AP, Best JP and Caruso F, Engineering particles for therapeutic delivery: prospects and challenges. ACS nano 2012;6:3663–9 [DOI] [PubMed] [Google Scholar]
- 20.Prabhakar U, Maeda H, Jain RK, Sevick-Muraca EM, Zamboni W, Farokhzad OC, et al. , Challenges and key considerations of the enhanced permeability and retention effect for nanomedicine drug delivery in oncology. Cancer research 2013;73:2412–7 [DOI] [PMC free article] [PubMed] [Google Scholar]
- 21.Su S, Ding Y, Li Y, Wu Y and Nie G, Integration of photothermal therapy and synergistic chemotherapy by a porphyrin self-assembled micelle confers chemosensitivity in triple-negative breast cancer. Biomaterials 2016;80:169–178 [DOI] [PubMed] [Google Scholar]
- 22.Jain RK, Normalizing tumor vasculature with anti-angiogenic therapy: a new paradigm for combination therapy. Nature medicine 2001;7:987–9 [DOI] [PubMed] [Google Scholar]
- 23.Heldin CH, Rubin K, Pietras K and Ostman A, High interstitial fluid pressure - an obstacle in cancer therapy. Nature reviews. Cancer 2004;4:806–13 [DOI] [PubMed] [Google Scholar]
- 24.Kong G, Braun RD and Dewhirst MW, Hyperthermia enables tumor-specific nanoparticle delivery: effect of particle size. Cancer research 2000;60:4440–5 [PubMed] [Google Scholar]
- 25.Zhen Z, Tang W, Chuang YJ, Todd T, Zhang W, Lin X, et al. , Tumor vasculature targeted photodynamic therapy for enhanced delivery of nanoparticles. ACS nano 2014;8:6004–13 [DOI] [PMC free article] [PubMed] [Google Scholar]
- 26.Griffin RJ, Dings RP, Jamshidi-Parsian A and Song CW, Mild temperature hyperthermia and radiation therapy: role of tumour vascular thermotolerance and relevant physiological factors. International journal of hyperthermia : the official journal of European Society for Hyperthermic Oncology, North American Hyperthermia Group 2010;26:256–63 [DOI] [PMC free article] [PubMed] [Google Scholar]
- 27.Urano M, Invited Review: For the clinical application of thermochemotherapy given at mild temperatures. International Journal of Hyperthermia 1999;15:79–107 [DOI] [PubMed] [Google Scholar]
- 28.Teicher BA, A systems approach to cancer therapy. (Antioncogenics + standard cytotoxics-->mechanism(s) of interaction). Cancer metastasis reviews 1996;15:247–72 [DOI] [PubMed] [Google Scholar]
- 29.Li L, ten Hagen TL, Bolkestein M, Gasselhuber A, Yatvin J, van Rhoon GC, et al. , Improved intratumoral nanoparticle extravasation and penetration by mild hyperthermia. J Control Release 2013;167:130–7 [DOI] [PubMed] [Google Scholar]
- 30.Kong G, Braun RD and Dewhirst MW, Characterization of the effect of hyperthermia on nanoparticle extravasation from tumor vasculature. Cancer Res 2001;61:3027–32 [PubMed] [Google Scholar]
- 31.Song CW, Park H and Griffin RJ, Improvement of tumor oxygenation by mild hyperthermia. Radiation research 2001;155:515–28 [DOI] [PubMed] [Google Scholar]
- 32.Le Tourneau C, Raymond E and Faivre S, Sunitinib: a novel tyrosine kinase inhibitor. A brief review of its therapeutic potential in the treatment of renal carcinoma and gastrointestinal stromal tumors (GIST). Therapeutics and clinical risk management 2007;3:341–8 [DOI] [PMC free article] [PubMed] [Google Scholar]
- 33.Matsumoto S, Batra S, Saito K, Yasui H, Choudhuri R, Gadisetti C, et al. , Antiangiogenic agent sunitinib transiently increases tumor oxygenation and suppresses cycling hypoxia. Cancer Res 2011;71:6350–9 [DOI] [PMC free article] [PubMed] [Google Scholar]
- 34.Yang K, Wan J, Zhang S, Tian B, Zhang Y and Liu Z, The influence of surface chemistry and size of nanoscale graphene oxide on photothermal therapy of cancer using ultra-low laser power. Biomaterials 2012;33:2206–14 [DOI] [PubMed] [Google Scholar]
- 35.van den Tempel N, Horsman MR and Kanaar R, Improving efficacy of hyperthermia in oncology by exploiting biological mechanisms. Int J Hyperthermia 2016;32:446–54 [DOI] [PubMed] [Google Scholar]
- 36.Tofts PS, Brix G, Buckley DL, Evelhoch JL, Henderson E, Knopp MV, et al. , Estimating kinetic parameters from dynamic contrast-enhanced T(1)-weighted MRI of a diffusable tracer: standardized quantities and symbols. Journal of magnetic resonance imaging : JMRI 1999;10:223–32 [DOI] [PubMed] [Google Scholar]
- 37.Kermode PSTAG, Measurement of the blood‐brain barrier permeability and leakage space using dynamic MR imaging. 1. Fundamental concepts. Magnetic Resonance in Medicine 1991;17:357–367 [DOI] [PubMed] [Google Scholar]
- 38.Barnes SL, Whisenant JG, Loveless ME and Yankeelov TE, Practical dynamic contrast enhanced MRI in small animal models of cancer: data acquisition, data analysis, and interpretation. Pharmaceutics 2012;4:442–78 [DOI] [PMC free article] [PubMed] [Google Scholar]
- 39.McGrath DM, Bradley DP, Tessier JL, Lacey T, Taylor CJ and Parker GJ, Comparison of model-based arterial input functions for dynamic contrast-enhanced MRI in tumor bearing rats. Magn Reson Med 2009;61:1173–84 [DOI] [PubMed] [Google Scholar]
- 40.Parker G JA., Waterton J, Buckley DL, 2003. Automated arterial input function extraction for T1-weighted DCE-MRI The International Society for Magnetic Resonance in Medicine, Toronto, Ontario, Canada: pp 1264 [Google Scholar]
- 41.Christen T, Lemasson B, Pannetier N, Farion R, Remy C, Zaharchuk G, et al. , Is T2* enough to assess oxygenation? Quantitative blood oxygen level-dependent analysis in brain tumor. Radiology 2012;262:495–502 [DOI] [PMC free article] [PubMed] [Google Scholar]
- 42.Shi S, Yang K, Hong H, Valdovinos HF, Nayak TR, Zhang Y, et al. , Tumor vasculature targeting and imaging in living mice with reduced graphene oxide. Biomaterials 2013;34:3002–9 [DOI] [PMC free article] [PubMed] [Google Scholar]
- 43.Chen L, Zhong X, Yi X, Huang M, Ning P, Liu T, et al. , Radionuclide (131)I labeled reduced graphene oxide for nuclear imaging guided combined radio- and photothermal therapy of cancer. Biomaterials 2015;66:21–8 [DOI] [PubMed] [Google Scholar]
- 44.Yang K, Feng L, Hong H, Cai W and Liu Z, Preparation and functionalization of graphene nanocomposites for biomedical applications. Nature protocols 2013;8:2392–403 [DOI] [PMC free article] [PubMed] [Google Scholar]
- 45.Kai Yang LH, Ma Xingxing, Ye Shuoqi, Cheng Liang, Shi Xiaoze, Li Changhui, Li Yonggang, Liu Zhuang, Multimodal Imaging Guided Photothermal Therapy using Functionalized Graphene Nanosheets Anchored with Magnetic Nanoparticles. Advanced materials 2012;24:1868–1872 [DOI] [PubMed] [Google Scholar]
- 46.Jeon TY, Kim CK, Kim JH, Im GH, Park BK and Lee JH, Assessment of early therapeutic response to sorafenib in renal cell carcinoma xenografts by dynamic contrast-enhanced and diffusion-weighted MR imaging. Br J Radiol 2015;88:20150163. [DOI] [PMC free article] [PubMed] [Google Scholar]
- 47.Li SP, Taylor NJ, Makris A, Ah-See ML, Beresford MJ, Stirling JJ, et al. , Primary human breast adenocarcinoma: imaging and histologic correlates of intrinsic susceptibility-weighted MR imaging before and during chemotherapy. Radiology 2010;257:643–52 [DOI] [PubMed] [Google Scholar]
- 48.Choyke PL, Dwyer AJ and Knopp MV, Functional tumor imaging with dynamic contrast-enhanced magnetic resonance imaging. J Magn Reson Imaging 2003;17:509–20 [DOI] [PubMed] [Google Scholar]
- 49.Thompson EM, Pishko GL, Muldoon LL and Neuwelt EA, Inhibition of SUR1 decreases the vascular permeability of cerebral metastases. Neoplasia 2013;15:535–43 [DOI] [PMC free article] [PubMed] [Google Scholar]
- 50.Sen A, Capitano ML, Spernyak JA, Schueckler JT, Thomas S, Singh AK, et al. , Mild elevation of body temperature reduces tumor interstitial fluid pressure and hypoxia and enhances efficacy of radiotherapy in murine tumor models. Cancer Res 2011;71:3872–80 [DOI] [PMC free article] [PubMed] [Google Scholar]
- 51.Fu G, Zhu L, Yang K, Zhuang R, Xie J and Zhang F, Diffusion-Weighted Magnetic Resonance Imaging for Therapy Response Monitoring and Early Treatment Prediction of Photothermal Therapy. ACS Appl Mater Interfaces 2016;8:5137–47 [DOI] [PMC free article] [PubMed] [Google Scholar]
- 52.Liu P, Zhang A, Xu Y and Xu LX, Study of non-uniform nanoparticle liposome extravasation in tumour. International journal of hyperthermia : the official journal of European Society for Hyperthermic Oncology, North American Hyperthermia Group 2005;21:259–70 [DOI] [PubMed] [Google Scholar]
- 53.Soni S, Tyagi H, Taylor RA and Kumar A, Investigation on nanoparticle distribution for thermal ablation of a tumour subjected to nanoparticle assisted thermal therapy. Journal of thermal biology 2014;43:70–80 [DOI] [PubMed] [Google Scholar]
- 54.Stafford RJ, Shetty A, Elliott AM, Schwartz JA, Goodrich GP and Hazle JD, MR temperature imaging of nanoshell mediated laser ablation. International journal of hyperthermia : the official journal of European Society for Hyperthermic Oncology, North American Hyperthermia Group 2011;27:782–90 [DOI] [PMC free article] [PubMed] [Google Scholar]
Associated Data
This section collects any data citations, data availability statements, or supplementary materials included in this article.


