

Summary:
Recent reports ind icate hypoxia influences the circadian clock through the transcriptional activities of hypoxia inducible factors (HIFs) at clock genes. Unexpectedly, we uncover a profound disruption of the circadian clock and diurnal transcriptome when hypoxic cells are permitted to acidify, recapitulating the tumor microenvironment. Buffering against acidification or inhibiting lactic acid production fully rescues circadian oscillation. Acidification of several human and murine cell lines, as well as primary murine T cells, suppresses mechanistic target of rapamycin complex 1 (mTORC1) signaling, a key regulator of translation in response to metabolic status. We find acid drives peripheral redistribution of normally perinuclear lysosomes away from perinuclear RHEB, inhibiting lysosome-bound mTOR activity. Restoring mTORC1 signaling and the translation it governs rescues clock oscillation, revealing a model in which acid produced during the cellular metabolic response to hypoxia suppresses the circadian clock through diminished translation of clock constituents.
Keywords: circadian, clock, acidity, pH, cancer, mTOR, lysosome, hypoxia inducible factor, hypoxia, RHEB
Introduction
Some prokaryotes and most eukaryotes possess a form of a circadian clock, reflecting convergent evolution of the ability to align biologic processes with the day-night cycle (Dibner and Schibler, 2015). In mammals, the clock circadian regulator (CLOCK) and brain and muscle ARNT-like 1 (BMAL1) heterodimer drives expression of many E-box containing genes, including those encoding CLOCK-BMAL1 inhibitors, the period (PER) and cryptochrome (CRY) proteins. This, together with reinforcing secondary loops, generates oscillating clock transcription factor activities and consequentially circadian rhythmicity within a given tissue of hundreds of transcripts largely involved in metabolism (Takahashi, 2017).
Despite their physiologic benefit, the temporal constraints imposed by a clock might pose a liability for cells during stress. Intriguingly, links have been uncovered between cancer and circadian disruption, such as oncogenic MYC suppressing the clock (Altman et al., 2015; Walton et al., 2018). Low oxygen levels in solid tumors stabilize hypoxia inducible factor (HIF) transcription factors that heighten anaerobic glycolysis and thereby acidify the tumor microenvironment (Semenza, 2013). Given that regulation of metabolism is a key clock function, we wondered if hypoxia might alter the clock. Indeed, recent papers have shown HIFs to be capable of influencing various clock transcripts in a cell-type-dependent manner (Adamovich et al., 2017; Peek et al., 2017; Wu et al., 2017). Here, we report a more profound suspension of the circadian clock and transcriptome when hypoxic cells are permitted to acidify their environment (Figure 1A). Pursuing the underlying clock-suppressive mechanism reveals a previously undescribed means by which low pH potently inhibits the key regulator of cellular metabolism mechanistic target of rapamycin complex 1 (mTORC1).
Figure 1 -. Hypoxic metabolism suspends the circadian clock through generation of acid.
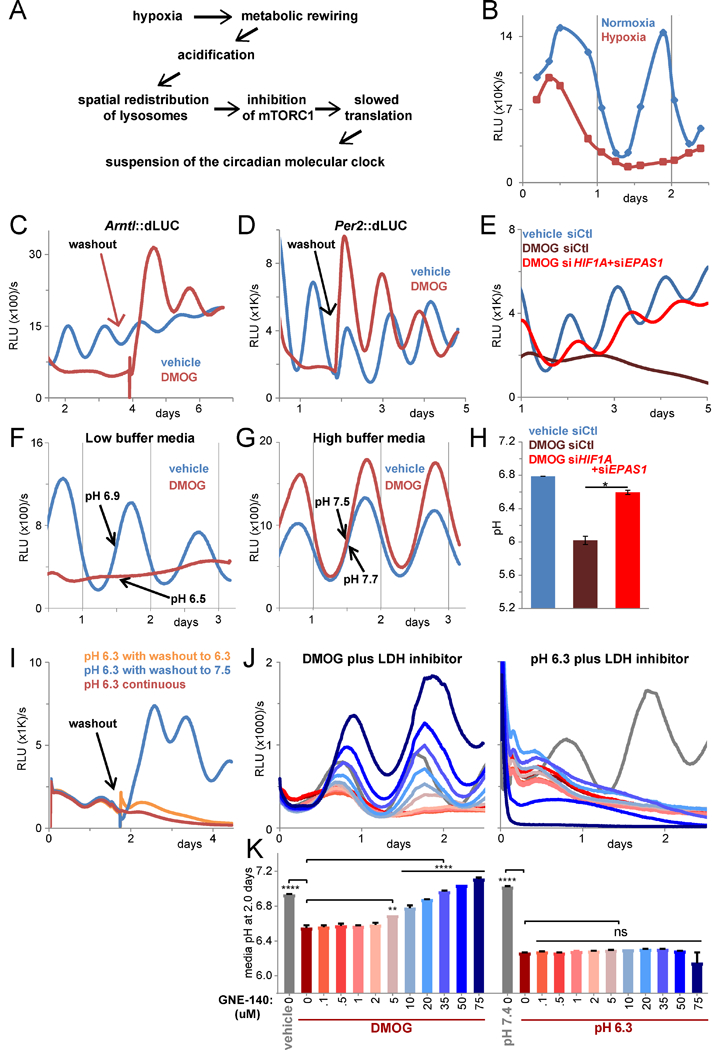
A. Graphical summary. B. Lysate luciferase activity (relative light units (RLU) per second) of U2OS Arntl::dLUC cells in normoxia or hypoxia (1% O2). RE of 2, 1–3 BR each. C. Luminescence of U2OS Arntl::dLUC cells treated with 750 uM DMOG or vehicle. DMOG washout at 4 d. RE of >5. D. Per2::dLUC as in C with 1 mM DMOG. Vehicle/DMOG washout at 7 d. RE of 2, 1–3 BR. E. Luminescence of U2OS Arntl::dLUC cells treated with control siRNA (siCtl) or siRNA against HIFα subunits prior to 750 uM DMOG. Mean of 3 BR. RE of 3. F./G. Luminescence of U2OS Arntl::dLUC cells treated with 1 mM DMOG or vehicle in low (F) or high (G) buffer media. Mean of 2 BR. RE of >5. Mean media pH after 1.5 d of 2 parallel BR (standard error of the mean (SEM) <0.05). H. Media pH after siRNA and 4 d DMOG treatment in low buffer media as in E. Mean of 2 BR ± SEM. T-test (unpaired, 2-tailed, unequal variances) *p≤0.05. I. Luminescence of U2OS Arntl::dLUC cells in triplicate in pH 6.3 media. Media of two plates exchanged for pH 7.5 (washout) or 6.3 (mock washout) media after 1.5 d. RE of >3. J./K. Luminescence (J) and media pH after 2 d (K) of U2OS Arntl::dLUC cells treated with vehicle or 750 uM DMOG (left) or pH 7.4 or pH 6.3 media (right) and the indicated concentration of GNE- 140 (color-coded as K). Mean of 2 BR (± SEM in K). One-way ANOVA/post-hoc Dunnett’s **p≤0.01, ****p≤0.0001, ns = p>0.05. RE of 3. All cells B-K synchronized (see Methods). d = days. h = hours. RE = representative experiment. BR = biological replicates. See also Figure S1.
Results
Hypoxia suspends the clock through acid
To explore the effect of hypoxia on the clock, we utilized the U2OS Arntl::dLUC circadian reporter human osteosarcoma cell line, in which the promoter for Arntl (BMAL1) drives luciferase expression (Zhang et al., 2009). Assay of luciferase activity of lysates collected over a timecourse indicated hypoxia suppressed reporter circadian oscillation (Figures 1B, S1A). Reoxygenation reversed suppression (Figure S1A), consistent with a role of HIFs. Indeed, stabilization of HIF with dimethyloxalylglycine (DMOG) (Figures 1C-D) or desferrioxamine (DFX) (Figure S1B), inhibitors of prolyl hydroxylases that mediate HIF degradation, was sufficient to reversibly disrupt oscillation of the Arntl reporter and a Per2 promoter reporter in normoxic cells monitored continuously. Knockdown of HIF1A and EPAS1 (HIF-2α) restored oscillation of Arntl::dLUC in DMOG, confirming that HIFs mediate disruption of circadian oscillation in hypoxia (Figure 1E).
Intriguingly, the ability of DMOG to disrupt the clock depended highly on media buffering capacity. Hypoxia or DMOG increases acid-generating glycolytic flux through HIF-mediated induction of glycolysis enzymes and lactate dehydrogenase A (LDHA). Buffering against acidification fully preserved clock reporter oscillation in DMOG-treated cells (Figures 1F-G). Neutral assay of lysate indicated this was not a pH effect on the luciferase reaction (Figures S1C-D). In hypoxia, buffering likewise protected the clock until later time points when acid exceeded buffering capacity (Figure S1E). Notably, pH commensurate with that found in solid tumors (Gallagher et al., 2008) was sufficient to reversibly disrupt the circadian clock (Figures 1I, S1F). Correspondingly, knockdown of HIFs rescued clock oscillation (Figure 1E) in association with normalization of HIFα-responsive glycolytic mRNAs (Figures S1K-L) and pH (Figure 1H). Further, titration with a chemical inhibitor of LDHA (Boudreau et al., 2016) rescued clock oscillation (Figure 1J) in proportion to normalization of media pH (Figure 1K), with no rescue in media maintained acidic (Figures 1J-K).
Importantly, acid failed to stabilize HIFIα (Figure S1I), activate a reporter of HIF transcription (Figure S1G), or induce HIF-responsive genes (Figure S1H). Although highly buffered media shortened the duration of HIF-stability (Figure S1I), this does not account for clock rescue, as HIF is transcriptionally active in highly buffered media (Figure S1J). Moreover, for the first 32 hours, hypoxia and DMOG induce comparable levels of pyruvate dehydrogenase kinase 1 (PDK1) in both low and highly buffered media (Figure S2A), indicating similarly robust HIF transcriptional activity yet divergent effects on the clock (Figures S2B-C). This contrasts with the high concordance between media pH (Figure S2D) and clock amplitude (Figures S2B-C). Hence, clock disruption by hypoxia is an indirect consequence of HIF transcription mediated by acid.
Disruption of the clock network by acid is extensive
Single-cell luminescence imaging (Welsh et al., 2004) revealed acid severely dampened amplitude without significant alteration of period or phase, indicating low pH caused disruption not through loss of coherence of the cell population but suppression of the molecular oscillator (Figures 2A, S2E). To further characterize clock perturbation in hypoxia, we stabilized HIF with DMOG in media of high or low buffering capacity and assessed core clock and secondary feedback loop (NR1D1, NR1D2) transcript levels every 4 hours for 52 hours. Cells grown in neutral (pH 7.4) or acidic (6.3) media were also probed (Figures 2B-D). Expression of endogenous ARNTL revealed by these timecourses faithfully matched Amtl::dLUC reporter activity (Figures S2B-C). Moreover, these timecourses evinced thorough clock disruption by HIF-induced acidification, with loss of the normal periodicity and phasing of ARNTL and its targets (PER2, CRY1, NR1D1, and NR1D2) (Figure 2B). Highly buffered media rescued these distortions (Figures 2C, S2D), while acidic media was sufficient to disrupt the clock network (Figure 2D) with kinetics that outpaced that of gradual HIF-mediated acidification (Figures 2B, S2D). Like DMOG, hypoxia severely disrupted the oscillation of all assessed core clock components in low buffer (Figure S2F). In agreement with luciferase-reporter data (Figure S1E), buffered media preserved hypoxic clock oscillation for 24 hours, after which oscillation diminished as the media acidified (Figure S2F). Intriguingly, some components of accessory loops of the clock (BHLHE40 (DEC1), RORA) remained induced by HIF in buffered media (Figure S2G), indicating their insufficiency for clock perturbation.
Figure 2 -. Acidification is both necessary and sufficient to disrupt the clock network.
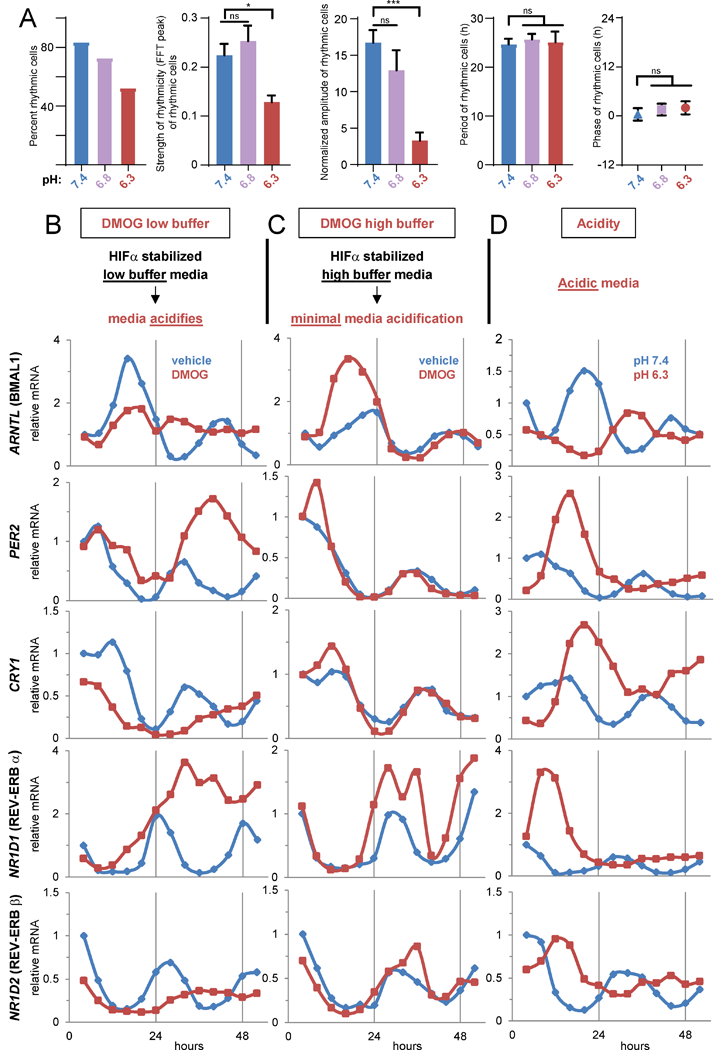
A. Rhythmicity, amplitude, period, and phase as a function of media pH determined by singlecell luminescence imaging of U2OS Arntl::dLUC cells. Mean ± SEM of ≥ 25 analyzed cells (13–25 rhythmic) each pH. One-way ANOVA/post-hoc Dunnett’s *p<0.05, ***p<0.001, ns=p>0.05. B-D. Expression (qPCR) of endogenous core clock components in synchronized U2OS Arntl::dLUC cells treated with 1 mM DMOG or vehicle in low (B) or high (C) buffer media or with pH 7.4 or 6.3 media (D). See also Figure S2.
Clock disruption should impact the circadian transcriptome. Using RNA-sequencing (RNA-seq) over the 52-hour timecourses (Table S1), we interrogated protein-coding transcripts (Table S2) and identified 1206 robustly circadian transcripts in neutral pH (p<0.05, false discovery rate (FDR) <0.2) (Figures 3A-B, Table S3) (Yang and Su, 2010). Significantly circadian transcripts predictably included those encoding the core clock and secondary feedback loops—with virtually identical profiles as with qPCR (Figure S3A)—clock output regulators (DBP, TEF), and clock paralogs (NPAS2) (Figures 3C, S3C). Enriched ontologies within these 1206 genes included the cell cycle and clock (Figure 3D), as well as aspects of metabolism, DNA repair, gene expression, and protein modification.
Figure 3 -. The normally circadian transcriptome ceases oscillation in acid.
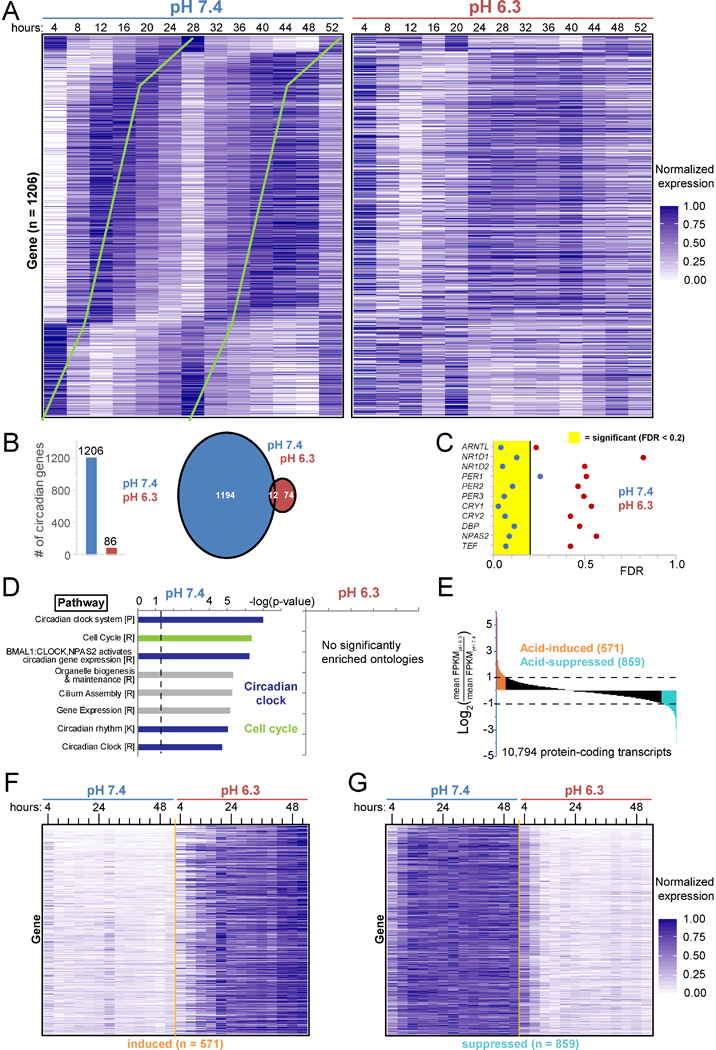
A. Expression (normalized fragments per kilobase of transcript per million (FPKM) mapped reads) of the 1206 proteincoding genes circadian in pH 7.4 (p<0.05, false discovery rate (FDR) <0.2) every 4 h for 52 h in synchronized U2OS Arntl::dLUC cells treated with pH 7.4 and 6.3 media. Ordered by pH 7.4 phase. Green lines highlight circadian periodicity. B. Number of protein-coding genes with significant (defined as in A) circadian oscillation in pH 7.4, 6.3, or both. C. FDR statistic of test for circadian rhythmicity for representative clock network genes and output regulators in pH 7.4 or 6.3. D. Pathway ontologies significantly enriched (B&Y q <0.05) among circadian transcripts in B. P=PantherDB, R=Reactome, K=KEGG. p<0.05 above dashed line. E. Acid-induced and acid-suppressed transcripts defined as Log2 of the ratio of average expression over all 13 time points in pH 6.3 to pH 7.4 >1 or < −1. F/G. Expression in pH 7.4 and 6.3 of the 571 acid-induced (F) and 859 acid-suppressed transcripts (G) defined in E. See also Tables S1–6 and Figure S3.
By contrast, few transcripts in cells exposed to acidic media met statistical significance for circadian oscillation (Figures 3B, S3B, Table S4). Nearly all 1206 robustly circadian genes lost oscillation in acidic media (Figure 3A), including clock components (Figures 3C, S3C). Of the 86 transcripts deemed circadian in acid, many appeared only weakly so (Figure S3B) and all but 12 were not circadian at pH 7.4. Thus, acid profoundly suppresses both the core clock and circadian transcriptome. Further, acid induced (log2>1, n = 571) and suppressed (log2<−1, n = 859) many transcripts (Figures 3E-G, Tables S5–6), particularly those involved in the unfolded protein response (UPR) or cell cycle, respectively (Figure S3D). Together these data reveal a multifaceted cellular response to acid, which suppresses the circadian clock and activates stress responses.
Low pH inhibits translation and thereby the clock
To begin to delineate the mechanism by which hypoxia-generated acid suppresses the clock, we employed an intracellular pH (pHi) reporter consisting of pH-sensitive GFP fused to pH-insensitive mCherry (Koivusalo et al., 2010) and determined that pHi fell in U2OS cells exposed to acidic media or DMOG (Figures 4A, S4A-C), in accord with others (McBrian et al., 2013; Pouyssegur et al., 1985). Consistent with pHi acidification driving clock collapse, two inhibitors of hydrogen ion efflux pathways, amiloride (which inhibits sodium-hydrogen antiporter 1 (NHE1) among other exchangers) and α-cyano-4-hydroxycinnamate (a monocarboxylate transporter 1 inhibitor) lowered pHi (Figure S4E) (Koivusalo et al., 2010; McBrian et al., 2013) and reversibly suppressed circadian oscillation of Arntl::dLUC (Figure S4D).
Figure 4 -. Acid suspends the circadian clock through inhibition of mTORC1.
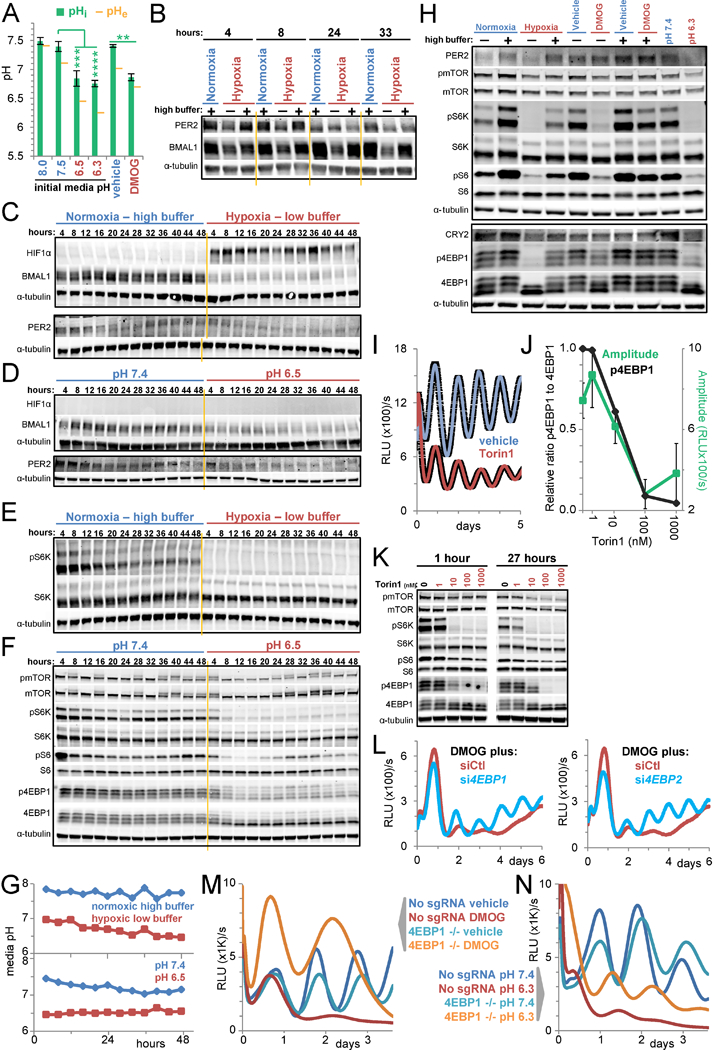
A. mCherry-SEpHluorin-derived intracellular pH (pHi) of U2OS cells treated for 24 h with the indicated pH media or with 500 uM DMOG in low buffer media. Extracellular pH (pHe) at 33 h. Mean pHi ± standard deviation (SD) based on ≥3 10× fields per condition (see Figures S4A-C). T-tests (unpaired, 2-tailed, unequal variances) of pHi ****p≤0.0001, ***p≤0.001, **p≤0.01. RE of 2–3 per condition. B. Timecourse immunoblots of core clock proteins in U2OS cells in normoxic high buffer or hypoxic (1% O2) low or high buffer conditions. C/D. Timecourse immunoblots for HIFIα and clock proteins in U2OS cells in normoxic high buffer or hypoxic (1% O2) low buffer conditions (C) or in pH 7.4 or 6.5 media (D). E/F. Immunoblots of lysate collected in C (E) and D (F) for phosphorylated sites (Ser2448 (mTOR), Thr389 (S6K), Ser235/236(S6), Thr37/46(4EBP1)) or total levels of mTORC1 substrates and downstream signaling components. Tubulin shared by E, C. G. Media pH over the 48 h in C-F. H. Immunoblots for core clock proteins and mTORC1 signaling in U2OS cells in normoxia or hypoxia (1% O2) or treated with vehicle or 300 uM DMOG in low or high buffer conditions or in media of pH 7.4 or 6.3 for 8 h. I. Luminescence of U2OS Arntl::dLUC cells treated with vehicle or 100 nM Torin1. Mean±SEM of 3 BR. RE of 2. J. Normalized ratio of the intensities of p4EBP1 to total 4EBP1 at 27 h (quantified from K) and the mean±SEM Arntl::dLUC amplitude over 4 days (see Methods) as functions of Torin1 dose. Y-axis scaled log([Torin]+1). K. Immunoblot for mTORC1 signaling in U2OS cells after 1 and 27 h of treatment with vehicle or 1–1000 nM Torin1. Unrelated intervening lanes cropped. L. Luminescence of U2OS Arntl::dLUC cells treated with 10 nM control (siCtl) siRNA or siRNA against EIF4EBP1 or EIF4EBP2 prior to 300 uM DMOG in low buffer media. Mean of 2 BR. RE of 2. M/N. Luminescence of U2OS Arntl::dLUC EIF4EBP1 CRISPR knockout (4EBP1 −/−) and editing control clonal lines treated with vehicle or 500 uM DMOG in low buffer conditions (M) or pH 7.4 or 6.3 media (N). Mean of 2–3 BR. RE of ≥3. Black rectangles enclose immunoblots from same gel. Yellow lines for readability only. All cells synchronized except A, K. Hypoxic medias pre-deoxygenated. RE = representative experiment. BR = biological replicates. See also Figure S4.
Because acid profoundly disrupted clock network transcript levels, we assessed protein levels. Hypoxia markedly decreased PER2 and BMAL1 protein amplitudes in a manner rescuable by highly buffered media (Figure 4B). This diverged from RNA-level alterations in hypoxia, where ARNTL transcript was suppressed but PER2 transcript was induced (Figure S2F). To further clarify, we examined BMAL1, PER2, and CLOCK protein levels over 48-hr timecourses and confirmed reductions in hypoxia with low buffering media (Figures 4C, 4G, S4F). Exposure to acidic media was sufficient to recapitulate this rapid, durable suppression (Figures 4D, 4G, S4F). Consistent with protein-level inhibition by HIF-mediated acidification, Arntl::dLUC oscillation was initially preserved in low dose DMOG treatment (Figure S4H) until acid accumulated (Figure S4I) and clock protein levels waned (Figure S4G).
Protein-level clock suppression suggested acid altered protein production or stability. Activation of pH-sensitive eukaryotic elongation factor 2 kinase (Xie et al., 2015) was neither detected in nor required for acid-mediated clock collapse (Figures S4J-K). In contrast, mTORC1, a key regulator of translation in response to the cell’s nutrient status and growth factor signals (Dibble and Manning, 2013; Saxton and Sabatini, 2017), was profoundly inhibited by HIF-mediated acidification as indicated by reduced phosphorylation of ribosomal protein S6 and its kinase (S6K) and eukaryotic translation initiation factor 4E-binding protein 1 (4EBP1) (Figures 4E, S4G). Acidic media was sufficient to inhibit mTORC1 signaling (Figure 4F), while highly buffered media rescued both mTORC1 signaling and clock protein levels in hypoxia and DMOG treatment (Figure 4H). This ability of acid to suppress mTORC1 signaling, previously reported (Balgi et al., 2011; Chambard and Pouyssegur, 1986), was evident in all cell lines studied: 293T, MDA-MB-231, MEFs, HCT116, MCF7 (Figures S4L, S5F, S7J-K).
Consistent with clock suppression through mTORC1 inhibition, mTORC1 inhibitors dampened Arntl:dLUC in proportion to their efficacy. The active-site inhibitors Torin1 and Torin2 or n-butanol, which depletes phosphatidic acid required for mTORC1 activity (Toschi et al., 2009), durably suppressed mTORC1 signaling and Arntl::dLUC amplitude (Figures 4I-K, S4M- Q). Rapamycin, an allosteric mTOR inhibitor, only partially reduced clock amplitude, consistent with its known weakness in suppressing phosphorylation of 4EBP1 (Saxton and Sabatini, 2017) and the rapid partial rebound of S6 phosphorylation (Figure S4R). Further, tactics to restore translation in acid rescued oscillation. Knocking down (Figure 4L) or out (Figures 4M-N, S4S) individual 4EBPs to alleviate sequestration of translation initiation factor eIF4E in acid, yielded, as anticipated given the multiplicity of 4EBP proteins and unresolved S6K inhibition, partial rescue of clock protein levels (Figure S4S) and clock oscillation (Figures 4L-N) in acidic media and DMOG. Interestingly, while 4EBP1 deletion initially rescued high amplitude oscillation in DMOG, these cells quickly began to die, suggesting continued protein synthesis and clock oscillation are incompatible with the acid stress response (Figure 4M).
Acid inhibits mTORC1 signaling independently of both amino acid sensing and TSC2.
mTORC1 activity requires sensing of both growth factors and amino acids (predominantly, leucine and arginine) through pathways converging on Ras homolog enriched in brain (RHEB) and Ras-related (RAG) GTP-binding proteins, respectively, with neither pathway alone sufficient for activation (Saxton and Sabatini, 2017). Acidic media blunted mTORC1 activation by either serum (growth factors) (Figure 5A) or leucine and arginine (Figure 5B), consistent with acid inhibiting either pathway. Leucine binding by sestrins upstream of RAGs relies on a histidine-mediated latch mechanism (Saxton et al., 2016). Given the near-neutral pKa of histidine, we wondered if protonation might disable leucine sensing and render mTORC1 inactive. Knockdown of leucine-sensing mTORC1-inhibiting sestrin-1 and sestrin-2, but not leucineinsensitive sestrin-3 (Wolfson and Sabatini, 2017), weakly rescued both mTORC1 signaling and clock reporter oscillation in DMOG (Figures S5A-B). However, leucine-triggered dissociation of sestrin2 from GATOR2 component WDR24 (Figure S5C) persisted in acidic pH (Figure S5D), and mTORC1 signaling of cells with all three sestrin proteins deleted (Saxton et al., 2016) remained sensitive to acid (Figure S5E). Moreover, expression of constitutively GTP-bound RAGB predictably rendered mTORC1 signaling independent of amino acids (Figure 5C) (Sancak et al., 2010) but did not protect mTORC1 signaling (Figure 5D) or clock oscillation (Figure 5E) from HIF-generated acid, refuting the hypothesis that acid hinders amino acid sensing.
Figure 5 -. Acid inhibits mTORC1 and the clock in an RAG-independent manner not fully rescuable by TSC2 loss.
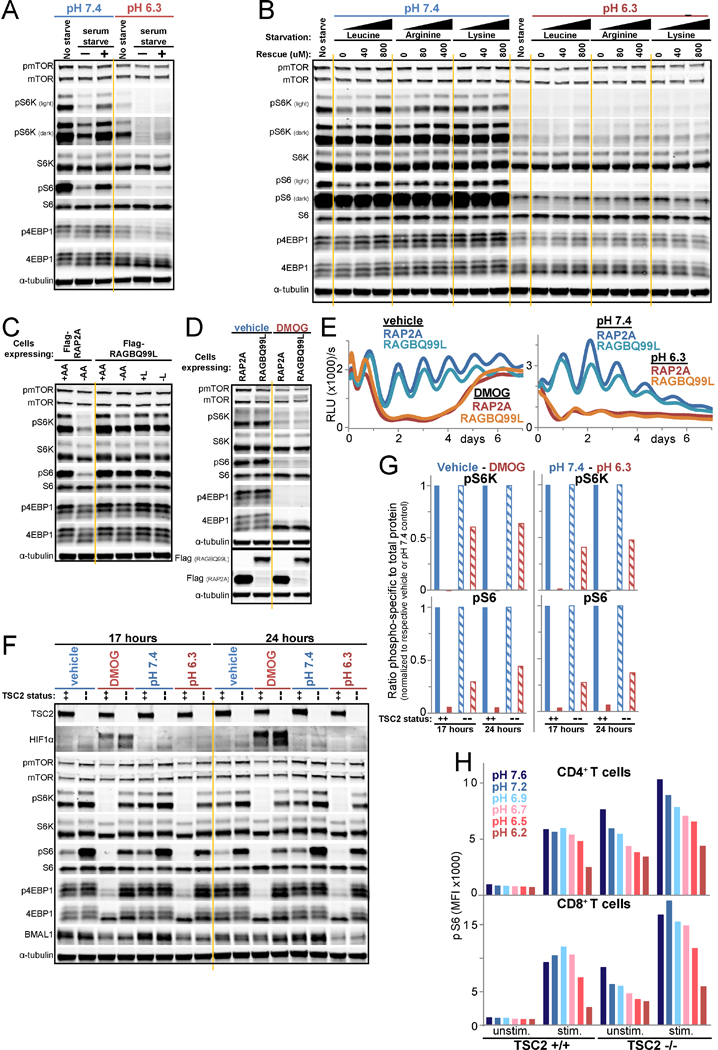
A./B. mTORC1 signaling in U2OS cells unstarved or starved of serum for 50 minutes in pH 7.4 or 6.3 media and then rescued or not for 10 minutes with serum (A), or likewise starved of leucine, arginine, or lysine and rescued with approximately twice the amino acid sensor Km (Wolfson and Sabatini, 2017) or full DMEM level (B). C. mTORC1 signaling in RAP2A- or RAGBQ99L-expressing U2OS Arntl::dLUC cells after 1 h of deprivation of amino acids (AA) or leucine (L) or incubation in replete media. D. Immunoblots of lysate from cell lines in panel C, 23 h after synchronization and treatment with vehicle or 500 uM DMOG in low buffer media. E. Arntl::dLUC luminescence in parallel to D. Mean of 3 BR. F. Immunoblots for HIFIα, mTORCI signaling, and BMAL1 in Arntl::dLUC TSC2 CRISPR knockout (--) or parental Arntl::dLUC U2OS cells (++) following treatment with vehicle or 500 uM DMOG in low buffer media or with pH 7.4 or 6.3 media for 17 and 24 h. RE of 2. G. Quantification of F. Ratio of the intensity of pS6K or pS6 to total S6K or S6, respectively. Each control-treatment pair normalized to respective control (vehicle, pH 7.4). H. Mean fluorescence intensity (MFI) of pS6 staining of wildtype (+/+) and TSC2 knockout (−/−) CD4+ and CD8+ T cells assessed by flow cytometry after TCR stimulation for 1 h in media of the indicated pH. RE of 5 each with 1–4 BR. RE=representative experiment, BR=biological replicates. See also Figure S5.
We therefore suspected acid instead suppressed signaling to RHEB through activation of tuberous sclerosis 2 (TSC2), the GTPase-activating protein (GAP) for RHEB. Consistent with this hypothesis, loss of TSC2 function rescued mTORC1 signaling in acidified TSC2 null MEFs (Figure S5F) or U2OS cells with knockdown (Figure S5G) or CRISPR-mediated deletion of TSC2 (Figure 5F). However, this rescue of mTORC1 activation was incomplete (Figure 5G) and did not fully maintain clock amplitude in acidic media (Figure S5H). Querying upstream regulators of TSC2 (Dibble and Manning, 2013) yielded no evidence for TSC2 activation by AMPK or GSK3B activation or ERK inhibition (Figures S5I-L). Similarly, although REDD1/DDIT4 (regulated in development and DNA damage responses), a HIF target, can stimulate TSC2 (Dibble and Manning, 2013), REDD1 induction by acid was modest (Figures S5M-O) and much weaker than that in response to HIF stabilization in highly buffered media (Figure S5O), a condition in which mTORC1 signaling was preserved.
Notably, T cells encounter low pH in the tumor microenvironment and require mTORC1 signaling for differentiation and activation of effector cells (Pollizzi et al., 2015). Remarkably, acidic media blunted mTORC1 activation in both CD4+ and CD8+ primary T cells in response to stimulation in vitro (Figure 5H). Intriguingly, T cells, like cancer cells, demonstrated a TSC2-independence in the ability of acid to suppress mTORC1.
Centrifugal redistribution of lysosomes inhibits mTORC1 signaling
Because TSC2 deletion did not fully rescue mTORC1 signaling and clock oscillation in low pH, we hypothesized that acid might prevent mTOR localization to the lysosomal surface where it is activated by RHEB. In U2OS cells, as in other cell types (Jongsma et al., 2016), lysosomes predominantly reside in a perinuclear aggregate seen by staining of lysosomal associated membrane protein 2 (LAMP2) in fixed cells (Figures 6A, S6A) or by addition of the fluorescent probe LysoTracker to live cells (Figure 6B). mTOR is recruited to perinuclear lysosomes in an amino acid-dependent manner (Figures 6C, S6B), as reported (Sancak et al., 2010). Acidic conditions profoundly disrupted this perinuclear clustering and rapidly and reversibly dispersed lysosomes (LAMP2) throughout the cell (Figures 6D-E), which imaging of live cells expressing tagged versions of LAMP1 confirmed (Figures 6F, S6C). Despite this phenomenon being noted in the literature (Heuser, 1989), its biological significance remains obscure.
Figure 6 -. Acid-induced peripheral redistribution of lysosomes silences signaling of lysosome-localized mTORC1.
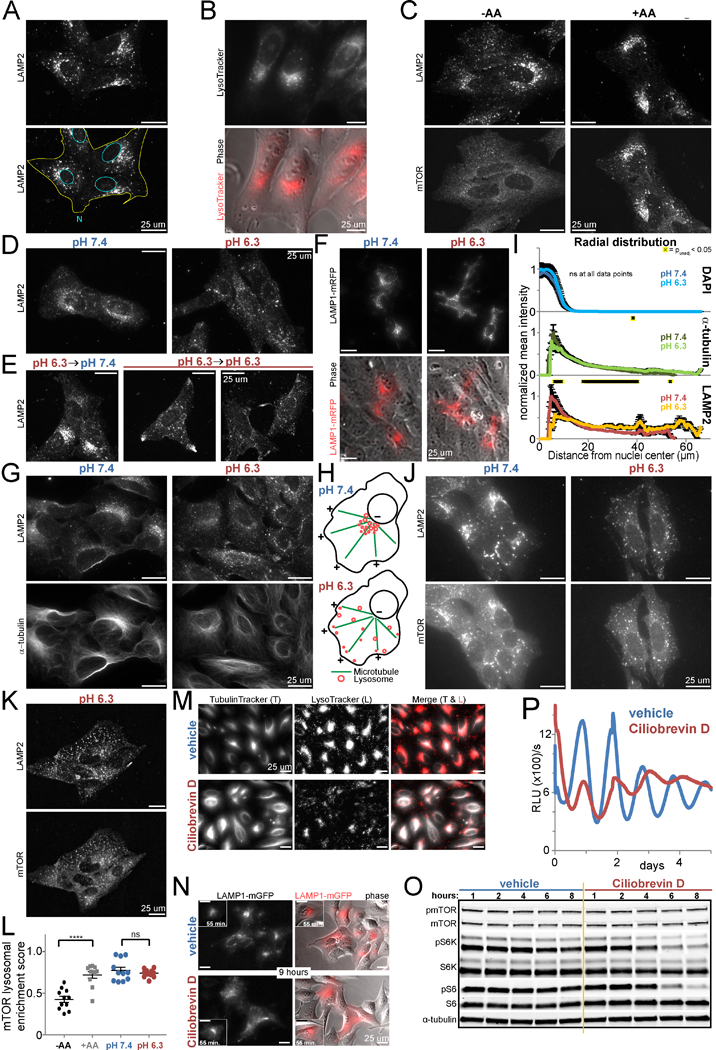
A. U2OS cells immunostained for lysosomal protein LAMP2. Nuclei and cytoplasm outlined in lower panel. B. Live imaging of U2OS cells with lysosomes labeled with LysoTracker. Lower panel merged with phase-contrast image. C. U2OS cells immunostained for LAMP2 and mTOR after amino acid starvation for 115 min and rescue (+AA) or not (-AA) for 25 min. D./E. U2OS cells immunostained for LAMP2 after in media of pH 7.4 or 6.3 for 2.25 h (D) or pH 6.3 for 105 min followed by media pH 7.4 (rescue, left) or 6.3 (mock rescue, right two fields) for 25 min (E). F. Live imaging of U2OS cells expressing LAMP1-mRFP in pH 7.4 or 6.3 media for 4 h. Lower panels: merged mRFP and phase-contrast images. G. U2OS cells immunostained for LAMP2 and α-tubulin after in pH 7.4 or 6.3 media for 2.25 h. H. Model: the perinuclear aggregate of lysosomes disperses peripherally upon acidification. I. Mean intensity of DAPI (nuclear), a-tubulin, and LAMP2 staining as a function of distance from the nucleus center (i.e. radial coordinate) after 2.75 h in pH 7.4 or 6.3 media. (See Figure S6E.) n=15 cells each pH. Mean±SEM normalized to each channel’s maximum. T-test of pH (unpaired, 2-tailed, equal variance) unadjusted p<0.05 (*) at 0, 2, and 117 of 228 data points, respectively. J./K. U2OS cells immunostained for LAMP2 and mTOR after amino acid starvation for 130 min in pH 7.4 or 6.3 media and restimulation with amino acids for 10 min in the same pH (J) or after incubation in pH 6.3 media for 2 h with media change (same pH) 15 min prior to processing (K). L. Quantification of mTOR lysosomal enrichment in U2OS cells immunostained for LAMP2 and mTOR after amino acid starvation for 155 min and rescue (+AA) or not (-AA) for 8 min or in pH 7.4 or 6.3 media for 165 min. n =11 fields (≥86 cells) per condition. Mean±SEM superimposed with raw data. T-tests (unpaired, 2-tailed) ****p<0.0001, ns = p>0.05. RE of 3. M. Live imaging of U2OS cells treated with vehicle or 40 uM ciliobrevin D (CbD) for 10.5 h. Lysosomes and polymerized tubulin labeled with LysoTracker and TubulinTracker. N. Live imaging of U2OS cells expressing LAMP1-GFP (red pseudocolor) after treatment with vehicle or 60 uM CbD for 55 min (inset) and 9 h (different fields). Right: merged GFP and phase-contrast images. O. mTORC1 signaling in U2OS cells over 8 h of vehicle (veh.) or 40 uM CbD treatment. RE of 3. P. Luminescence of U2OS Arntl::dLUC cells synchronized and treated with 50 uM CbD or vehicle. Mean of 2 BR. RE of 2, 2–3 BR each. Representative fields of ≥3 BR for all microscopy. RE = representative experiment. BR = biological replicates. See also Figure S6.
Lysosomes traffic on microtubules through motor proteins. Correspondingly, the perinuclear lysosome aggregate intimately associated with a microtubule organizing center (MTOC) rather than the actin cytoskeleton (Figures 6G, S6D-E). In acid, the actin and microtubule cytoskeletons remained intact while lysosomes peripherally dispersed throughout the cell (Figures 6G, S6D-E), suggesting lysosomes move toward the plus ends of microtubules in acid (Figure 6H), an interpretation supported by quantitative image analysis (Figure 6I). Intriguingly, mTOR and LAMP2 continued to colocalize whether in sustained or more rapid reversals of pH and lysosome spatial distribution (Figures 6J-K, S6F-H). Indeed, quantification readily revealed the expected amino acid-dependence of mTOR lysosomal enrichment but revealed no such pH- dependence (Figure 6L).
mTORCI’s persistent colocalization with dispersed lysosomes in acid suggested peripheral lysosome redistribution might be sufficient to disable mTORCI signaling. To test this hypothesis, we inhibited dynein, which moves cargo toward the nucleus, with Ciliobrevin D (CbD) (Li et al., 2016) and confirmed resulting centrifugal redistribution of LysoTracker and GFP-tagged LAMP1 (Figure 6M-N, S6I), with dimming of LysoTracker acidophilic dye consistent with reported decreased acidity of peripherally located lysosomes (Johnson et al., 2016). As predicted, CbD caused a gradual decrease in mTORCI signaling (Figure 6O) and dampening of clock amplitude (Figure 6P) in association with gradual peripheral redistribution of lysosomes (Figures 6N, S6I). Depolymerization of microtubules with nocodazole likewise disrupted the polarized perinuclear aggregate of lysosomes (Figures S6J, qS6L) and inhibited mTORCI signaling (Figure S6K). Aptly, reaggregation of lysosomes at later time points was accompanied by reactivation of mTORC1 (Figures S6M-N).
The influence of lysosome spatial location on mTORCI signaling is reminiscent of the dynein-dependent mechanism we previously identified by which human cytomegalovirus (HCMV) maintains perinuclear localization of mTOR and circumvents mTORCI-inhibiting stress signals (Clippinger and Alwine, 2012; Clippinger et al., 2011). As such, we infected cells with HCMV and observed strong rescue of mTORC1 signaling in both acidic media and DMOG (Figure 7A). As kinesins oppose dynein and traffic cargo toward the plus ends of microtubules, we reasoned inhibition of kinesins might also thwart acid-induced peripheral redistribution of lysosomes and rescue signaling. However, expression of over 35 kinesins in U2OS cells makes this challenging (Figures S7A-B). Nonetheless, we knocked down the most abundantly expressed kinesin, kinesin family member 5B (KIF5B), a component of kinesin-1 shown to affect lysosome trafficking in other cell types (Li et al., 2016). As anticipated given kinesin redundancies, partial knockdown of kinesin-1 resulted in partial resistance of mTORC1 signaling to suppression by acid (Figure 7B), consistent with acid inhibiting mTORC1 through centrifugal dispersion of lysosomes.
Figure 7 -. Acid inhibits mTORC1 signaling and the clock by spatially separating RHEB and lysosome-bound mTORC1.
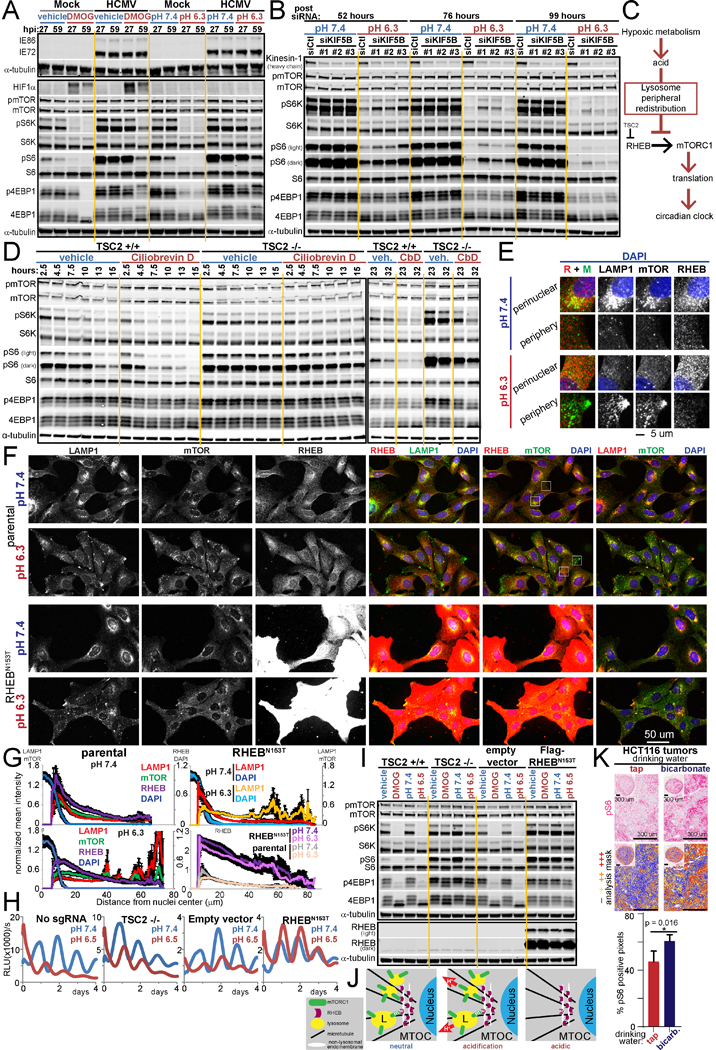
A. Immunoblots for mTORC1 signaling, HIFIα, and the human cytomegalovirus (HCMV) proteins IE72 and IE86 in HCMV-infected or uninfected (mock) U2OS cells treated with vehicle or 500 uM DMOG in low buffer media each for 8 and 12 h prior to harvest at 27 and 59 hours post infection (hpi), respectively, or in media pH 7.4 and 6.3 for 1 h prior to harvest. B. mTORC1 signaling and kinesin-1 heavy chain (HC) in U2OS cells at time points post delivery of 10 nM control (Ctl) siRNA or three different siRNA against KIF5B (kinesin-1 HC) and in pH 7.4 and 6.5 media 1 h prior to harvest. RE of 2. C. Model. Acid produced during hypoxic metabolic rewiring suppresses the circadian clock through inhibition of mTORCI-governed translation as a consequence of centrifugal redistribution of lysosome-bound mTORCI limiting mTOR activation by RHEB. D. mTORCI signaling over 32 h in TSC2 CRISPR knockout (−/−) or parental U2OS cells (+/+) treated with vehicle or 50 uM ciliobrevin D. E/F. Parental and RHEBN153T-expressing U2OS cells immunostained for LAMP1, mTOR, RHEB and nuclei (DAPI) after 160 min in pH 7.4 or 6.3 media. White boxes in F enlarged in E. RE of 3. G. Mean intensity of DAPI, mTOR, RHEB, and LAMP1 as a function of distance from the nucleus in F. n=10–13 cells each pH per cell line. Mean±SEM normalized to each channel’s parental pH 7.4 maximum. H. Arntl::dLUC luminescence in TSC2 CRISPR knockout (−/−), RHEBN153T-expressing, and respective control U2OS cells synchronized and in pH 7.4 or 6.5 media. Mean of 3 BR. RE of 3–4, 1–3 BR each. I. mTORC1 signaling in parallel to H or treated with vehicle or 500 uM DMOG in low buffer conditions for 20 h (TSC2) or 16 h (RHEBN163T). RE of 2. J. Model of trans-endomembrane contact between lysosome-localized mTORC1 and non-lysosomal RHEB disrupted upon acid-driven peripheral redistribution of lysosome-bound mTOR. MTOC = microtubule organizing center K. Immunohistochemical pS6 staining of HCT116 xenograft tumors hosted by mice drinking tap water or 200 mM sodium bicarbonate ad libitum throughout tumor hosting (up to 3 weeks). Representative high-power fields and inset low-power images of entire tumor cross section. Positivity mask in lower panels. Percent pS6 positive pixels quantified over entire viable area of tumor cross section. Mean±SD n=4 mice each arm. 2-tailed Student’s t-test. RE= representative experiment. Biological replicates = BR. See also Figure S7.
Restoration of spatial coincidence of RHEB and lysosome-bound mTORC1 rescues mTORC1 signaling and the clock from acid suppression
Interestingly, we also noted that the acid-mediated, TSC2-independent suppression of mTORC1-signaling in primary CD8+ T cells (Figure 5H) was not associated with loss of mTOR from the lysosomal surface (Figures S7C-D). Thus, data from both U2OS cells and primary T cells indicated that TSC2 deletion was insufficient to fully rescue mTORC1 signaling despite intact amino acid sensing and persistent localization of mTOR to lysosomes in acid. We therefore wondered if peripheral redistribution of lysosomes in acid limits the ability of RHEB to activate lysosome-bound mTOR (Figure 7C), explaining why TSC2 deletion could enhance but not fully rescue mTORC1 activity. Consistent with this model, dynein inhibition reduced mTORC1 signaling in TSC2 knockout cells despite the expected higher basal level of mTORC1 signaling in these cells (Figure 7D). Specifically, we wondered whether contact between RHEB and mTOR might be affected by spatial redistributions driven by acid. After validating an anti- RHEB antibody (Figures S7E-G), we coimmunostained for mTOR, LAMP1, RHEB, and nuclei and observed, consistent with others (Menon et al., 2014), RHEB enrichment in a perinuclear location similar to that of lysosomes (Figures 7E-F) irrespective of amino acid status (Figure S7H). Amino acid stimulation recruits mTOR to lysosomes (Figure S7H) allowing RHEB and mTOR to interact. Remarkably, in acid, RHEB remained perinuclear while lysosomes with bound mTOR redistributed to the periphery (Figures 7E-F). Indeed, quantification of the radial distribution of nuclear, RHEB, LAMP1, and mTOR staining indicated strong perinuclear localization of all three proteins in neutral conditions but clear reduction in spatial coincidence of RHEB and LAMP1-mTOR in low pH as a result of RHEB’s resistance to the centrifugal forces acting on LAMP1 and mTOR (Figure 7G).
These data suggest a model in which peripheral redistribution of lysosomes in acid inhibits the circadian clock by limiting RHEB’s ability to spatially contact lysosome-bound mTOR to activate it. We reasoned, then, that increasing RHEB abundance in the periphery should rescue the circadian clock by restoring activity of peripherally redistributed mTOR. Overexpression of constitutively active RHEBN153T (Urano et al., 2005) dispersed RHEBN153T throughout the cell without altering LAMP1 or mTOR localization (Figures 7F-G). As hypothesized, this restoration of RHEB-mTOR coincidence resulted in a full rescue of clock oscillation in acidic media (Figure 7H) and a corresponding more thorough resistance of mTORC1 signaling to acid compared to TSC2 knockout (Figure 7I). That acidification readily separates RHEB and mTOR but not LAMPs and mTOR suggests that in these cells the majority of RHEB may normally be localized on non-lysosomal endomembranes at the MTOC, a distribution supported by high resolution images showing tight spatial congruity in LAMP and mTOR distribution and close apposition but discordance between either of these two and RHEB (Figure S7I). This is a surprising notion given current favored models of mTORC1 signaling (Sancak et al., 2010), but not unprecedented (Hanker et al., 2010; Manifava et al., 2016), that would indicate trans-endomembrane RHEB-mTOR interaction mechanistically underlies mTOR activation (Figure 7J).
Having delineated how acid produced in hypoxia suppresses mTORC1 signaling, we wished to assess whether this inhibition could be observed in vivo as a result of the hypoxic and acidic nature of tumors (Gallagher et al., 2008; Gillies et al., 2002). To do so, we used tumor specimens available from previous studies (Estrella et al., 2013; Ibrahim-Hashim et al., 2017) in which tumor xenografted mice drank either tap water or water supplemented with sodium bicarbonate, a method shown in these studies and by others (Gallagher et al., 2008) to raise intratumoral pH and, notably, intracellular pH (Raghunand et al., 1999). We assessed phosphorylated S6 by immunohistochemistry as a measure of mTORCI signaling. In two tumor models (colon cancer HCT116, breast cancer MCF7), sodium bicarbonate administration significantly elevated mTORCI signaling (Figures 7K, S7L), consistent with in vitro corollary work with these cell lines showing acid sufficient to inhibit mTORCI signaling and additional bicarbonate (highly buffered media) able to blunt HIF-mediated mTORCI suppression (Figures S7J-K). Importantly, mTORCI activation did not stem from bicarbonate stimulating proliferation, as bicarbonate either slowed (HCT 116) or did not affect (MCF7) tumor growth rates (Estrella et al., 2013; Ibrahim-Hashim et al., 2017). A third model (breast cancer MDA-MB-231) revealed high baseline tumor mTORC1 activity not further augmented by bicarbonate therapy (Figure S7M). This suggests tumor acidity suppresses mTORC1 signaling in significant regions of tumors in vivo but some tumors have unknown mechanisms of escape.
Interestingly, unlike the full rescue of circadian oscillation observed with RHEBN153T overexpression in acidic media (Figure 7H), overexpression of RHEBN153T failed to rescue circadian oscillation from DMOG treatment despite high mTORC1-signaling (Figure 7I), and cells began to die after about 2.5 days (Figure S7N). Consistent with the UPR RNA signature seen in acid (Figure S3D), modest phosphorylation of the translation initiation factor eIF2α was seen in acidic media and in late time points during DMOG exposure (Figure S7O). We speculated that RHEB-enforced mTORC1-signaling might compound UPR signaling in acidified hypoxic cells and evoke translational inhibition orthogonal to mTORC1, thwarting our efforts to rescue the clock (Figure S7P). Indeed, in support of this notion, only cells overexpressing RHEBN153T during DMOG exposure displayed hyperphosphorylation of endoplasmic reticulum (ER) transmembrane protein PRKR-like ER kinase (PERK) and induction of downstream activating transcription factor 4 (ATF4) and its target C/EBP homology protein (CHOP) (Figure S7Q). Thus, forced high mTORC1-induced translation in acidified hypoxic cells exacerbates ER stress, inhibiting cap-dependent translation through eIF2α phosphorylation, which in turn drives translation of ATF4 (Figure S7Q). Consequently, continued suppression of the clock in RHEB-overexpressing HIF-stabilized acidic cells highlights the same fundamental principle learned from acid-mediated mTOR suppression: inhibition of translation during hypoxic stress suspends the molecular circadian clock.
Discussion
Early human and rodent studies in low oxygen revealed reversible dampening of amplitude of normally circadian parameters such as body temperature (Mortola, 2007). While our studies were in progress, three reports concluded that HIFIα might disrupt the clock through binding to promoters of specific clock network genes (Adamovich et al., 2017; Peek et al., 2017; Wu et al., 2017). Both Wu and Peek presented evidence of HIF binding to the PER2 promoter and Adamovich proposed HIFIα bound to RORα and CRY2 promoters, but functional testing via rescue experiments (i.e. knockdown of proposed HIF-driven genes) either failed (Adamovich) or was not performed (Wu and Peek).
In contrast to these studies, we show that acid—not HIF transactivation of clock genes—mediates suspension of the circadian molecular clock and diurnal transcriptome in hypoxia or upon pharmacologic stabilization of HIF. Acid, a consequence of HIF-directed hypoxic metabolism, is sufficient to drive lysosomes, the platform upon which mTORC1 is normally activated, to the cell periphery. We find this redistribution suppresses the clock by spatially separating mTORC1 from its upstream regulator RHEB and thereby potently inhibiting mTORC1 signaling and the translation of clock network proteins governed by it. Knocking down HIF1A or inhibiting its target LDHA, buffering against acidification, or restoring mTORC1 activity each rescues clock oscillation, illustrating that acid produced during HIF1α-mediated metabolic rewiring halts the clock by inhibiting mTORC1, a complex well known to coordinate cellular activities to match current metabolic resources and afflicting stresses.
To our knowledge, few others have explored the effect of low pH on the clock. Recognizing the incompleteness of their model, Adamovich proposed that the ability of the HIFIα axis to reset clocks in mammalian tissues and cell lines could be mediated by “other factors yet to be identified” (Adamovich et al., 2017). Whether oscillating transient acidification fulfills this role awaits formal demonstration; but, clock-driven circadian oscillations in pH in mammalian tissues (Dmitriev and Mangel, 2001; Peek et al., 2017) allow for the intriguing possibility of conserved reinforcing bidirectional acid-clockcrosstalk.
Our finding that mTOR governs peripheral clocks echoes prior findings in the central clocks of flies and mice (Cao et al., 2010; Zheng and Sehgal, 2010). Additionally, rhythmic mTOR signaling has been shown to support circadian rhythmicity in mammalian translation rates (Jouffe et al., 2013; Lipton et al., 2015), emphasizing the multiple levels at which mTOR acts to promote optimal timing. Moreover, as feeding cycles are now understood to be the dominant entraining force (zeitgeber) for peripheral clocks (Dibner and Schibler, 2015), it is especially alluring to consider that mTOR, given its role in sensing nutrient, growth factor, and energy levels and coordinating cellular response, is poised to perhaps be a central player in this currently poorly understood synchronization pathway.
Our conclusion that mTORC1 is rapidly and durably inhibited by acid is corroborated by other work. Remarkably, prior to the discovery of mTOR, it was observed that intracellular acidification (due to acidic media exposure or genetic or pharmacologic inhibition of H+ export) could potently suppress phosphorylation of ribosomal protein S6 and translation (Chambard and Pouyssegur, 1986). More recently, a group has rediscovered acid’s effect and reported it to act via TSC2 or independently even in the same cells depending on context (Balgi et al., 2011; Fonseca et al., 2012). We resolve this paradox by identifying that acid-driven peripheral relocalization of mTOR limits its activation by RHEB; correspondingly, TSC2 knockout partially rescues mTORC1 signaling by eliminating GAP activity toward RHEB but does not circumvent this downstream block.
We observed striking peripheral scattering of lysosomes in acidic conditions, a phenomenon first described decades ago (Heuser, 1989) and documented since in different systems. To our knowledge, no one has previously queried if an acidic environment might impact mTORC1 signaling through lysosome redistribution. Our work thus provides mechanistic insights into a long unexplained low pH phenomenon and intriguingly adds to the theme of governance of mTOR activity through spatial positioning of key players. Our finding that centrifugal lysosome redistribution is both necessary and sufficient for acid’s suppression of mTOR is consistent with prior work by us and others indicating dynein (Clippinger and Alwine, 2012) and perinuclear clustering of lysosomes (Clippinger et al., 2011; Rainero et al., 2015) support mTORC1 signaling. However, it is notable that there are contradicting reports on the relation between lysosome localization and mTOR activity in Hela cells (Korolchuk et al., 2011). Discrepant findings may involve autophagy under starvation that localizes lysosomes centrally (Li et al., 2016). Importantly, that HCMV has evolved a mechanism to actively bring mTOR to the MTOC and that doing so allows the virus to maintain mTORC1 activity in the face of inhibitory signals underscore the importance of this spatial location to mTORC1 activation (Clippinger and Alwine, 2012; Clippinger et al., 2011).
In summary, our studies reveal that hypoxia reversibly suspends the homeostatic circadian timekeeper of cancer cells as a consequence of a byproduct of the metabolism it dictates driving a subcellular inhibitory spatial alteration of mTORC1.
STAR Methods
Contact for Reagent and Resource Sharing
Requests for further information or resources and reagents should be directed to and will be fulfilled by the Lead Contact, Chi V. Dang, at cdang@wistar.org or cdang@licr.org.
Experimental Model and Subject Details
Cell Lines
U2OS cells and clonal U2OS cells stably expressing Arntl::dLUC or Per2::dLUC (Zhang et al., 2009) were kindly provided by Drs. Roger Greenberg and John Hogenesch, respectively, and authenticated and confirmed free of mycoplasma by us. TSC2 knockout and wild-type p53 −/− MEFs (originally from the laboratory of Dr. David Kwiatkowski) and 293T cells were provided by Dr. Celeste Simon. Sestrin triple knockout 293T cells were provided by Dr. David Sabatini. MDA-MB-231 cells used in in vitro studies were provided by Dr. Donald Ayer and confirmed free of mycoplasma by us. MCF7 and HCT 116 cells used in vitro studies were originally purchased from ATCC. U2OS, MDA-MB-231, and MCF7 cells are female. HCT116 is male.
All U2OS, 293T, and MEF cell lines were maintained in standard DMEM (4 mM L-glutamine, 25 mM glucose; Corning MT10–013-CV) supplemented with 10% fetal bovine serum (HyClone) and 1× penicillin/streptomycin (Corning) in standard humidified 5% CO2, 37 °C tissue culture incubators. MDA-MB-231 cells used for in vitro study were further supplemented with 1× MEM non-essential amino acids (Gibco). HCT116 cells were maintained in DMEM/F12 media (Gibco) supplemented with 1x penicillin/streptomycin and 10% newborn calf serum (HyClone).
Generation of additional U2OS cell lines and experimental culture conditions described below. HCT116, MCF7, and MDA-MB-231 cells used in in vivo work were purchased from ATCC, authenticated by short tandem repeat analysis, and confirmed to be free of mycoplasma. Further details pertaining to these cell lines are detailed below in the description of this in vivo work.
Animal Models
Primary T-cell cultures were sourced from C57BL/6 mice with loxP-flanked Tsc2 alleles and Cd4-Cre (Tsc2fl/fl Cd4-Cre, resulting in TSC2 selectively deleted in T cells, “TSC2 −/−”) or without Cre (Tsc2fl/fl, “TSC2 +/+”) or with OVA-specific CD8+ T cells (OT-I) (Pollizzi et al., 2015). All relevant animal procedures were in accordance with the guidelines of the Institutional Animal Care and Use Committee (IACUC) at Johns Hopkins University. Male and female littermates were used for each experiment with sex matching accordingly. Mice were provided with food ad libitum in standard 12-hour light/dark housing.
Xenograft studies were performed in accordance with the guidelines of the IACUC of the H. Lee Moffitt Cancer Center using eight- to ten-week-old randomized mixed male and female severe combined immunodeficient (SCID) mice (Fox Chase SCID Beige mice, Charles River) or female nu/nu mice (Envigo) as hosts as detailed below in the description of this in vivo work. Mice were provided with food ad libitum in standard 12-hour light/dark housing.
Primary cells
Cells from spleens and lymph nodes (“splenocytes”) were combined for all experiments. In summary, single-cell suspensions were created by mashing organs through a 70 uM filter. Red blood cells were removed through ACK lysing (Quality Biological). Splenocytes from mice with TSC2 −/− and TSC2 +/+ T cells were resuspended directly into experimental conditions as described below. Splenocytes from OT-I mice were resuspended in RPMI-1640 media (Corning 10–040) with 10% FBS (Gemini Bioproducts), 2 mM L-glutamine (Corning), 10 mM HEPES (Corning), 50 ug/mL gentamycin (Quality Biological), 1× non-essential amino acids (Gibco), and 50 uM beta-mercaptoethanol (Sigma) and stimulated with 100 ng/mL OVA peptide (Anaspec) for 48 hrs then expanded in 10 ng/mL IL-2 (Preprotech) for 4 days to generate previously activated T cells. Primary OTI cultures were maintained in standard humidified 5% CO2, 37 °C tissue culture incubators media. Experimental culture conditions described below.
Method Details
Media formulations and culture conditions (cell lines)
DMEM media with four different buffering/pH characteristics were used for in vitro experiments employing cell lines. These medias were referred to as “low buffer,” “high buffer,” “pH 7.4” (i.e. neutral media), and “pH 6.3” (or pH 6.4, 6.5, 6.6, etc. as indicated in figures and legends, i.e. acidic media). These media formulations are described below. Exceptions to use of these medias are also noted below.
Low buffer media
The real-time luminometers (LumiCycle instruments, described below) that continuously measure bioluminescence from cultured cells require a non-humidified and “atmospheric” CO2 (i.e. non-elevated CO2) environment for proper hardware function. Therefore, the standard widely used media in these luminometers is DMEM with buffering capacity appropriately adapted for atmospheric (0.04% CO2) culture (Yamazaki and Takahashi, 2005). In detail, this is a phenol-red-free DMEM with 25 mM glucose, 4 mM L-glutamine (Lonza), 4.2 mM (350 mg/L) sodium bicarbonate (Gibco), 10 mM HEPES (Sigma), 5% FBS, and 0.25× penicillin-streptomycin (prepared by supplementation of USBiological D9812–05). This standard media is referred to as “low buffer” media. Media pH was adjusted to pH 7.4 prior to filter sterilization. Except where noted, this media was used in atmospheric CO2 conditions.
High buffer media
“High buffer” media is the above “low buffer” media with the HEPES eliminated and the sodium bicarbonate increased to 44 mM (3.7 g/L). (Note, this is the bicarbonate concentration in standard DMEM used in routine 5% CO2 culture.) This media was used at atmospheric CO2 conditions or, if noted, in 5% CO2. When used at atmospheric CO2 conditions, the bicarbonate concentration is in excess of that indicated by the Henderson-Hasselbalch equation to be required to achieve a physiologic pH (i.e. pH 7.4). This excess is deliberate and, in contrast to the above “low buffer” media, enables absorption of the anticipated acid load generated by glycolytic (hypoxic) cells. High buffer and low buffer medias were prepared from the same concentrated common base to ensure identical composition in all other regards. Media pH was adjusted to pH 7.4 prior to filter sterilization.
pH 7.4 and pH 6.3–6.6 medias
A media of acidity comparable to that observed in solid tumors (pH 6.2–6.6) (Gallagher et al., 2008; Gillies et al., 2002) was desired. To enhance the pH-stability of such a media, the bicarbonate-HEPES buffering system of low buffer media (above) was replaced with 25 mM PIPES (pKa of 6.66 at 37 °C, effective buffering range pH 6.1–7.5 at 25 °C; Sigma). So as to allow this acidic media and its control physiologic pH media (pH 7.4) to share the same chemical composition, 25 mM HEPES (pKa 7.31 at 37 °C, effective buffering range pH 6.8–8.2 at 25 °C; Sigma H4034) was also added. Prior to filter sterilization, a concentrated PIPES- HEPES DMEM media base was split, adjusted to pH 7.4 or pH 6.3–6.6 (as noted in figures), and brought to volume, ensuring identical media composition of neutral and acidic media in all other regards. These medias were exclusively used in atmospheric CO2. While medias of pH 7.4, 6.5, and 6.3 were predominantly used, occasional figures and legends note the use of medias prepared to other pH values, including pH 6.6, pH 6.8, pH 7.0, pH 7.5, and pH 8 (e.g. Figures 1I, S1F, 4A, S4A-C, S5E, S7J, and S7K).
Additional experimental culture details
L-glutamine (Lonza) was typically left out of all DMEM media preparations and added fresh immediately before use. Above medias were further supplemented with 1× non-essential amino acids when used for MDA-MB-231 in vitro experiments. After seeding, cells remained in standard humidified tissue culture incubators (5% CO2, 37 °C) in normal DMEM for typically two days until experiment initiation and treatment with one of the above medias. To protect against desiccation during the course of experiments, all cells were cultured in humidified tissue culture incubators or sealed with autoclaved vacuum grease (Dow-Corning).
Media formulations and culture conditions (T cells)
For experimental manipulation of pH of splenocytes or purified T cell cultures, cultures were resuspended in RPMI-1640 (Sigma R1383 with 11.1 mM glucose restored) supplemented with 10% FBS (Gemini Bioproducts), 2 mM L-glutamine (Corning), 50 ug/mL gentamycin (Quality Biological), and 50 uM beta-mercaptoethanol (Sigma) in which the bicarbonate-CO2 buffering was replaced with 25 mM PIPES and 25 mM HEPES. These cultures were maintained at 37 °C in atmospheric CO2 in a humidified incubator. When prepared, a slightly concentrated media was split into multiple volumes before adjusting pH to target values, bringing to volume, and sterilizing by filtering, ensuring identical media composition in all regards other than pH. pH of stored media was frequently monitored to guard against drift and ensure correct record of experimental conditions.
Hypoxic culture
Hypoxic conditions (1% O2) were achieved by culturing cells in a humidified incubation box within a Coy Labs oxygen control glove box (“hypoxia chamber”) capable of regulating both oxygen and CO2 levels by mixing N2 and CO2 with ambient air. Normoxia refers to ambient 21% oxygen levels. Both normoxic and hypoxic arms of Figure 1A utilized low buffer media in atmospheric CO2. Figure S1A used 5% CO2 in all conditions, with high buffer media in normoxia and low buffer media in hypoxia. All other hypoxic cultures and respective normoxic controls were in 5% CO2 with media buffering as noted in figures.
Cell synchronization
Cells were synchronized in circadian time where indicated in figure legends by aspiration of media and replacement with fresh media containing 0.1 uM dexamethasone (Sigma) at time 0 (Altman et al., 2015). “Unsynchronized” if indicated emphasizes no dexamethasone exposure. All T cell experiments reflect “unsynchronized” cells. MCF7 and HCT116 were unsynchronized in in vitro experiments.
Luciferase reporter cell lines and monitoring
Generation of real-time luciferase reporters
Clonal U2OS Arntl::dLUC and U2OS Per2::dLUC cell lines (sourced as noted above) stably express firefly luciferase under the control of mouse Arntl or Per2 promoters. The luciferase has been destabilized (“dLUC”) through addition of degradation sequences, enabling it to serve as a real-time reporter of the activity of the clock network (Zhang et al., 2009). A portion of the Arntl::dLUC data shown and not shown was generated in a clonal cell line also stably expressing Renilla luciferase driven by an independent promoter. This line was generated by transfection (Lipofectamine LTX with Plus reagent, Promega) followed by 150 ug/mL hygromycin selection (Corning) for a vector in which the SV40 promoter from pGL4.73 (Promega) was inserted in front of destabilized Renilla (hRlucCP) in pGL4.78 (Promega). Derivation of a representative clone by serial dilution allowed cessation of antibiotic selection. This control reporter enabled early characterization and validation of the clock reporter. However, the luciferase activity data shown in this paper exclusively represent the luciferase activity of the firefly luciferase clock reporter, as only the substrate for this enzyme (beetle luciferin (Promega), which is not a Renilla luciferase substrate) was supplied regardless of Renilla status. Experiments (shown and not shown) employing Arntl::dLUC cells both with and without renilla expression demonstrated that the background presence of this control enzyme had no effect on the presented data. Therefore, both cell lines are referred to here as U2OS Arntl::dLUC for simplicity.
PGK1-HRE::dLUC and VEGF-HRE::dLUC real-time luciferase-based reporters of hypoxia response element (HRE) activity were generated by inserting three copies of an HRE motif derived from the human PGK1 promoter (lifted from HRE-pGL2-TK, gift of Dr. Celeste Simon) or five copies of an HRE motif from the human VEGF promoter (derived from 5HRE/GFP (a gift from Martin Brown and Thomas Foster, Addgene plasmid #46926)) into the promoter region of destabilized firefly luciferase (Luc2CP, “dLUC”) in the puromycin-selectable vector pGL4.22 (Promega) and confirmed by sequencing. Stable cell lines expressing an HRE::dLUC luciferase reporter and the control Renilla reporter described above were generated in U2OS cells through co-transfection of cells plated in 6-well dishes with 1.25 ug of each plasmid using Lipofectamine LTX with Plus reagent followed by 1.5 ug/mL puromycin (Gibco) and 150 ug/mL hygromycin selection simultaneously (PGK1::dLUC) or sequentially (VEGF::dLUC). Single-cell clones of the HRE::dLUC, SV40::hRlucCP reporters representative of the population were derived by serial dilution and antibiotic selection ceased. As above, the data presented in this paper reflect luciferase activity exclusively of the firefly luciferase reporter as only substrate for this enzyme was supplied. Thus, these lines are referred to as PGK1-HRE..dLUC and VEGF-HRE..dLUC for simplicity.
Real-time monitoring of luciferase reporters
Reporter cells were plated in 35 mm dishes or 24-well plates to be confluent at the start of analyses. For example, typically 375,000 U2OS cells per 35 mm dish or 62,500 cells per well of a 24-well plate were seeded two days prior. At time zero, culture plates were aspirated, administered fresh media supplemented 0.1 uM dexamethasone and 0.1 mM beetle potassium luciferin (Promega), sealed against desiccation with vacuum grease (35 mm dishes) or adhesive optical PCR plate film (24-well plates, Applied Biosystems), and immediately placed in a Lumicycle-32 or Lumicycle-96 luminometer (Actimetrics). Luminescence (counts/sec; “relative light units (RLU) per second”) was recorded every 10 minutes for multiple days and exported to Excel (Microsoft) with LumiCycle Analysis software (Actimetrics). If monitored cells were treated with chemical inhibitors, these were added to the media at time zero; if siRNA treated, (except where noted) this was performed the day prior as described below and in legends. Depicted “washouts” were achieved by temporary removal of a plate from the Lumicycle and media replacement. All Lumicycle data are generated in atmospheric CO2 conditions for reasons noted above. All data presented as raw data with no detrending. Reported amplitudes for Torin treatments (below) represent the mean peak-to-peak amplitude over four days manually calculated from the mean luminescence of biological triplicates (as in Figures 4I, S4N) as the difference between a peak and the following trough beginning 1 day after synchronization.
Lysate luciferase assay
The photon-producing luciferase reaction requires oxygen as a reactant and is therefore susceptible to suppression of enzymatic rate in hypoxia. Therefore, we did not monitor luminescence in real-time in hypoxia. Instead, lysate was collected from hypoxic (1% O2) and normoxic control plates at time points and then subsequently assayed for luciferase activity in normoxia. In brief, reporter cells were plated in 35 mm dishes as above. Were indicated in legends, the following day, media was placed in the hypoxia chamber overnight in flasks to permit pre-equilibration. Media was similarly allowed to equilibrate in normoxia for control arms. The following day, cells were brought to the hypoxia chamber (or normoxic incubators) and media was exchanged for (pre-equilibrated) media supplemented with 0.1 uM dexamethasone. At time points, cells were rinsed once with PBS and then lysed by scraping in 500 uL passive lysis buffer (Promega E1501). Cleared supernatant was then frozen at −80 °C until assay by luminescence with the Luciferase Assay System (Promega) in 96-well format on a GloMax 96 microplate luminometer (Promega) or Biotek Synergy HT microplate reader.
Luciferase assay of cell lysates was also used to verify live-cell real-time luminescence data (Figures S1C-D). 13,000 U2OS Arntl::dLUC cells per well were plated in opaque 96-well culture plates. Beginning two days later, a reverse timecourse was initiated by synchronizing wells in triplicate in staggered fashion. Media contained luciferin allowing luminescence from live cells to be measured with the same microplate luminometer immediately prior to lysis of cells and luciferase assay directly in the plate with the Luciferase Assay System. In Figures S1C-D, low buffer is in atmospheric CO2 and high buffer media is in 5% CO2.
Single-cell luminescence imaging
Cell culture
Frozen Arntl::dLUC U2OS cells were received by the Welsh lab on dry ice from the Dang lab and thawed. Cells were grown in 35 mm cell culture dishes in DMEM cell culture medium with 10% heat inactivated fetal bovine serum (GIBCO), 1× MEM non-essential amino acids, and 1× penicillin-streptomycin in a humidified atmosphere of 5% CO2 at 37 °C. Cells were imaged at 30% confluence to allow for clear visual discrimination of single cells.
Imaging
Immediately before imaging, medium was replaced with PIPES/HEPES-buffered media adjusted to pH 6.3, 6.8, or 7.4 and containing 1 mM luciferin and 0.1 uM dexamethasone prepared as described above but with the serum replaced by 1X B-27 (Gibco). Imaging was conducted in two darkrooms, each with a slightly different camera and temperature control setup. In both darkrooms, plates were sealed and placed on an inverted microscope stage (Olympus IX71) within a heated lucite chamber (Darkroom 1: Solent Scientific, UK; Darkroom 2: Precision Control Systems, Eden Prairie, MN) at a constant temperature of 36 °C. Light from the samples was collected using an Olympus 4× XLFLUOR objective (NA 0.28) and transmitted to a CCD camera (Darkroom 1: Spectral Instruments SI800, Tucson, AZ, USA; Darkroom 2: Andor Technologies DU934, Belfast, UK) cooled to −90 °C. Noise was reduced by 4×4 pixel binning. Exposure was set to 12 min, and images were collected at 30 min intervals for 4 days. Further details in published methods (Welsh et al., 2004).
Image processing
Cosmic ray artifacts were removed in MetaMorph (Molecular Devices, Sunnyvale, CA) by taking the minimum value of pixelwise comparison of consecutive images. Luminescence intensity was measured in a manually defined region of interest (ROI) for each cell. ROI positions were adjusted to accommodate cell movement. Seven to ten cells were analyzed per plate (10 cells per plate at pH 7.4, fewer (7–9 cells per plate) for pH 6.3 due to cell death). Criteria for cell selection were that cells had to survive the course of the experiment and cells could not touch other cells to the point that they could not be tracked. Luminescence intensity values and ROI areas were logged in Microsoft Excel, and intensity was converted to analog-to-digital units (ADU) according to the following equation: ADU= (luminescence intensity-background intensity) × ROI area
Background intensity was set as the minimum luminescence intensity recorded across all cells for each experiment.
Determination of rhythmicity
To exclude high initial luminescence transients, the first twelve hours of data were excluded. Luminescence values between 0.5 and 3.5 days, for a total of 72 hours of data, were analyzed for each experiment. To determine average brightness of each cell, mean ADU was computed across 0.5 to 3.5 days. Luminescence time series were imported into LumiCycle Analysis. To determine period, phase and amplitude, data were fitted to a best fit sine curve corrected for dampening. Circadian rhythmicity was determined by the fast Fourier transform (FFT) peak, or percent of total variance within the circadian range corresponding to 20–36 hour periods. The scatter plot was obtained by plotting FFT peak against period. FFT peak value of 0.07 was chosen to exclude period values that were clearly outside the typical circadian range. Cells with FFT peak ≥ 0.07 were considered to be rhythmic. Percent rhythmic cells was computed for each pH value. Only rhythmic cells were analyzed for the below attributes.
Analysis of circadian attributes
After excluding data from cells with FFT peak < 0.07, the impact of equipment between the two darkrooms on average brightness, normalized FFT peak, period, phase and amplitude were investigated using a t-test for each pH. As expected with two different camera setups, only average brightness and amplitude were influenced. Consequently, average brightness and amplitude values were normalized by scaling to the maximum and minimum values found for each darkroom. We verified that our normalization method did not influence results by analyzing raw data from each darkroom individually before pooling normalized data from both darkrooms. As values for FFT peak, period and phase were unaffected by darkroom, raw data were pooled without normalizing for analysis of these metrics. An outlier was excluded when α ≤ 0.05 (Grubb’s test). Significance was found by running ANOVA and post-hoc Dunnett’s multiple comparison tests comparing pH 6.8 and pH 6.3 to the control (pH 7.4).
CRISPR-editing
EIF4EBP1 (4EBP1) and TSC2 were silenced in U2OS Arntl::dLUC cells through CRISPR editing using pSpCas9(BB)-2A-GFP (PX458) (a gift from Feng Zhang, Addgene plasmid #48138) with sgRNA sequences from the GeCKO library (Shalem et al., 2014): TGAAGAGTCACAGTTTGAGA for EIF4EBP1 and TCTGCTGAAGGCCATCGTGC for TSC2. Oligos were phosphorylated, annealed, and ligated into the PX458 backbone, which was then transformed into bacteria, isolated, and verified by sequencing. The empty PX458 vector was used as control. 1.15 million cells were seeded in 10 cm plates and the following day transiently transfected with 5 ug of plasmid using Lipofectamine 3000 (Invitrogen) according to the manufacturer’s directions. 24 hours later, GFP positive cells were sorted by FACS as single cells into 96-well plates. Resulting clonal lines were then screened by immunoblot for silencing of target. Because clones derived from the parental U2OS Arntl::dLUC line exhibit heterogeneity in intensity of luciferase expression (regardless of transfection), edited cell lines were matched to an empty vector clonal line determined to have similar luciferase expression in control (pH 7.4) conditions (#EV1_16) for the convenience of more ready visualization of changes in amplitude of oscillation in response to experimental manipulations during real-time bioluminescence monitoring.
Stable overexpression
U2OS Arntl::dLUC lines stably expressing constitutively active RAGB or a control GTP-binding protein, RAP2A, were created by moving the flag-tagged inserts in Flag-pLJM1-RagB99L and Flag-pLJM1-Rap2A (gifts from David Sabatini, Addgene plasmids #19315 and #19311) into pcDNA3.1+ (Invitrogen) using Nhel and EcoRI restriction sites and confirming by sequencing. 200,00 cells were seeded into 6-well plates and the following day transfected with 0.5 ng of linearized (BglII) plasmid using Lipofectamine 3000 and then selected with 600 ug/mL G418 (Corning) beginning two days later. Cells were maintained in selection until the initialization of experiments.
U2OS Arntl::dLUC lines stably expressing constitutively active RHEB (Urano et al., 2005) where similarly created by seeding 200,000 cells in a 6-well dish and the following day transfecting with 0.5 ng of sequence-confirmed pcDNA3-FLAG-Rheb-N153T (gift from Fuyuhiko Tamanoi, Addgene plasmids #19997) using Lipofectamine 3000. Beginning two days later, cells were selected with 800 ug/mL G418 followed by 400 ug/mL maintenance. Clones were derived by serial dilution and screened for expression of the transgene. As for CRISPR lines discussed above, a clone (#EV2_6) also derived from U2OS Arntl::dLUC and transiently transfected with an empty vector (PX458) was designated a control for its similar baseline luciferase expression in pH 7.4 conditions. G418 selection was ceased after derivation of clones.
293T cells stably expressing WDR24 (a subunit of GATOR2) or a control protein (RAP2A) were created through lentiviral infection. 293T cells were seeded in 10 cm plates so as to be 75% confluent the following day when transfected with 3 ug of sequence-confirmed Flag-pLJM1- WDR24 or Flag-pLJM1-Rap2A (gifts from David Sabatini, Addgene plasmids #46337 and #19311) and 2.25 ug second-generation packaging plasmid psPAX2 and 0.75 ug pMD2.G envelope plasmid (gifts of Didier Trono, Addgene #12260 and #12259) using Lipofectamine 3000. Virus-containing supernatant was collected after 72 and 96 hours, filtered, concentrated with an Amicon Ultra-15 10K centrifugal filter device (Millipore), and used to transduce in the presence of 8 ug/mL polybrene (Millipore) subconfluent 293T cells seeded the day prior in 35 mm dishes. The following day, cells were trypsinized and expanded and 1 ug/mL puromycin selection was begun. Cells were maintained in selection until initialization of experiments.
U2OS Arntl::dLUC cells stably expressing a genetically-encoded cytoplasmic ratiometric pH probe, mCherry-SuperEcliptic (SE) pHluorin (a gift from Sergio Grinstein, Addgene plasmid #32001) (Koivusalo et al., 2010), were generated by seeding 250,000 U2OS Arntl::dLUC cells into one well of a 6-well plate and the following day transfecting with 1.25 ug of sequence verified mCherry-SEpHluorin using Lipofectamine LTX with Plus reagent. Beginning three days later, cells were selected with 400 ug/mL G418. After emergence of a stable line, fluorescence- activated cell sorting was used to derive a polyclonal population with mid-range brightness of the reporter to avoid reporter mislocalization from excessive expression. This line was maintained in selection until initialization of experiments.
pH measurements
Extracellular pH
Extracellular pH was determined by measuring the pH of a sample of culture media using the Mettler Toledo SevenGo pH meter SG2 with either the InLab micro probe or the InLab 413 SG/2m probe with automatic temperature compensation. These meters were also used to adjust the pH of media and other reagents as needed. The pH meter was recalibrated with 3 standards (Mettler Toledo 51302080) at the start of every experiment.
Intracellular pH
Intracellular pH was assessed by a method adapted from previous descriptions (Koivusalo et al., 2010) and the manufacturer-provided protocol for the intracellular pH buffer calibration kit (Invitrogen P35379). U2OS Arntl::dLUC cells stably expressing a genetically-encoded cytoplasmic ratiometric pH probe, mCherry-SuperEcliptic (SE) pHluorin, in which the fluorescence intensities of the fused modified GFP (SE pHluorin) and mCherry are pH sensitive (pKa = 7.2) and insensitive, respectively, were generated as described above. 200,000 cells were plated in 6-well dishes and allowed to grow for two days in standard humidified tissue culture incubators (5% CO2, 37 °C) in normal DMEM before treating with the inhibitors or medias for the duration indicated in figure legends. To generate a standard curve, each well of an untreated plate grown in parallel was washed twice with PBS and then incubated with a media pH standard (25 mM HEPES, 25 mM PIPES DMEM, pre-adjusted to pH 8.0, 7.5, 7.0, 6.5, or 6.0, as above) containing 10 uM valinomycin and 10 uM nigercin (Invitrogen) for 5 minutes in atmospheric CO2 at 37 °C before imaging. Alternatively, the same well was serially treated with each standard and imaged with similar results. Three or more 10× fields were captured from each standard using an Olympus IX81 inverted fluorescence microscope quipped with a 10X objective (UPLFLN10X2PH) and a cooled 12 bit CCD camera (Sensicam QE, PCO) controlled by SlideBook 6 software (e.g. Figure S4B). Experimental plates (DMOG-treated, etc.) were subsequently likewise imaged with identical microscope hardware and acquisition settings (e.g. Figure S4C). Images were then background-corrected in Fiji (Image J2, rolling ball background subtraction) before measuring the integrated intensity across the whole field. The ratio of the SE pHluorin (GFP) and mCherry intensities for each field was calculated. A standard curve (e.g. Figure S4A) was generated relating the mean ratios of the standards to the pH of the standard (calibration) medias. The linear fit equation was used to calculate the intracellular pH of the experimentally treated plates (e.g. Figure 4A). This described approach yielded similar results in validation experiments (not shown) as ratiometric assessment of regions of interest drawn within the cytoplasm of cells imaged under higher power (40×). Displayed images are uniformly contrasted.
Chemical inhibitor treatments
Prior to treatment with inhibitors, 375,000 cells plated in 35 mm dishes were allowed to expand in normal DMEM in standard 5% CO2 37 °C incubators. Dose and duration of treatments are as indicated in legends. DMOG (Sigma) and vehicle (DMSO) treatment (regardless of buffer conditions) were in atmospheric CO2, except S1D and S4L where high buffer media was used in 5% CO2 (and low buffer media was used in atmospheric CO2). All other chemical inhibitors (desferrioxamine (Calbiochem), GNE-140 (NCATS Chemical Genomics Center) (Boudreau et al., 2016), amiloride hydrochloride hydrate (Sigma), α-cyano-4-hydroxycinnamic acid (Sigma), Torin1 (Cayman), Torin2 (Cayman), rapamycin (Sigma), n-butanol and tert-butanol (Sigma), ciliobrevin D (Calbiochem), nocodazole (Cayman), and A-484954 (Sigma) were used in standard low buffer media in atmospheric CO2.
Primary alcohols like n-butanol deplete phosphatidic acid required for mTORC1 signaling by substituting for water in phosphatidic acid synthesis pathways, effectively resulting in generation of phosphatidylalcohol at the expense of phosphatidic acid. Bulkier tertiary alcohols, like tert- butanol, do not efficiently participate in these transphosphatidyl reactions and therefore are used as a negative control (Toschi et al., 2009).
Timecourse design
Each 48- or 52-hour timecourse with 4-hour intervals of RNA and protein lysate harvest was collected as a pair of staggered 24- or 28-hour parallel timecourses. Three days prior to the timecourse start, 375,000 U2OS Arntl::dLUC cells were seeded in 35 mm dishes and allowed to grow in normal DMEM in 5% CO2. Twenty-four hours later, another set of plates was seeded in identical fashion. Twenty-four hours later, cells of the first set were then synchronized and treated with media of the indicated oxygen tension, pH, buffering capacity, or DMOG concentration. Twenty-four hours later, the second set of plates was synchronized and conditioned in identical fashion. For such timecourses in hypoxia, media was equilibrated overnight in the hypoxia chamber (and in parallel in normoxia) prior to relocation of cells to the hypoxia chamber and media exchange. Harvest of RNA or protein began at the indicated intervals with the 4-hour and 28-hour samples of each arm being collected together, followed by the 8-hour and 32-hour samples and so forth.
Protein Immunoblotting
Following media aspiration, cells in 35 mm dishes were washed once with cold PBS and then harvested by scraping over ice in lysis buffer (Mammalian Protein Extraction Reagent (Thermo Fisher Scientific) supplemented with protease inhibitor cocktail (Promega G6521), two phosphatase inhibitors (Sigma P5726, P0044), and, typically, prolyl hydroxylase inhibitor (200 uM desferrioxamine)). (For Figure S1I, protein was instead harvested by trypsinizing cells, washing once in PBS, and resuspending in lysis buffer.) After collection of scraped cells and lysate (or after suspending cells in lysis buffer), lysis was allowed to continue on ice for at least 20 minutes. Protein lysates were cleared by centrifugation at 13,000 rpm at 4 °C and stored at - 80 °C until further use. After thawing lysates on ice and quantifying protein yield with the DC Protein Assay (Bio-Rad), equal ug of total protein were resolved by SDS-PAGE using Criterion pre-cast Tris-Glycine 7.5% or 4–20% gradient gels (Bio-Rad). Protein was transferred by dry transfer (iBlot) to nitrocellulose membranes, which were then blocked in 5% BSA in TBST for 1 hour. Primary antibodies included anti-HIF1α (Cayman; 1:500), anti-a-tubulin (Calbiochem; 1:10,000), anti-PER2 (Proteintech; 1:1000), anti-CRY2 (Epitomics, 1:500); anti-REDD1 (Proteintech; 1:1000), anti-EX2/3 (Clippinger et al., 2011) (1:6000), anti-kinesin-1 (Santa Cruz; 1:1000), anti-phospho-Thr202/Tyr204 of ERK1/2 (Cell Signaling; 1:2000), anti-RHEB (Abnova, 1:1000), and anti-phospho Thr982 of PERK (lab of Constantinos Koumenis; 1:1000). Primary antibodies against BMAL1, CLOCK,phospho-Ser2448 of mTOR, mTOR, phospho-Thr389 of S6K, S6K, phospho-Ser235/236 of S6, S6, phospho-Thr37/46 of 4EBP1, 4EBP1, 4EBP2, phospho-Ser209 of eIF4E, eIF4E, phospho-Thr56 of eEF2, eEF2, Sestrin-2, FLAG-tag, TSC2, phospho-Thr172 of AMPKa, AMPKa, phospho-Ser338 of c-Raf, c-Raf, ERK 1/2, phospho-Ser9 of GSK3β, RHEB, PERK, ATF4, CHOP, phospho-Ser51 of eIF2α, and eIF2α were all from Cell Signaling and used at 1:1000. Secondary antibodies included Alexa Fluor 790 goat anti-mouse IgG (H+L) (Invitrogen; 1:10,000) and Alexa Fluor 680 goat anti-rabbit IgG (H+L) (Invitrogen; 1:8000). (See Key Resources Table.) All antibodies were diluted in blocking buffer. Immunoblots were imaged with Odyssey CLx infrared imaging system (LI-COR) and uniformly contrasted.
Where quantification is reported, background-corrected band intensities were calculated with Image Studio software with background defined as the median intensity immediately above and below the quantified band. Immunoblots from the same gel are enclosed within a box with black outline. Yellow lines are for readability only. When reprobing for additional targets of closely separated molecular weights, membranes were stripped with stripping buffer (Thermo) to dim signal of first target to facilitate imaging. Except when reblotting for total protein (e.g. S6K) after phosphoblot (e.g. pS6K), reprobing for additional targets of similar molecular weight was avoided. Blots of tubulin loading controls appear in multiple figures when data from a single membrane were divided between these multiple figures for clarity of presentation.
Protein Immunoprecipitation
Starvations and subsequent immunoprecipitation proceeded as adapted from previous descriptions (Wolfson et al., 2017) and the manufacturer-provided protocol for Anti-FLAG M2 affinity gel (Sigma). 2 million 293T cells stably expressing FLAG-tagged WDR24 or RAP2A (described above) were seeded in 10 cm plates and allowed to expand in normal DMEM in 5% CO2. Two days later, media was aspirated and cells were incubated for 50 minutes in 10 mL “starvation” conditions consisting of either amino acid free media (-AA) or leucine free media (-L) of pH 7.4 or pH 6.3 after washing twice with these respective medias. For “rescues,” one mL of 11× concentrated solution of amino acids (+AA) or leucine (+L) (in water) was spiked into plates so as to restore amino acids to normal DMEM levels. (See starvation media descriptions below.) An equal volume of water was added to control (continued starvation) plates.
After 10 minutes, cells were washed once with cold PBS and then lysed with Triton lysis buffer (1% Triton X-100 (Sigma T8787), 10 mM β-glycerol phosphate (Sigma G9422), 10 mM pyrophosphate (Sigma 71501), 40 mM HEPES pH 7.4, 2.5 mM MgCl2 (Sigma M8266), and EDTA-free protease inhibitor (Roche 4693159001, two mini tablets per 14 mL)) by scraping plates over ice. After 20 minutes incubation on ice, lysate was cleared. Anti-FLAG M2 affinity gel was washed three times in lysis buffer by resuspension. These resuspensions, and those during all subsequent washes, were performed by pipetting up and down with tips enlarged by cutting. 30 uL of a 50:50 slurry of lysis buffer and gel were then added to each lysate (or to a volume of lysate diluted in lysis buffer to normalize input volume and total protein across samples). As a negative control, slurry was similarly added to lysis buffer. Lysate and resin then incubated rotating for 2 hours at 4°C. Resin was then washed once in lysis buffer and three times in lysis buffer containing 500 mL NaCl. Resin was then resuspended in 30 uL 2× SDS loading dye with DTT (125 mM Tris-HCl pH 6.8, 4% SDS, 20% glycerol, 200 mM DTT, and 0.004% bromophenol blue), heated to 95 °C for 5 minutes, and resolved by SDS-PAGE as above. Note the Ig antiFLAG heavy chain (visible in all lanes, including the no lysate control) appears to run just below sestrin-2 on immunoblots. Equal volume aliquots of cleared lysate (or diluted lysate) set aside prior to addition of resin were boiled in SDS loading dye in parallel and resolved on the same gel to reflect inputs.
Serum and amino acid starvations
Medias used for 293T or U2OS starvations were DMEM medias buffered in one of the manners described above but without the indicated amino acid(s) or serum. In detail, medias used for starvations in immunoprecipitations (Figures S5C, S5D) or for Figure 5C were pH 7.4 and pH 6.3 media (buffered as described above) but without amino acids (USBiologic 9800–13 with 25 mM glucose and 1 mM pyruvate (Gibco) restored) or without leucine (USBiologic D9806–05, with 25 mM glucose and 4 mM glutamine restored). These medias were made with 5% undialyzed (full) FBS (HyClone), so are more accurately “near-starvation” conditions. For all other amino acid starvation experiments, medias were formulated from USBiologic 9800–13 with appropriate restorations and 5% (or 10% in Figure 5B) dialyzed serum (Gibco; making them complete amino acid starvations), with Figures 5B and6J using buffering/pH as in pH 7.4 and pH 6.3 media and all others using buffering as in low buffer media (described above). Prior to incubation in starvation media, cells were washed at least twice in starvation media. Where applicable, “no starvation” controls were similarly washed with replete media. All amino acid rescues used 11× concentrates of amino acid(s) (made from powders (Sigma)) such that addition of a volume equal to 10% of culture volume restored amino acid content to that of normal DMEM. An equal volume of solvent (water) was spiked into control plates. Serum starvation, as in Figure 5A, was pH 7.4 or 6.3 media without serum and was rescued by addition of undialyzed (full) FBS to restore 10% serum levels. Rescues were confirmed to not appreciably alter media pH. Duration of starvations and rescues as indicated in legends. All starvation medias were used in atmospheric CO2.
Viable previously activated OTI CD8+ T cells were obtained through Ficoll (GE healthcare) gradient of splenocytes (derived as described above). Cells were washed two times in PBS before starvation of amino acids and growth factors by incubation in PBS (pH 7.4) for 1 hour. Cells then either continued in starvation for 30 minutes or were rescued from starvation into RPMI media of the indicated pH (formulated as described above) for 60 minutes.
RNA collection
Media was aspirated from cells growing in 35 mm dishes. 1 mL of TRIzol Reagent (Invitrogen) was added to plates. A cell scraper was then used to collect cells and lysate which was frozen at −80 °C until RNA isolation following the manufacturer’s instructions with substitution of 1- Bromo-3-chloropropane for chloroform. RNA used for qPCR in Figures S1K or S7F was instead extracted with the RNeasy Plus Mini Kit (Qiagen) following cell trypsinization (Figure S1K) or direct application of the kit’s lysis buffer to aspirated 12-well culture plates and scraping (Figure S7F).
Quantitative Real-Time PCR
Isolated RNA was reverse transcribed to complementary DNA (cDNA) using TaqMan Reverse Transcription Reagents (Invitrogen) using the Oligo d(T) method. cDNA was then used as template for quantitative real time PCR with specific human primers using Power SYBR Green or TaqMan Universal PCR master mixes (Thermo Fisher) using a ViiA 7 real-time PCR system or StepOnePlus Real-Time PCR System (Applied Biosystems). Target expression was normalized to B2M and relative expression was calculated using the delta-delta CT method. For 52-hour qPCR timecourses (Figures 2B-D, S2A, S2C, S2F, S3A (right)), data are normalized to the respective 4-hour control (vehicle, normoxia, or pH 7.4) time point.
siRNA knockdown
Effective dicer-substrate short interfering RNAs (DsiRNAs, referred to as “siRNA”) in Trifecta kits (IDT) were identified through qPCR-based assessment of knockdown of target transcript in U2OS cells prior to use. 185–375,000 or 50,000 cells were seeded in 35 mm dishes or 24-well dishes, respectively, and allowed to expand in standard DMEM in 5% CO2 incubators. The following day, cells were transfected with DsiRNA at the concentrations indicated in legends using Lipofectamine RNAiMAX (Invitrogen) 26–31 hours prior to cell synchronization and further treatment, except Figure 7B where time points are as detailed in figure and legend. DsiRNA included those against HIF1A, EPAS1, EIF4EBP1 (DsiRNA oligo #1 used in Lumicycle experiment, #2 used in western), EIF4EBP2, SESN1, SESN2, SESN3, KIF5B, and TSC2. Equimolar non-targeting DsiRNA was used as a control. Concentrations of DsiRNA in Figure 1E are 20 nM each condition (10 nM when two siRNA). Concentrations elsewhere as indicated in figure legends. DsiRNA sequences in Table S7.
For validation of the anti-RHEB antibody used for immunofluorescence (see below), 200K U2OS Arntl::dLUC cells were seeded in each well of a 6-well plate. The following day, cells were transfected with 20 nM total siRNA per condition using RNAiMAX. More precisely, the “siCtl” condition was 20 nM non-targeting DsiRNA, “siRHEB” was 10 nM DsiRNA targeting RHEB and 10 nM non-targeting DsiRNA, “siRHEBLV” was 3.33 nM each of three different DsiRNA against RHEBL1 and 10 nM non-targeting DsiRNA, and “siRHEB + siRHEBLV” was 10 nM DsiRNA targeting RHEB and 3.33 nM of the three siRNA against RHEBL1. After 26 hours, cells were trypsinized and reseeded in 12-well dishes with or without glass coverslips for immunofluorescence (described below) or RNA and protein harvests, respectively. Cells were fixed or harvested 56 hours after siRNA treatment. DsiRNA sequences in Table S7.
RNA-sequencing and data processing
RNA integrity was verified by bioanalyzer (Agilent Technologies) (RIN 8.7–10.0, median = 9.7). Libraries were prepared from total RNA using the Illumina TruSeq Stranded mRNA Library Preparation kit (Illumina). Pooled libraries were sequenced as single 100 base pair reads on the HiSeq 2500 in rapid mode using V4 chemistry at the University of Pennsylvania Next Generation Sequencing Core. The RNA-seq raw reads (FASTQ files) were aligned to the reference genome hg38 (https://genome.ucsc.edu/cgi-bin/hgGateway?db=hg38) using Spliced Transcripts Alignment to a Reference (STAR) aligner (https://github.com/alexdobin/STAR). The GENCODE v22 (https://www.gencodegenes.org/releases/22.html) annotation was used as the guiding transcriptome annotation during STAR alignment. The aligned RNA-Seq reads (BAM files) were further processed through Cufflinks (http://cole-trapnell-lab.github.io/cufflinks/) to assemble and quantify transcripts, using GENCODE v22 as the reference transcriptome annotation. The fragments per kilobase of transcript per million mapped reads (FPKM) calculation was used to normalize read count by dividing it by the gene length and the total number of reads mapped to genes. Analysis was limited to protein-coding genes (as defined by GENCODE v22 annotation) with mean FPKM expression over all time points and pH conditions greater than 2 (10,794 genes, Table S1).
Global gene expression analyses
Circadian rhythmicity of the 10,794 protein-coding transcripts detected by RNA-sequencing was assessed by ARSER algorithm (Table S2) (Yang and Su, 2010). ARSER detrends data and then detects rhythmic signals with a period between 20 and 28 hours through a combination of autoregressive spectral analysis (alternative to the classical fast Fourier transformation) and harmonic regression (sinusoidal fits) and then reports relevant parameters such as period, phase, and amplitude along with significance statistics. ARSER was run through the MetaCycle package implemented in R (Wu et al., 2016). ARSER has been shown to frequently perform better than other popular circadian gene identification algorithms when analyzing data collected over two days with 4-hour resolution (Wu et al., 2016; Yang and Su, 2010). Cutoffs of p<0.05 and Benjamini and Hochberg false-discovery rate (FDR) <0.20 were used to identify circadian transcripts. The Ensembl IDs of these genes with statistically significant circadian expression in pH 7.4 and pH 6.3 were then submitted to ToppFun (https://toppgene.cchmc.org/) with default settings to determine significantly enriched Pathway ontologies (p<0.05, Benjamini and Yekutieli (B&Y) FDR (q) < 0.05). All significant Pathway ontologies and associated p-values are presented in corresponding figures.
Transcripts highly induced or suppressed in acid were defined as those for which the log2 of the ratio of the mean expression over all 13 time points (4h-52h) in pH 6.3 to pH 7.4 was greater than 1 or less than −1, respectively (column AC of Table S1). The Ensembl IDs for these genes were then submitted to ToppFun to determine significantly enriched GO.Biological Process ontologies (p<0.05, Benjamini and Hochberg (B&H) FDR (q) < 0.05). All significant Biologic Process ontologies and associated p-values are presented in figures for acid-suppressed genes. For induced genes, the top 10 are presented.
All heatmaps and to-scale Venn Diagrams were generated with ggplot2 and VennDiagram packages implemented in R Studio. For heatmaps in Figures 3A and S3B, expression in each pH condition was normalized separately for each gene, with each gene’s maximum and minimum expression values across all 13 time points (52-hours) in that pH condition set to 1 (navy) and 0 (white), respectively, with linear scaling over the intervening expression range (i.e. 0.5 is midway between minimum and maximum expression). For heatmaps in Figures 3F and3G, the maximum and minimum expression values for each gene across all time points and pH conditions (i.e. regardless of pH) were set to 1 (navy) and 0 (white), respectively, with linear scaling over the intervening expression range (i.e. 0.5 is midway between minimum and maximum expression). Heatmaps in Figures 3A and S3B are ranked by phase of transcript oscillation in pH 7.4 or 6.3, respectively. Heatmaps in Figures 3F and3G are ranked from top by most highly induced or suppressed gene, respectively. Orders of genes (top-to-bottom) in heatmaps match that appearing in corresponding Tables S3–6 (top-to-bottom), as indicated in Table legends.
Immunofluorescence
10,000–20,000 U2OS Arntl::dLUC cells were plated on 18mm glass coverslips in 12-well dishes and allowed to adhere and grow in normal DMEM in 5% CO2 for 1–2 days. Media was then changed to experimental conditions (pH 7.4, pH 6.3, starvations medias, etc.) as described above and as indicated in figure legends. Where indicated, starvation was followed by “rescue” of pH/starvation by change of media (for pH conditions) or spike in of amino acids (as described above). Cells were then rinsed with PBS once and fixed for 15 min with fresh 4% paraformaldehyde in PBS at room temperature. Cells were then rinsed twice with PBS (1× quick, 1 × 5 min) before permeabilizing for 5 min in 0.05% Triton X-100 in PBS. Coverslips were then washed two times for 5 min each in PBS and then blocked for 30 min in filtered 5% goat serum (Sigma) in PBS. Coverslips were then incubated in primary antibody in blocking buffer for 2 hours at room temperature (rabbit anti-mTOR, Cell Signaling, 1:40–1:320; mouse anti-LAMP2, Abcam 25631, 1:100) or overnight at 4 °C in a humidified chamber (rabbit anti-mTOR,1:200; rabbit anti-LAMP1, Cell Signaling, 1:200; mouse anti-RHEB, Abnova, 1:1000), washed three times in PBS, and then incubated for 1 hour in secondary antibodies (goat anti-rabbit Alexa Fluor 488 and goat anti-mouse Alexa Fluor 594 (1:400–1:1000) or 555 (1:500–1:1000)) in blocking buffer at room temperature. Alexa Fluor 488-conjugated rabbit anti-a-tubulin (Cell Signaling, 1:100–1:200) was co-incubated with goat anti-mouse Alexa Fluor 594 when used. When combined with goat anti-mouse Alexa Fluor 555, tubulin staining was performed separately after this secondary antibody. Filamentous actin was stained with 330 nM Alexa Fluor 488 phalloidin (Cell Signaling) for 15 min in blocking buffer following other secondaries. When performed, a 140 – 860 nM solution of DAPI in PBS was applied to coverslips for 1–10 min after aspirating secondaries. See Key Resources Table.
For four-color staining, coverslips seeded two days prior with 10,000 U2OS Arntl::dLUC cells or U2OS Arntl::dLUC RHEBN153T cells were treated and processed as above with overnight incubation with rabbit anti-mTOR and mouse anti-RHEB. After washing, coverslips were incubated with goat anti-rabbit Alexa Fluor 647 (Invitrogen, A32733, 1:1000) and goat anti-mouse Alexa Fluor 555 secondaries as above. Coverslips were then blocked for 30 minutes in filtered 5% rabbit serum (Sigma) in PBS, incubated overnight with sheep Alexa Fluor 488- conjugated anti-LAMP1 (1:200, R&D Systems) in blocking buffer (5% rabbit serum in PBS) at 4 °C, and stained for DAPI.
After washing three times for 5 min each in PBS, coverslips were rinsed once in distilled water and mounted onto glass slides with Fluoromount-G (SouthernBiotech) and later sealed with covergrip coverslip sealant (Biotium). All immunofluorescence reflects unsynchronized cells (no dexamethasone). No primary, no secondary, and single-color controls were performed to validate specificity of antibodies and confirm negligible bleed through across antibody-channel combinations.
For validation of the anti-RHEB antibody used for immunofluorescence, U2OS Arntl::dLUC cells were treated with siRNA as described above and 26 hours later reseeded onto glass coverslips in 12-well dishes at a density of 100K cells per well. The following day (56 hours after siRNA treatment), cells were fixed and processed as described above with overnight incubation with anti-RHEB (1:1000) and anti-LAMPI (1:200) antibodies followed by goat anti-mouse Alexa Fluor 488 and goat anti-rabbit Alexa Fluor 594 (Invitrogen, 1:1000 each).
Following starvation and rescue as described above and in figure legends, previously activated OTI CD8+ T were processed for immunofluorescence. Cells were fixed by resuspension in methanol free 4% PFA (Invitrogen) for 10 minutes at 37 °C, and then washed 3 times with PBS and stored in PBS at 4 °C. A hydrophobic barrier (PAP pen, 71310 Electron Microscopy Sciences) was used to demarcate a region on glass coverslips that was then coated with 1 mg/mL poly-D-lysine (Sigma) for 1 hour at room temperature before washing three times with water and once with PBS. Fixed cells resuspended in PBS were then allowed to settle onto the poly-D-lysine coating overnight humidified at 4 °C. Coverslips were then washed twice with PBS before permeabilizing with 0.1% Triton X-100 in PBS for 15 minutes at room temperature. After washing four times with PBS, cells were blocked with 5% goat serum in PBS with 0.05% Tween-20 (PBST) for 30 minutes. Coverslips were then incubated with primary antibody (anti- mTOR 1:200; anti-LAMP2, Abcam 13524, 1:200) overnight humidified at 4 °C. Coverslips were then washed five times with PBST and incubated with Alexa Fluor goat secondary antibodies (anti-rabbit 488 and anti-rat 555, 1:500) for 90 minutes at room temperature. Following five washes with PBST, cells were stained with DAPI as above. Coverslips were then washed three times with PBS and mounted in Fluoromount-G and sealed as above.
Live-cell imaging
Transient transfection of LAMP1 fusion proteins
200,00–215,000 U2OS Arntl::dLUC cells were plated in plastic or glass-bottom 35mm culture dishes in normal DMEM in 5% CO2. The following day, cells were transfected with 0.5–1.0 ug of LAMP1-FLAG(x2)-mRFP (gift from David Sabatini, Addgene plasmid #34611) or LAMP1-mGFP (gift from Esteban Dell’Angelica, Addgene plasmid #34831. mGFP is a non-dimerizing GFP variant that reduces aberrant aggregation of overexpressed protein). 48–96 hours later, media was exchanged for media of pH 7.4 or 6.3 and plates were moved to atmospheric CO2. After 2.5–4 hours incubation (as indicated in legends), cells were imaged as described below. For the timecourses of ciliobrevin D and nocodazole treatments (Figures 6N, S6I, S6L, S6M), the day following transfection cells were instead trypsinized and reseeded at lower density (75,000 cells/plate). Two days later, cells were treated with 60 uM ciliobrevin D or 2 uM nocodazole and imaged at intervals as indicated in figures.
LysoTracker and TubulinTracker
30 minutes prior to imaging, media was exchanged for fresh media with 50 nM LysoTracker Deep Red (Invitrogen) and 500 nM TubulinTracker Green (Oregon Green 488 Taxol bis-acetate, Invitrogen). Cells were then washed three times with media and then imaged in media. For cells treated with vehicle or inhibitor (nocodazole, ciliobrevin D), media both during the 30 min staining and during imaging contained vehicle or drug. When only LysoTracker was used, media was changed after staining but washes were omitted.
Microscopy and image processing
Images of immunofluorescence staining of U2OS cells were acquired using Dapi, GFP, and DsRed filter sets as needed on an upright Nikon Eclipse Ni microscope equipped with 20×/0.5 PlanFluor, 40×/0.75 PlanFluor, and 60×/0.95 Plan Apo A objectives and 12-bit QImaging QIClick CCD and DS-Fi2 Nikon cameras controlled by Nikon NIS-Elements Basic Research software or using Dapi, GFP, dsRed, mCherry/TxRed, and Cy5 filter sets as needed on a Nikon Eclipse 80i microscope using a 60× objective with a 0.63× c-mount and a QImaging camera controlled by Image-Pro Plus v 7.0 software. Live cell images were acquired with GFP, TxRed, Cy5 and phase contrast filter sets as needed on an Olympus IX81 inverted fluorescence microscope quipped with 10×, 20×, and 40× objectives (UPLFLN10X2PH, LUCPLFLN20XPH, LUCPLFLN40XPH) and a 12 bit CCD camera (Sensicam QE, PCO) controlled by SlideBook 6 software. All exposure times and other hardware settings were identical for all images captured in the same channel within an experiment. This includes Figure 7F where acquisition settings were identical for imaging of RHEB in both wild-type (U2OS Arntl::dLUC) and RHEBN153T- expressing cells. Scale bars are shown. Where not otherwise indicated, a scale bar shown in one image of a multi-image panel is applicable to all images.
Confocal microscopy images of immunofluorescence staining of CD8+ T cells were acquired as 2048 × 2048 pixel images on a Zeiss LSM 880 using excitation wavelengths of 405, 488, and 561 nm and a Plan-apochromat 63× 1.40 0.1 DIC M27 objective with zoom factor 1.0 controlled by ZEN v2.3 software. Scale bars are shown.
Fiji software was used for background subtraction (rolling ball method or subtraction of a constant as described below) and brightness (contrast) adjustment if needed. For immunofluorescence and LysoTracker and TubulinTracker live-cell imaging (i.e. methods labeling endogenous proteins and compartments), all processing (background subtraction, brightness adjustment) was uniform across all acquired images within that channel in that experiment. The only exception was DAPI staining which was occasionally independently contrasted for display purposes only (but quantified using raw or uniformly processed (background subtracted) images). For live-cell imaging of LAMP1-GFP and LAMP1-mRFP, images in the GFP and RFP channels, respectively, were contrasted individually owing to variability in transfection efficiency across the population of cells. For all microscopy, representative images of random fields acquired from at least three biological replicates are shown.
Image quantification
mTOR enrichment on lysosomes as a function of amino acids and pH was quantified from 40× widefield images of U2OS cells coimmunostained for mTOR and LAMP2 using a quantification method modified from that previously described (Wolfson et al., 2017). mTOR and LAMP2 channels were background corrected in Fiji by subtracting a constant equal to the mean of three regions of interest (ROIs) drawn within the image background of each channel. The borders of each cell or cell cluster were drawn by applying the Analyze Particle function to the thresholded mTOR channel image (settings: particles > 200 pixels2, exclude holes) and supplementing this with manual additions and subtractions as needed to define the “cell” ROI of each field. The LAMP2 channel images were then thresholded (same threshold across all images) to define the “lysosome” ROI within each field. The “lysosome” ROI was subtracted from the “cell” ROI of a field to define the “cytoplasm” ROI of each field. LAMP2 and mTOR mean fluorescence intensity (MFI) were then measured in each compartment. To calculate the relative enrichment of mTOR in the lysosomal compartment over the cytoplasm in each field, the MFI of mTOR in the cytoplasm ROI was subtracted from the MFI of mTOR in the lysosome ROI. The lysosomal LAMP2 MFI was similarly corrected for the background cytoplasmic MFI of that channel. The mTOR difference was then divided by the LAMP2 difference to account for varying amounts and densities of lysosomes across fields. Hence, the reported mTOR lysosomal enrichment score for each field (image) was (L - C)mTOR/(L - C)LAMP2 where L and C are the MFI of the respective channels in the lysosomal and cytoplasmic ROIs, respectively, as previously described (Wolfson et al., 2017). Prior to quantification, pixels containing rare obvious small processing artifacts were excluded across all channels when observed, although post hoc analysis revealed near identical results had this step been skipped. Replicates and statistics as described in legends.
mTOR lysosomal enrichment in CD8+ T cells was similarly quantified from 63× magnification confocal images. Background correction was omitted as background was confirmed negligible. Cells were outlined to define the “cell” ROI by using the analyze particle function on uniformly thresholded mTOR channel images (settings: particles >5 um2, include holes). Because the nucleus takes up a significant portion of the volume in T cells, the “nucleus” ROI was defined by applying the analyze particle function to thresholded DAPI channel images. The union of “nucleus” ROI and “lysosome” ROI (determined as above) was then subtracted from the “cell” ROI to determine the “cytoplasm” ROI for each field. The mTOR lysosomal enrichment score for each field was then calculated as (L - C)mTOR/(L - C)lamp2 as above, with replicates and statistics as described in legends.
Radial distributions of LAMP2, tubulin, and DAPI intensity were quantified in Fiji from 3-channel background corrected (rolling ball method or subtraction of a constant as above) 40× images of immunostained U2OS cells. Radial distributions of mTOR, LAMP1, RHEB, and DAPI were similarly quantified from 4-channel 60× (+0.63× c-mount) images. For each cell analyzed, the outline of the cell was manually delineated and all pixels outside this area were cleared in all channels to define the “cell” ROI. The nucleus was then defined with the aid of the Analyze Particle function (default settings) applied to the thresholded DAPI channel. This “nucleus” ROI was then subtracted from the “cell” ROI to define the “cytoplasm” ROI. The tubulin and LAMP2 intensities as a function of radial distance from the nucleus center were calculated within the “cytoplasm” ROI with the Radial Profile plugin for a circle centered on the nucleus with a 500- pixel (80.5 μm (40×) or 85 μm (60× + 0.63× c-mount)) radius (i.e. a circle encompassing the entire cell area). This plugin returned the intensities as a function of the radius (r) in 1.33-pixel (0.215 or 0.226 μm) steps (r = 1.33, 2.66, 3.99, ...500 pixels). Here, intensity is the integrated fluorescence around a circumference (defined by the radius) divided by that circumference. As these output intensities are not corrected for cell shape, the output intensities were multiplied by π2r (the circumference, giving integrated fluorescence) and divided by the arc length through the “cytoplasm ROI” at that radius (calculated by running the plugin on an new image created with every background pixel 0 and every pixel within the “cytoplasm” ROI set to 1). DAPI radial distribution was similarly calculated over the “cell” ROI. For LAMP2, tubulin, and DAPI 3- channel images, 15 cells were analyzed for each pH condition and the mean profile was calculated. For display purposes, calculated mean intensities were normalized to the maximum mean value within that channel (irrespective of pH). Unadjusted t-tests (i.e. no multiple testing correction) were performed at each r comparing the intensity of a given channel at each pH. For each r for which p<0.05, an asterisk appears above the graph. For mTOR, LAMP1, RHEB, and DAPI 4-channel images, 10 cells were analyzed for each pH condition for U2OS Arntl::dLUC cells and 13 cells for each pH condition for U2OS Arntl::dLUC RHEBN153T cells. Mean profiles were calculated and normalized to the maximum mean value within that channel in U2OS Arntl::dLUC pH 7.4 cells.
Flow cytometry
T cell mTOR activity
Primary splenocytes were derived as above and resuspended in RPMI media of the corresponding pH as indicated in figure legends and formulated as described above. Splenocytes from mice with TSC2 −/− and TSC2 +/+ T cells were stimulated with 3 ug/mL crosslinked anti-CD3 and 2 ug/mL anti-CD28 (in-house hybridomas). After 1 hour, splenocytes were fixed with 2% PFA for 10 minutes at 37 °C then washed two times with PBS. Cells were then permeabilized with ice cold 90% methanol for 20 minutes at −20 °C, washed three times with 1% FBS/PBS (staining solution), and stained with brilliant violet 786-conjugated rat anti-CD4 (BD Bioscience, 1:500), brilliant violet 650-conjugated rat anti-CD8 (BD Bioscience, 1:500), and anti- phospho serine 240/244 S6 (1:1000) in staining solution for 45 minutes at room temperature. Cells were then washed two times with staining solution before staining with goat anti-rabbit IgG Alexa Fluor 647 (Invitrogen A21244, 1:500) for 30 minutes at room temperature. Cells were then washed two times before analysis with BD Celesta and FlowJo software. Gates were set appropriately with the aid of unstimulated and secondary-alone controls.
Cytomegalovirus infection
Human cytomegalovirus (HCMV) preparation and infection proceeded as previously described (Clippinger et al., 2011). The virus used was a derivative of the Towne strain of HCMV in which some nonessential genes have been replaced with GFP expressed by the SV40 promoter (Clippinger et al., 2011). 150,000 U2OS Arntl::dLUC cells were seeded in 35 mm dishes. Three days later, one plate was trypsinized to determine the number of cells. An aliquot of previously titered human cytomegalovirus was thawed, sonicated on low power, and added to standard culture media (DMEM, 5% CO2) that was then applied to cells at a multiplicity of infection of 3. Media without virus was similarly used to refresh plates of “mock infected” cells. After two hours, media was aspirated and replaced with fresh DMEM. This was considered time zero of infection. At 19 hours post infection (hpi), media of two virus- and two mock-infected plates was exchanged for low buffer media containing vehicle or 500 uM DMOG and moved to atmospheric CO2. At 26 hpi, media of an additional two virus- and two mock-infected plates was exchanged for media of pH 7.4 or pH 6.3 and moved to atmospheric conditions. Protein was then harvested from all 8 plates one hour later (at 27 hpi). These media exchanges were repeated once more for an additional time point, with vehicle/DMOG treatment beginning at 47 hpi, pH 7.4/6.3 at 58 hpi, and protein harvest at 59 hours. Consequently, the first immunoblot time point (27 hpi) reflects 8 hours of vehicle/DMOG or 1 h of neutral/acidic pH treatment, while the second time point (59 hpi) reflects 12 hours of vehicle/DMOG or 1 h of neutral/acidic pH treatment. To confirm infection, two immediate-early viral proteins, immediate-early protein 72 (IE72) and immediate-early protein 86 (IE87), were probed with an antibody recognizing major immediate- early viral proteins containing viral exon 2 and 3 regions (Clippinger et al., 2011).
Bicarbonate treatment of tumors
Tumor tissue specimens were obtained from two previously conducted studies (Estrella et al., 2013; Ibrahim-Hashim et al., 2017) in which the drinking water of mice bearing xenograft tumors was either supplemented with bicarbonate to raise intratumoral pH or not supplemented (“tap” water). These tissues were then queried for the current study for the impact of bicarbonate therapy on tumor mTORC1 signaling. In detail:
Cell Culture
The human breast cancer cell lines MCF7 and MDA-MB-231 and the human colon cancer cell line HCT116 were acquired from the American Type Culture Collection (ATCC, Manassas, VA). MCF7 and MDA-MB-231 cell lines were maintained in RPMI medium 1640 (Gibco) supplemented with 10% FBS (Hyclone) and 1× penicillin/streptomycin. HCT116 cells were maintained in DMEM/F12 (Gibco) supplemented with 10% newborn calf serum and 1× penicillin/streptomycin. Medias were further supplemented with 0.75 mg/mL of G418 to maintain stable polyclonal expression of previously transfected pIRES2-EGFP (MCF7), pDsRed2-N1 (MDA-MB-231), and pcDNA3-GFP (HCT116) for in vivo tumor border demarcation. During in vitro HCT116 experiments, G418 selection was not maintained. All cells were maintained in standard humidified tissue culture incubators at 37 °C with 5% CO2 and manipulated under sterile conditions in a tissue culture hood. All three cell lines were authenticated by short tandem repeat analysis and confirmed to be free of mycoplasma.
Tumor development and bicarbonate treatment
All animals were maintained in accordance with the guidelines of the Institutional Animal Care and Use Committee (IACUC) at H. Lee Moffitt Cancer Center. Eight- to ten-week-old male and female (randomized) severe combined immunodeficient (SCID) mice (Charles River) were used to host HCT116 tumors. Eight- to ten-week-old female nu/nu mice (Envigo) were used to host MDA-MB-231 and MCF7 tumors.
HCT 116 cells were implanted into a dorsal window chamber using the tumor droplet method as described previously (Estrella et al., 2013). Briefly, a dorsal window chamber was implanted into a host mouse. The following day, HCT 116 cells were suspended in 0.8 mg/ml of type I collagen (BD Bioscience) and 1× DMEM at a final concentration of 2.5×10⁶ cells/mL.15 uL of the tumor suspension was then polymerized in the center of a well of a 48-well non-tissue culture-treated multiwall plate. After polymerizing for 20–30 min at 37 °C, the droplet was surrounded by a layer of 1.25 mg/mL type I collagen, which encouraged the tumor to maintain a circular shape with well-defined borders. After polymerizing for 20–30 min at 37 °C, the construct was incubated with 200 uL of DMEM with 10% FBS at 37 °C. After 2 days of culture, the constructs were aseptically inoculated into the window chamber. Six days prior to the inoculation of tumor constructs into the dorsal window chamber, mice were randomly assigned to receive 200 mM sodium bicarbonate (n=4) (Fisher Scientific) or tap water (n=4) provided ad libitum for the duration of the experiment. Treatment continued for up to three weeks with tumors harvested when they reached the capacity of the window chamber.
For MDA-MB-231 and MCF7 tumor formation, 10 million cells were injected into cleared mammary fat pads as described previously (Ibrahim-Hashim et al., 2017). One week prior to cell injection, an estrogen pellet (0.72 mg slow release, Innovative Research of America) was implanted to allow growth of ER-positive MCF7 tumors. Three days after tumor injection the mice were randomly assigned to drinking water supplemented with 400 mM sodium bicarbonate or tap water (n=5 each arm for MCF7; n=4 each arm for MDA-MB-231) provided ad libitum for the duration of the experiment. Five weeks later, tumors were harvested.
Immunohistochemistry (IHC)
At endpoints of the study, tumors were harvested, fixed in 10% neutral buffered formalin (Thermo Fisher Scientific), processed, embedded in paraffin, and sliced to 4–5 μm sections. Slides were stained with hematoxylin and eosin (H&E) stain.
Immunohistochemistry for phospho-S6 was performed using the Leica BOND RX stainer as per the manufacturer’s protocol with ancillary reagents. Briefly, slides were deparaffinized with Dewax solution and antigens heat-retrieved in the ER2 buffer (AR9640). Rabbit primary antibody that reacts to pS6 (Ser240/Ser244, ThermoFisher Scientific) was used at a 1:200 concentration for 15 min. The Bond Polymer Refine Red Detection system with alkaline phosphatase-linked polymers and red chromagen (Fast Red) was used to detect primary antibody with subsequent hematoxylin counterstain. Slides were then dehydrated and coverslipped as per normal laboratory protocol. Histology slides were scanned using the Aperio™ ScanScope XT (Leica) with a 20×/0.8NA objective lens (200×) at a rate of 2 minutes per slide via Basler tri-linear-array.
Image analysis
An Aperio Positive Pixel Count® v9.0 algorithm with the following thresholds: [Hue Value =.1; Hue Width =.5; Color Saturation Threshold =0.04; IWP(High) = 220; Iwp(Low)=Ip(High) = 175; Ip(low) =Isp(High) =100; Isp(Low) =0] was used to categorize inverted image pixels across the entire tumor cross section as negative (>220), weakly positive (175–220), positive (100–175), and strongly positive (0–100) which were then pseudocolored as displayed in figures (“positivity mask”). The percentage of positive pixels (sum of weakly positive, positive, and strongly positive divided by total pixels) in the applicable viable tumor area (designated by excluding necrotic volumes identified on H&E images) was then calculated. Scale bars are shown.
In vitro corollary
HCT116 GFP cells discussed above and MCF7 cells separately purchased from ATCC (not transfected with fluorescent reporter and maintained in DMEM with 10% FBS and 1× penicillin/streptomycin) were used for in vitro experiments paralleling the above in vivo queries. 450,000 HCT116 cells were seeded in 35 mm dishes and allowed to expand for 3 days in normal culture conditions (DMEM/F12 supplemented with 10% newborn calf serum in standard 5% CO2 incubators). Media was then changed to DMEM medias as used for U2OS experiments (defined in detail above): low buffer with DMSO (vehicle), low buffer with 1 mM DMOG, high buffer with DMSO, high buffer with 1 mM DMOG, or PIPES/HEPES buffered DMEM preadjusted to six different pH values (pH 7.4, 7.0, 6.8, 6.6, 6.5, and 6.3). Plates with highly buffered media continued in 5% CO2 incubators. All other plates were moved to humidified incubators with atmospheric CO2. Protein was harvested for western blots and media pH was assessed at the indicated time points. MCF7 cells were split into 35 mm dishes, allowed to expand for several days until confluent, and then treated with the same media and DMOG conditions as with HCT116 cells with time points as indicated.
Quantification and Statistical Analysis
Statistical details of experiments, including the number of biological replicates, are as described in legends and above. Pooled data are presented as the mean plus standard error of the mean (SEM) or standard deviation (SD) of biological replicates as indicated in legends and calculated by Microsoft Excel or GraphPad Prism. In rare instances of error bars representing variation among technical replicates (Figures S1E, S1K, S7F), this is indicated in legend. For continuous luminometer readings of cells expressing luciferase-based reporters presented as the mean of biological replicates (e.g. Figure 1J), most error bars have been removed to enhance readability of figures; however, to give a sense of the typical variation among replicates with this technique, SEM error bars have been retained for randomly selected ). For analysis of the RNA-sequencing timecourses, statistical criteria for designation as circadian and enriched ontology calls are described above. Other tests for statistical significance, including t-tests, ANOVA, and post-hoc tests are described in figure legends. When tests that correct for multiple comparisons are employed, adjusted p-values are presented. Referenced biological replicates in some instances encompass experiments with minor alterations of procedure (e.g. modified drug concentrations, modified timings of exposures and sampling, immunoblot assessment of alternate proteins within the pathway or network, etc.) intended to verify robustness of result and independence from technical artifacts.
Data and Software Availability
Raw and processed RNA-seq data from this study have been submitted to NCBI Gene Expression Omnibus (GEO; http://www.ncbi.nlm.nih.gov/geo/) under accession number GSE101988.
Supplementary Material
A. Luciferase activity of lysate collected periodically from U2OS Arntl::dLUC cells synchronized (with dexamethasone and media change) and grown in normoxia or hypoxia (1% O2, media predeoxygenated) for up to 57 hours. After 33 hours some cells were removed from hypoxia and their media exchanged for normoxic media. Luminescence plotted as relative light units (RLU). Representative experiment of 2. B. Real-time luminescence monitoring of U2OS Arntl::dLUC cells synchronized and treated with 18.75 uM desferrioxamine (DFX). After 4.7 days, DFX-containing media was exchanged for fresh media. Representative experiment of >5. C./D. Luciferase activity of lysate and luminescence of live cells immediately prior to lysate harvest of U2OS Arntl::dLUC cells synchronized and treated with 1mM DMOG or vehicle for up to 3.5 days in low (C) or high (D) buffer media. Data presented as mean of cells plated in triplicate ± standard error of the mean (SEM). Representative experiments of two each with biological triplicates. E. Upper panel: Luciferase activity of lysate collected periodically from U2OS Arntl::dLUC cells synchronized and grown in normoxic high buffer or hypoxic (1% O2, media pre-deoxygenated) low or high buffer conditions for up to 51 hours. After 29 hours some cells were removed from hypoxia and their media exchanged for normoxic high buffer media. Data presented as mean of technical duplicates ± standard deviation (SD) (but error bars generally too small to see). Representative experiment of 2. Lower panel: pH of media across timecourse. F. Real-time luminescence monitoring of U2OS Arntl::dLUC cells synchronized and grown in media of initial pH of 7.5, 7.0, 6.5, and 6.3. Representative experiment of 2 each with 1–2 biological replicates. Note the data shown for pH 6.3 appear also in Figure 1I as the data were divided between these figures for clarity. G. Real-time luminescence monitoring of U2OS cells stably expressing a hypoxia response element (HRE) reporter derived from the HRE of PGK1 (PGK1-HRE::dLUC) synchronized and treated with media pH 7.4 or 6.3 or 300 uM DMOG or vehicle in low buffer conditions. Data presented as the mean of cells plated in triplicate with SEM error bars. H. Expression of the hypoxia inducible factor (HIF)-responsive genes lactate dehydrogenase A (LDHA), phosphoglycerate kinase 1 (PGK1), solute carrier family 2 member 1 (SLC2A1, GLUT1), and vascular endothelial growth factor A (VEGFA) in U2OS Arntl::dLUC cells in acidic (pH 6.3) and neutral (pH 7.4) media over a 52-hour timecourse as determined by RNA-sequencing (RNA-seq) of RNA collected every 4 hours. Reported as fragments per kilobase of transcript per million mapped reads (FPKM). I. Immunoblot for HIFIα using lysate collected periodically from U2OS Arntl::dLUC cells treated with 1 mM DMOG in low or high buffer media or media of pH 7.4 or 6.3 (in parallel to Figures 2B-D). J. Real-time luminescence monitoring of U2OS cells stably expressing PGK1-HRE::dLUC or a reporter derived from the HRE of VEGF (VEGF-HRE::dLUC) synchronized and treated with 1mM DMOG or vehicle in low or high buffer media. Data presented as mean of ≥2 plates with SEM error bars. Representative experiment of ≥2 per reporter. K. Relative expression of HIFα subunits (upper) and HIF-responsive genes (lower) in U2OS Arntl::dLUC cells following treatment with non-targeting control (siCtl) siRNA or siRNA against both HIF1α subunits (HIF1A, EPAS1) prior to synchronization and DMOG (787.5 uM) treatment as in Figures 1E and IH. 10 nM siRNA each condition (5 nM each when two siRNA). qPCR of RNA collected 14 hours after DMOG or vehicle treatment, with expression normalized to respective target expression in the siCtl vehicle condition. Data presented as mean of technical triplicates ± SEM. T-tests of individual genes (unpaired, two-tailed, unequal variance), **p<0.01 each. L. Expression of genes encoding HIFα subunits in U2OS Arntl::dLUC cells after 4 hours in media of pH 7.4 as determined by RNA-seq.
A. Expression of the HIF-responsive gene pyruvate dehydrogenase kinase (PDK1) during the timecourses shown in Figures 2B-D as well as in a similar timecourse obtained in hypoxia (S2F, described below) as determined by qPCR and normalized to the respective control (e.g. vehicle, pH 7.4, normoxia) 4 h time point. B. Real-time luminescence monitoring of U2OS Arntl::dLUC cells treated in parallel to the endogenous RNA timecourses in Figures 2B-D. Mean of cells plated in triplicate or duplicate with SEM error bars. Data from the hypoxic timecourse shown in Figure S1E are also shown again here for completeness of comparisons. C. Endogenous ARNTL expression (previously depicted in Figures 2B-D or appearing in Figure S2F) is shown to highlight that the luciferase reporter shown in B closely mirrors these endogenous transcript levels. D. Media pH over the same timecourses as C (and Figures 2B-D). E. Scatterplot of normalized fast Fourier transform (FFT) peak (descriptive parameter of variance of periodic data indicative of strength of rhythmicity) vs. period for individual cells analyzed by single-cell luminescence imaging (n= 30, 29, 25 for pH 7.4, 6.8, 6.3, respectively). Cells above the annotated FFT=0.07 threshold were scored rhythmic as cells with a period (T) clearly outside the circadian range (T <15 h, T > 35 h) tended to have a FFT peak value < 0.07. Cells with FFT peak < 0.07 were scored arrhythmic. Percent rhythmic cells reported in Figure 2A is the percent of cells analyzed with FFT peak > 0.07. See Methods. F. Expression of constituents of the endogenous core clock over a 52-hour timecourse in U2OS Arntl::dLUC cells synchronized and grown in normoxic high buffer or hypoxic (1% O2, media pre-deoxygenated) low or high buffer conditions for 52 hours. Total RNA was collected every 4 hours and expression was assessed by qPCR and normalized to that at 4 h in normoxia. Media pH during this timecourse (shown also in D) shown here to highlight the correlation between acidification and suppression of circadian oscillation of transcripts. G. Expression of DEC1 (BHLHE40) and RORA during 1 mM DMOG treatment or upon exposure to acidic (pH 6.3) media relative to control (vehicle or pH 7.4) conditions at 4 or 8 hours after synchronization and exposure. Representative experiment of at least two independent experiments.
A. Expression of representative core clock genes over the 52-hour timecourse in pH 7.4 and 6.3 as determined by RNA-sequencing (RNA-seq) (left) versus real-time polymerase chain reaction (qPCR) (right, data also appear in 2D) or RNA collected as described in Figure 3A. RNA-seq reported as fragments per kilobase of transcript per million mapped reads (FPKM). B. Expression in pH 7.4 and 6.3 of the 86 protein-coding genes with statistically significant circadian oscillation in pH 6.3 (see Figure 3B) (p<0.05, false discovery rate (FDR) <0.2) ordered by pH 6.3 phase. Color scale as in Figure 3A. C. p-value statistic of test for circadian rhythmicity of expression (as in Figure 3A) for core and secondary feedback loop clock genes and representative clock paralogs (NPAS2) and output regulators (DBP, TEF) in pH 7.4 or 6.3. D. Most highly significant biological process ontologies represented in the 571 acid-induced and 859 acid-suppressed transcripts (defined in Figure 3E) with terms related to unfolded protein response, vesicle trafficking, DNA repair, and cell cycle colored as shown. p<0.05 above the dashed line. For pH 6.3, all ontologies with B&H q-value<0.05 shown; for pH 7.4, the top 10 ontologies are shown (q<1×10⁻⁵).
A. Representative standard curve and linear best-fit equation relating the ratiometric signal of the cytoplasmic pH probe mCherry-SEpHluorin to intracellular pH (pHi) generated by incubating U2OS cells stably expressing the construct in media of pH 6.0–8.0 containing ionophores that cause pHi to equilibrate with extracellular pH (pHe). Reporter is a fusion of pH-insensitive mCherry and pH-sensitive GFP (SuperEcliptic (SE) pHluorin). Data presented as mean ±standard deviation (SD) of the ratios of the intensities of the SEpHluorin and mCherry signals across an entire 10× field for three or more fields per pH standard. Representative experiment of >6. B. Representative 10x fields used upon which A was generated. C. Representative 10x fields upon which Figure 4A was generated. D. Real-time luminescence monitoring of U2OS Arntl::dLUC cells synchronized and treated with vehicle or 200 uM amiloride (left) or 250 uM α- cyano-4-hydroxycinnamate (αCHC) (right). At the indicated times, treatment was washed out by media change. Representative experiments of ≥3. E. Timecourse of pHi of U2OS cells over three days of treatment with vehicle, 500 uM DMOG, 200 uM amiloride or 250 uM αCHC. Day 1 pHe also indicated for reference (orange line). pHi ± SD derived from three or more 10x fields as in A. Student’s T-tests (unpaired, two-tailed, equal variances) comparing treatment to vehicle at same time point. *p≤0.05, **p≤0.01, ***p≤0.001, ****p≤0.0001, ns = p>0.05. Representative experiment of 3. F. Immunoblots for CLOCK using lysate collected in Figures 4C and4D. Tubulin loading controls shared with Figures 4C and 4F. G. Immunoblots for HIFIα and the indicated mTORC1-signaling components using lysate collected from U2OS cells every 4 hours for 48 hours after synchronization and treatment with vehicle or 300 uM DMOG in low buffer media. Ser209 (EIF4E). H. Real-time luminescence monitoring of U2OS Arntl::dLUC cells treated in parallel to the timecourse in G. Representative of 2. I. Media pH during G. J. Immunoblot for phosphorylation of Thr56 of eEF2 using U2OS cell lysate collected 8 hours after synchronization and placement in normoxia or hypoxia (1% O2, media pre-deoxygenated), or treatment with vehicle or 300 uM DMOG in low or high buffer media, or exposure to media of pH 7.4 or 6.3. Tubulin control shared with blots in Figure 4H. K. Real-time luminescence monitoring of U2OS Arntl::dLUC cells synchronized and treated with vehicle or 300 uM DMOG and 0–100 uM A-484954 (eEF2K inhibitor) in low buffer media. Mean of triplicates. Similar results seen with A-484954 treatment of cells in media of pH 7.4 and 6.3 (not shown). L. Immunoblots for the indicated mTORC1 signaling or clock components using lysate collected periodically from 293T (left) or synchronized MDA-MB-231 cells (right) treated with 500 (293T) or 500 and 1000 (MDA- MB-231) uM DMOG in low buffer conditions or exposed to acidic media. Representative experiment of ≥3 each condition. Vehicle control in high (293T) or low (MDA-MB-231) buffer media. Bottom panel indicates media pH at the time of lysate collection in 293T cells. M. Immunoblot for mTORC1 signaling using lysate collected from U2OS cells after 1 and 27 hours of treatment with vehicle or 1–1000 nM Torin2. All lanes from same gel with intervening lanes cropped for space. N. Real-time luminescence monitoring of U2OS Arntl::dLUC cells synchronized and treated with vehicle or 100 nM Torin2. Mean plus SEM of cells plated in triplicate. Representative experiment of 2. O. Normalized ratio of the background-corrected intensities of p4EBP1 to total 4EBP1 at 27 hours (quantified from M) and the average amplitude (plus SEM) over 4 days (beginning 1 day after synchronization and based upon the mean profile of biological triplicates as in N) both as a function of Torin2 dose. Y-axis scaled as log([Torin]+1). P. Immunoblots for mTORC1 signaling using lysate collected periodically over 2 days from U2OS cells synchronized and either left untreated or treated with 0.4% of the primary alcohol n-butanol to deplete phosphatidic acid or control treated with the non-phosphatidyl-reactive tertiary alcohol tert-butanol (see Methods). Q. Real-time luminescence monitoring of U2OS Arntl::dLUC cells treated in parallel to P. Representative experiment of 4 each with 1–3 biological replicates and with additional arms revealing dose-dependent effects of 0.2–0.6% n-butanol treatment. R. Immunoblots (left) for mTORC1 signaling using lysate collected from synchronized U2OS cells after treatment with vehicle or 5–30 nM rapamycin for 1, 6, 27, or 46 hours in two independent experiments. Right: Real-time luminescence monitoring of U2OS Arntl::dLUC cells synchronized and treated with vehicle or 5–30 nM rapamycin. Mean of cells plated in triplicate. S. Immunoblots for HIFIα and indicated clock network proteins (left) or 4EBP1 (right) using lysate collected from unsynchronized (no dexamethasone) Arntl::dLUC EIF4EBP1 (4EBP1) CRISPR knockout or parental Arntl::dLUC U2OS cells after 1 or 16 hours of exposure to media of pH 7.4 or 6.3 or treatment with vehicle or 500 uM DMOG in low buffer media. Black rectangles enclose immunoblots from same gel. Yellow lines for readability only.
A. Immunoblot for mTORC1 signaling using lysate collected from U2OS cells treated with 5 nM non-targeting control (siCtl) siRNA or siRNA against transcripts encoding leucine-sensing Sestrins (SESN1, SESN2) or the non-leucine sensing SESN3 prior to synchronization and treatment with vehicle or 500 uM DMOG in low buffer media for 20 hours. 2.5 nM siRNA each when two oligos used. B. Real-time luminescence monitoring of Amtl::dLUC U2OS cells treated with 2 nM non-targeting control (siCtl) siRNA or siRNA against SESN1 or SESN3 prior to synchronization and treatment with 500 uM DMOG in low buffer media. Representative experiment of ≥4 with 1–3 biological replicates per condition. C. Immunoblot for Sestrin-2 following immunoprecipitation of FLAG-tagged proteins from lysate collected from 293T cells stably expressing Flag-tagged Rap2A (control protein) or WDR24 (a component of the GATOR2 complex) and near-starved of all amino acids (AA) or leucine (L) for 50 minutes (pH 7.4) prior to rescue with AA/L or continued starvation for 10 minutes. Lysate was additionally immunoblotted for components of mTORC1 signaling. (Starvation media base contained no AA/L but was supplemented with 5% undialyzed serum.) Note Ig heavy chain runs just below Sestrin-2. D. Immunoblots of immunoprecipitated proteins and lysate as in C using lysate collected from Flag- WDR24 293T cells near-starved of leucine for 50 min in pH 7.4 or 6.3 prior to 10 minutes of leucine rescue or continued starvation (in same pH). An additional independent experiment generated similar results after 14 hours of acid exposure. E. Immunoblot for mTORC1 signaling using lysate collected from wild-type or SESN triple knockout (SESN TKO, where all three SESN genes have been silenced by CRISPR editing) 293T cells after exposure to media of pH 7.4 or 6.6 for 50 minutes or treatment with vehicle or 1mM DMOG in low buffer media for 6 hours. F. Immunoblot for mTORCI signaling using lysate collected from wild-type (+/+) or TSC2 null (−/−) mouse embryonic fibroblasts (MEFS) (both p53 null) after 8 hours of exposure to normoxic or hypoxic (1% O2, pre-deoxygenated media) low or high buffer media or media of pH 7.4 or 6.3. Unrelated intervening lanes cropped. G. Immunoblot for mTORCI signaling using lysate collected from U2OS cells treated with 10 nM non-targeting, EIF4EBP, or TSC2 siRNA prior to treatment with vehicle or 300 uM DMOG treatment in low buffer media for 14 hours. H. Real-time luminescence monitoring of the Amtl/.dLUC reporter monitored continuously in parallel to Figure 5F. Mean of biological duplicates. Representative experiment of 3 each with 2–3 biological replicates. I./J. Immunoblots for phosphorylated (Thr172) and total AMPK using lysate collected every 4 hours for 48 hours from synchronized U2OS cells in normoxic high buffer or hypoxic low buffer media (I) or in media of pH 7.4 or 6.5 (J). AMP-activated protein kinase (AMPK) was inactivated (dephosphorylated) in acidic conditions. Two additional independent experiments encompassing 8, 19, 37, 49, and 66-hour time points confirmed reduced pAMPK in pH 6.5 or DMOG low buffer conditions. K/L. Immunoblots for phosphorylated cRaf (Ser338), ERK (Thr202/Tyr204), and GSK3β (Ser9) using lysate collected every 4 hours for 48 hours from synchronized U2OS cells treated with vehicle or 300 uM DMOG in low buffer media (K) or in media of pH 7.4 or 6.5 (L). Although phosphorylation of c-Raf was suppressed in DMOG treatment, the downstream extracellular signal-regulated kinase (ERK/MAPK) was not suppressed in either DMOG or acidic media. Dephosphorylation indicative of activation of glycogen synthase kinase 3 beta (GSK3B), a TSC2-activating kinase, was unapparent in acidic conditions (L). M. Expression of DDIT4 (REDD1) in media of pH 6.3 and 7.4 over a 52-hour timecourse as determined by RNA-seq of RNA collected every 4 hours. Reported as FPKM as in S1H. Note REDD2 (DDIT4L) was not expressed (undetectable by RNA-seq). N/O. Immunoblots for REDD1 using lysate collected every 4 hours for 48 hours from synchronized U2OS cells treated with vehicle or 300 uM DMOG in low buffer media or in media of pH 7.4 or 6.5 (N). Additional immunoblots from an independent experiment using lysate collected at three time points following treatment with vehicle or 500 uM DMOG in low or high buffer media or exposure to media of pH 7.4 or 6.5 (O). Unrelated intervening lanes cropped. Tubulin loading controls in I-L and N shared with corresponding membranes in Figures 4C-D, 4F, S4G, S7O.
A. U2OS cells immunostained for lysosomal protein LAMP2 imaged at lower magnification. Independent replicate experiment of that shown in Figure 6A. B. U2OS cells coimmunostained with LAMP2 and mTOR. Cells were starved of amino acids for 140 min followed by rescue (+AA) or not (-AA) with amino acids for 10 min before processing and imaging. Independent experiment from that shown in Figure 6C. C. Live imaging of U2OS cells transiently expressing lysosomal protein LAMP1 fused to green fluorescent protein after incubation in media of pH 7.4 or 6.3 for 2.5 hours. Lower panels: merged GFP (pseudocolored red for better visibility) and phase-contrast images. (Heterogeneity in LAMP1 expression owing to variable transfection efficiency). Independent replicate experiment of that shown in Figure 6F using different LAMP1- fusion construct. D. U2OS cells coimmunostained for LAMP2 and filamentous (F-) (polymerized) actin following exposure to media of pH 7.4 or 6.3 for 2.25 hours. E. U2OS cells coimmunostained for LAMP2, alpha-tubulin, and DAPI (nuclear stain) following exposure to media of pH 7.4 or 6.3 for 2.75 hours. Quantified in Figure 6I. Independent replicate experiment from that shown in Figure 6G. F. U2OS cells coimmunostained for LAMP2 and mTOR following incubation in media of pH 7.4 or 6.3 for 2.25 hours. Independent experiment from that shown in Figure 6J. G. U2OS cells coimmunostained for LAMP2 and mTOR following incubation in media of pH 6.3 for 120 min. Enlarged to highlight colocalization of LAMP2 and mTOR. Independent replicate experiment of that shown in F. H. U2OS cells coimmunostained for LAMP2 and mTOR following incubation in media of the first indicated pH for 105 min followed by 30 min in media of the second indicated pH. I. Live imaging of U2OS cells expressing LAMP1 fused to GFP after treatment with vehicle or 60 uM ciliobrevin D for 55 min, 90 min, and 9 hours. Images on right at each time point show merged GFP and phase-contrast images. Additional fields and time point of Figure 6N. J. Live imaging of U2OS cells treated with vehicle or 2 uM nocodazole (tubulin depolymerizing agent) for 6.5 hours. Lysosomes and polymerized tubulin labeled with the acidophilic dye LysoTracker (L) and TubulinTracker (T), respectively, prior to imaging. K. Immunoblot for mTORC1 signaling using lysate collected from unsynchronized U2OS cells over an 8-hour timecourse during treatment with vehicle or 2 uM nocodazole. Representative experiment of 3. L. Live imaging of U2OS cells expressing LAMP1 fused to GFP after treatment with vehicle or 2 uM nocodazole for 25 min, 75 min, and 6 hours. M. Live imaging of U2OS cells expressing LAMP1 fused to GFP after treatment with vehicle or 2 uM nocodazole for 7 hours showing initiation of lysosome reclustering. Lysosomes labeled with LysoTracker prior to imaging to highlight colocalization of signal from both lysosome-labeling techniques for the subset of cells expressing LAMP1-GFP. (Heterogeneity in LAMP1 expression owing to variable transfection efficiency.) N. Immunoblot for mTORC1 signaling using lysate collected from unsynchronized U2OS cells after 4 and 30 hours of treatment with vehicle (veh.), 60 uM ciliobrevin D (CbD), or 2 uM nocodazole (Noc.). Representative fields of multiple fields acquired from each of ≥3 biological replicates. Images visualizing endogenous proteins/lysosomes contrasted uniformly (see Methods).
A. Expression of kinesin family members (n=46) in U2OS cells as determined by RNA-seq. Log2 of the mean fragments per kilobase of transcript per million mapped reads (FPKM) determined every 4 hours for 52 hours (13 time points) after exposure to media of pH 7.4 or 6.3. Ranked by mean expression in pH 6.3. B. Expression of the 6 most abundant kinesins as determined in A.C. Previously activated OVA-specific CD8+ T cells (OT-1, see Methods) coimmunostained for LAMP2, mTOR, and DAPI following starvation of amino acids and growth factors for 1 hour (neutral pH) prior to continued starvation for 30 minutes or rescue with replete media (full amino acids and serum) of pH 7.6, 7.2, 6.5, or 6.2 for 60 minutes. Images of staining of endogenous proteins contrasted uniformly (see Methods). D. Quantification of mTOR lysosomal enrichment in C. n = 5–7 fields each condition, encompassing 437, 293, 303, 243, and 393 total cells, respectively. Mean plus SEM superimposed by raw data. Ordinary 1-way ANOVA followed by Tukey method comparing all means. Rescue from starvation increases mTOR lysosomal enrichment. Increasing acidity of rescue media does not reduce mTOR lysosomal association. *p<0.05. E. U2OS cells coimmunostained for LAMP1 and RHEB after 2 days of treatment with non-targeting siRNA or siRNA targeting RHEB, RHEBL1, or both RHEB and RHEBL1 (10 nM each target, normalized to 20 nM with non-targeting siRNA where needed) to validate immunofluorescence specificity of the anti-RHEB antibody. RE of >3. F/G. qPCR (F) and immunoblot (G) of RNA and protein collected in parallel to E to assess knockdown efficiency and accordance with an independent anti-RHEB antibody (Cell Signaling) (G). Mean±SEM of technical replicates in F. RE of 3 each. H. U2OS cells immunostained for LAMP1, mTOR, RHEB and nuclei (DAPI) after amino acid starvation for 155 minutes followed by 10 minutes of amino acid or mock rescue. RE of 3. I. Representative U2OS cell in media pH 7.4 immunostained for LAMP1, mTOR, RHEB, and nuclei (DAPI). Channel combinations as shown to highlight high coincidence of mTOR and LAMP1 staining consistent with localization of mTOR to lysosomes. Distinct patterning of RHEB suggests possible occupancy of a separate but spatially adjacent compartment. J. Immunoblots for mTORCI signaling using lysate collected from HCT116 cells exposed to media of the indicated pH or treated with vehicle or 1 mM DMOG in low or high buffer media for the durations indicated. RE of 2 each with 2 BR. K. Immunoblots of lysate from MCF7 cells as in J. L/M. Immunohistochemical pS6 staining of cross sections of MCF7 (L) and MDA-MB-231 (M) xenograft tumors carried by host mice drinking normal tap water or 400 mM sodium bicarbonate ad libitum from 3 days post tumor cell inoculation through tumor harvest (five weeks later). Representative high-power fields with inset low-power images of tumor cross section. Positivity mask in lower panels. Percent pS6 positive pixels quantified over entire viable area of tumor cross section. Mean±SD, n=5 mice (L) or 4 mice (M) for each arm. 2-tailed Student’s t-tests *p<0.05, ns=not significant N. Luminescence of RHEBN153T-overexpressing and control Arntl::dLUC U2OS cells treated with vehicle or 500 uM DMOG in low buffer conditions. Mean of 3 BR. RE of 4, 1–3 BR each. O. Immunoblot for phosphorylated and total eIF2α (Ser51) using lysate collected from U2OS cells every 4 hours for 48 hours after synchronization and treatment with vehicle or 300 uM DMOG in low buffer media (upper) or exposure to media of pH 7.4 or 6.5 (lower). Tubulin loading controls shared with Figures S4G and 4F. P. Model. Acid produced during hypoxic metabolic rewiring suppresses circadian clock oscillation through inhibition of mTORC1-governed translation as a consequence of centrifugal redistribution of lysosome-bound mTORC1. Orthogonal stress signaling pathways, such as that resulting in inhibitory phosphorylation of eIF2α, can likewise inhibit circadian clock oscillation by converging on a common mechanism of dampened cap-dependent translation. Q. Immunoblot for signaling downstream of PERK over a 3-day timecourse using lysate collected from RHEBN153T- overexpressing or control U2OS cells synchronized and treated with vehicle or 500 uM DMOG in low or high buffer conditions or exposed to media of pH 7.4 or 6.5. *non-specific artifact. Representative experiment of 4 with varying sampling intervals. RE= representative experiment. Biological replicates = BR.STAR Methods
Acknowledgments:
This work is supported by NIH/NCI grants F30CA200347, 5T32CA009140 (ZEW); R01CA051497, R01CA57341 (CVD); R01CA157846 (JCA); R01AI077610, R01AI091481 (JDP); R01 CA077575, U54 CA193489 (RG); P30CA010815, R01CA174746 (ATW); Veterans Affairs Merit Award I01 BX001146 (DKW); Patel Scholar Award (ZEW); Bloomberg-Kimmel Institute of Cancer Immunotherapy (JDP); and the Tissue Core Facility at the H. Lee Moffitt Cancer Center & Research Institute (P30-CA076292). We thank David Sabatini, Pedro Enriques-Navas, Veronica Estrella, Robert Gatenby, James Hayden, Frederick Keeney, Todd Ridky, John Hogenesch, Celeste Simon, Brian Keith and Dang lab members for their help.
Footnotes
Declaration of Interests:
The authors declare no competing interests.
References
- Adamovich Y, Ladeuix B, Golik M, Koeners MP, and Asher G (2017). Rhythmic Oxygen Levels Reset Circadian Clocks through HIFIalpha. Cell Metab 25, 93–101. [DOI] [PubMed] [Google Scholar]
- Altman BJ, Hsieh AL, Sengupta A, Krishnanaiah SY, Stine ZE, Walton ZE, Gouw AM, Venkataraman A, Li B, Goraksha-Hicks P, et al. (2015). MYC Disrupts the Circadian Clock and Metabolism in Cancer Cells. Cell Metab 22, 1009–1019. [DOI] [PMC free article] [PubMed] [Google Scholar]
- Balgi AD, Diering GH, Donohue E, Lam KK, Fonseca BD, Zimmerman C, Numata M, and Roberge M (2011). Regulation of mTORC1 signaling by pH. PLoS One 6, e21549. [DOI] [PMC free article] [PubMed] [Google Scholar]
- Boudreau A, Purkey HE, Hitz A, Robarge K, Peterson D, Labadie S, Kwong M, Hong R, Gao M, Del Nagro C, et al. (2016). Metabolic plasticity underpins innate and acquired resistance to LDHA inhibition. Nat Chem Biol 12, 779–786. [DOI] [PubMed] [Google Scholar]
- Cao R, Li A, Cho HY, Lee B, and Obrietan K (2010). Mammalian target of rapamycin signaling modulates photic entrainment of the suprachiasmatic circadian clock. J Neurosci 30, 6302–6314. [DOI] [PMC free article] [PubMed] [Google Scholar]
- Chambard JC, and Pouyssegur J (1986). Intracellular pH controls growth factor-induced ribosomal protein S6 phosphorylation and protein synthesis in the G0----G1 transition of fibroblasts. Exp Cell Res 164, 282–294. [DOI] [PubMed] [Google Scholar]
- Clippinger AJ, and Alwine JC (2012). Dynein mediates the localization and activation of mTOR in normal and human cytomegalovirus-infected cells. Genes Dev 26, 2015–2026. [DOI] [PMC free article] [PubMed] [Google Scholar]
- Clippinger AJ, Maguire TG, and Alwine JC (2011). Human cytomegalovirus infection maintains mTOR activity and its perinuclear localization during amino acid deprivation. J Virol 85, 9369–9376. [DOI] [PMC free article] [PubMed] [Google Scholar]
- Dibble CC, and Manning BD (2013). Signal integration by mTORC1 coordinates nutrient input with biosynthetic output. Nat Cell Biol 15, 555–564. [DOI] [PMC free article] [PubMed] [Google Scholar]
- Dibner C, and Schibler U (2015). Circadian timing of metabolism in animal models and humans. J Intern Med 277, 513–527. [DOI] [PubMed] [Google Scholar]
- Dmitriev AV, and Mangel SC (2001). Circadian clock regulation of pH in the rabbit retina. J Neurosci 21, 2897–2902. [DOI] [PMC free article] [PubMed] [Google Scholar]
- Estrella V, Chen T, Lloyd M, Wojtkowiak J, Cornnell HH, Ibrahim-Hashim A, Bailey K, Balagurunathan Y, Rothberg JM, Sloane BF, et al. (2013). Acidity generated by the tumor microenvironment drives local invasion. Cancer Res 73, 1524–1535. [DOI] [PMC free article] [PubMed] [Google Scholar]
- Fonseca BD, Diering GH, Bidinosti MA, Dalal K, Alain T, Balgi AD, Forestieri R, Nodwell M, Rajadurai CV, Gunaratnam C, et al. (2012). Structure-activity analysis of niclosamide reveals potential role for cytoplasmic pH in control of mammalian target of rapamycin complex 1 (mTORC1) signaling. J Biol Chem 287, 17530–17545. [DOI] [PMC free article] [PubMed] [Google Scholar]
- Gallagher FA, Kettunen MI, Day SE, Hu DE, Ardenkjaer-Larsen JH, Zandt R, Jensen PR, Karlsson M, Golman K, Lerche MH, et al. (2008). Magnetic resonance imaging of pH in vivo using hyperpolarized 13C-labelled bicarbonate. Nature 453, 940–943. [DOI] [PubMed] [Google Scholar]
- Gillies RJ, Raghunand N, Karczmar GS, and Bhujwalla ZM (2002). MRI of the tumor microenvironment. J Magn Reson Imaging 16, 430–450. [DOI] [PubMed] [Google Scholar]
- Hanker AB, Mitin N, Wilder RS, Henske EP, Tamanoi F, Cox AD, and Der CJ (2010). Differential requirement of CAAX-mediated posttranslational processing for Rheb localization and signaling. Oncogene 29, 380–391. [DOI] [PMC free article] [PubMed] [Google Scholar]
- Heuser J (1989). Changes in lysosome shape and distribution correlated with changes in cytoplasmic pH. J Cell Biol 108, 855–864. [DOI] [PMC free article] [PubMed] [Google Scholar]
- Ibrahim-Hashim A, Robertson-Tessi M, Enriquez-Navas PM, Damaghi M, Balagurunathan Y, Wojtkowiak JW, Russell S, Yoonseok K, Lloyd MC, Bui MM, et al. (2017). Defining Cancer Subpopulations by Adaptive Strategies Rather Than Molecular Properties Provides Novel Insights into Intratumoral Evolution. Cancer Res 77, 2242–2254. [DOI] [PMC free article] [PubMed] [Google Scholar]
- Johnson DE, Ostrowski P, Jaumouille V, and Grinstein S (2016). The position of lysosomes within the cell determines their luminal pH. J Cell Biol 212, 677–692. [DOI] [PMC free article] [PubMed] [Google Scholar]
- Jongsma ML, Berlin I, Wijdeven RH, Janssen L, Janssen GM, Garstka MA, Janssen H, Mensink M, van Veelen PA, Spaapen RM, et al. (2016). An ER-Associated Pathway Defines Endosomal Architecture for Controlled Cargo Transport. Cell 166, 152–166. [DOI] [PMC free article] [PubMed] [Google Scholar]
- Jouffe C, Cretenet G, Symul L, Martin E, Atger F, Naef F, and Gachon F (2013). The circadian clock coordinates ribosome biogenesis. PLoS Biol 11, e1001455. [DOI] [PMC free article] [PubMed] [Google Scholar]
- Koivusalo M, Welch C, Hayashi H, Scott CC, Kim M, Alexander T, Touret N, Hahn KM, and Grinstein S (2010). Amiloride inhibits macropinocytosis by lowering submembranous pH and preventing Rac1 and Cdc42 signaling. J Cell Biol 188, 547–563. [DOI] [PMC free article] [PubMed] [Google Scholar]
- Korolchuk V.l., Saiki S, Lichtenberg M, Siddiqi FH, Roberts EA, Imarisio S, Jahreiss L, Sarkar S, Futter M, Menzies FM, et al. (2011). Lysosomal positioning coordinates cellular nutrient responses. Nat Cell Biol 13, 453–460. [DOI] [PMC free article] [PubMed] [Google Scholar]
- Li X, Rydzewski N, Hider A, Zhang X, Yang J, Wang W, Gao Q, Cheng X, and Xu H(2016). A molecular mechanism to regulate lysosome motility for lysosome positioning and tubulation. Nat Cell Biol 18, 404–417. [DOI] [PMC free article] [PubMed] [Google Scholar]
- Lipton JO, Yuan ED, Boyle LM, Ebrahimi-Fakhari D, Kwiatkowski E, Nathan A, Guttler T, Davis F, Asara JM, and Sahin M (2015). The Circadian Protein BMAL1 Regulates Translation in Response to S6K1-Mediated Phosphorylation. Cell 161, 1138–1151. [DOI] [PMC free article] [PubMed] [Google Scholar]
- Manifava M, Smith M, Rotondo S, Walker S, Niewczas I, Zoncu R, Clark J, and Ktistakis NT (2016). Dynamics of mTORC1 activation in response to amino acids. Elife 5. [DOI] [PMC free article] [PubMed] [Google Scholar]
- McBrian MA, Behbahan IS, Ferrari R, Su T, Huang TW, Li K, Hong CS, Christofk HR, Vogelauer M, Seligson DB, et al. (2013). Histone acetylation regulates intracellular pH. Mol Cell 49, 310–321. [DOI] [PMC free article] [PubMed] [Google Scholar]
- Menon S, Dibble CC, Talbott G, Hoxhaj G, Valvezan AJ, Takahashi H, Cantley LC, and Manning BD (2014). Spatial control of the TSC complex integrates insulin and nutrient regulation of mTORC1 at the lysosome. Cell 156, 771–785. [DOI] [PMC free article] [PubMed] [Google Scholar]
- Mortola JP (2007). Hypoxia and circadian patterns. Respir Physiol Neurobiol 158, 274–279. [DOI] [PubMed] [Google Scholar]
- Peek CB, Levine DC, Cedernaes J, Taguchi A, Kobayashi Y, Tsai SJ, Bonar NA, McNulty MR, Ramsey KM, and Bass J (2017). Circadian Clock Interaction with HIF1alpha Mediates Oxygenic Metabolism and Anaerobic Glycolysis in Skeletal Muscle. Cell Metab 25, 86–92. [DOI] [PMC free article] [PubMed] [Google Scholar]
- Pollizzi KN, Patel CH, Sun IH, Oh MH, Waickman AT, Wen J, Delgoffe GM, and Powell JD (2015). mTORC1 and mTORC2 selectively regulate CD8(+) T cell differentiation. J Clin Invest 125, 2090–2108. [DOI] [PMC free article] [PubMed] [Google Scholar]
- Pouyssegur J, Franchi A, L’Allemain G, and Paris S (1985). Cytoplasmic pH, a key determinant of growth factor-induced DNA synthesis in quiescent fibroblasts. FEBS Lett 190, 115–119. [DOI] [PubMed] [Google Scholar]
- Raghunand N, He X, van Sluis R, Mahoney B, Baggett B, Taylor CW, Paine-Murrieta G, Roe D, Bhujwalla ZM, and Gillies RJ (1999). Enhancement of chemotherapy by manipulation of tumour pH. British journal of cancer 80, 1005–1011. [DOI] [PMC free article] [PubMed] [Google Scholar]
- Rainero E, Howe Jonathan D., Caswell Patrick T., Jamieson Nigel B., Anderson, Critchley David R., Machesky L, and Norman Jim C. (2015). Ligand-Occupied Integrin Internalization Links Nutrient Signaling to Invasive Migration. Cell Reports 10, 398–413. [DOI] [PubMed] [Google Scholar]
- Sancak Y, Bar-Peled L, Zoncu R, Markhard AL, Nada S, and Sabatini DM (2010). Ragulator-Rag complex targets mTORC1 to the lysosomal surface and is necessary for its activation by amino acids. Cell 141, 290–303. [DOI] [PMC free article] [PubMed] [Google Scholar]
- Saxton RA, Knockenhauer KE, Wolfson RL, Chantranupong L, Pacold ME, Wang T, Schwartz TU, and Sabatini DM (2016). Structural basis for leucine sensing by the Sestrin2- mTORC1 pathway. Science 351, 53–58. [DOI] [PMC free article] [PubMed] [Google Scholar]
- Saxton RA, and Sabatini DM (2017). mTOR Signaling in Growth, Metabolism, and Disease. Cell 168, 960–976. [DOI] [PMC free article] [PubMed] [Google Scholar]
- Semenza GL (2013). HIF-1 mediates metabolic responses to intratumoral hypoxia and oncogenic mutations. J Clin Invest 123, 3664–3671. [DOI] [PMC free article] [PubMed] [Google Scholar]
- Shalem O, Sanjana NE, Hartenian E, Shi X, Scott DA, Mikkelsen TS, Heckl D, Ebert BL, Root DE, Doench JG, et al. (2014). Genome-scale CRISPR-Cas9 knockout screening in human cells. Science 343, 84–87. [DOI] [PMC free article] [PubMed] [Google Scholar]
- Takahashi JS (2017). Transcriptional architecture of the mammalian circadian clock. Nat Rev Genet 18, 164–179. [DOI] [PMC free article] [PubMed] [Google Scholar]
- Toschi A, Lee E, Xu L, Garcia A, Gadir N, and Foster DA (2009). Regulation of mTORC1 and mTORC2 complex assembly by phosphatidic acid: competition with rapamycin. Mol Cell Biol 29, 1411–1420. [DOI] [PMC free article] [PubMed] [Google Scholar]
- Urano J, Comiso MJ, Guo L, Aspuria PJ, Deniskin R, Tabancay AP Jr., Kato-Stankiewicz J, and Tamanoi F (2005). Identification of novel single amino acid changes that result in hyperactivation of the unique GTPase, Rheb, in fission yeast. Mol Microbiol 58, 1074–1086. [DOI] [PubMed] [Google Scholar]
- Walton ZE, Altman BJ, Brooks RC, and Dang CV (2018). Circadian Clock’s Cancer Connections. Annual Review of Cancer Biology 2, 133–153. [Google Scholar]
- Welsh DK, Yoo SH, Liu AC, Takahashi JS, and Kay SA (2004). Bioluminescence imaging of individual fibroblasts reveals persistent, independently phased circadian rhythms of clock gene expression. Curr Biol 14, 2289–2295. [DOI] [PMC free article] [PubMed] [Google Scholar]
- Wolfson RL, Chantranupong L, Wyant GA, Gu X, Orozco JM, Shen K, Condon KJ, Petri S, Kedir J, Scaria SM, et al. (2017). KICSTOR recruits GATOR1 to the lysosome and is necessary for nutrients to regulate mTORC1. Nature 543, 438–442. [DOI] [PMC free article] [PubMed] [Google Scholar]
- Wolfson RL, and Sabatini DM (2017). The Dawn of the Age of Amino Acid Sensors for the mTORC1 Pathway. Cell Metab 26, 301–309. [DOI] [PMC free article] [PubMed] [Google Scholar]
- Wu G, Anafi RC, Hughes ME, Kornacker K, and Hogenesch JB (2016). MetaCycle: an integrated R package to evaluate periodicity in large scale data. Bioinformatics 32, 3351–3353. [DOI] [PMC free article] [PubMed] [Google Scholar]
- Wu Y, Tang D, Liu N, Xiong W, Huang H, Li Y, Ma Z, Zhao H, Chen P, Qi X, et al. (2017). Reciprocal Regulation between the Circadian Clock and Hypoxia Signaling at the Genome Level in Mammals. Cell Metab 25, 73–85. [DOI] [PubMed] [Google Scholar]
- Xie J, Mikolajek H, Pigott CR, Hooper KJ, Mellows T, Moore CE, Mohammed H, Werner JM, Thomas GJ, and Proud CG (2015). Molecular Mechanism for the Control of Eukaryotic Elongation Factor 2 Kinase by pH: Role in Cancer Cell Survival. Mol Cell Biol 35, 1805–1824. [DOI] [PMC free article] [PubMed] [Google Scholar]
- Yamazaki S, and Takahashi JS (2005). Real-time luminescence reporting of circadian gene expression in mammals. Methods Enzymol 393, 288–301. [DOI] [PMC free article] [PubMed] [Google Scholar]
- Yang R, and Su Z (2010). Analyzing circadian expression data by harmonic regression based on autoregressive spectral estimation. Bioinformatics 26, i168–174. [DOI] [PMC free article] [PubMed] [Google Scholar]
- Zhang EE, Liu AC, Hirota T, Miraglia LJ, Welch G, Pongsawakul PY, Liu X, Atwood A, Huss JW 3rd, Janes J, et al. (2009). A genome-wide RNAi screen for modifiers of the circadian clock in human cells. Cell 139, 199–210. [DOI] [PMC free article] [PubMed] [Google Scholar]
- Zheng X, and Sehgal A (2010). AKT and TOR signaling set the pace of the circadian pacemaker. Curr Biol 20, 1203–1208. [DOI] [PMC free article] [PubMed] [Google Scholar]
Associated Data
This section collects any data citations, data availability statements, or supplementary materials included in this article.
Supplementary Materials
A. Luciferase activity of lysate collected periodically from U2OS Arntl::dLUC cells synchronized (with dexamethasone and media change) and grown in normoxia or hypoxia (1% O2, media predeoxygenated) for up to 57 hours. After 33 hours some cells were removed from hypoxia and their media exchanged for normoxic media. Luminescence plotted as relative light units (RLU). Representative experiment of 2. B. Real-time luminescence monitoring of U2OS Arntl::dLUC cells synchronized and treated with 18.75 uM desferrioxamine (DFX). After 4.7 days, DFX-containing media was exchanged for fresh media. Representative experiment of >5. C./D. Luciferase activity of lysate and luminescence of live cells immediately prior to lysate harvest of U2OS Arntl::dLUC cells synchronized and treated with 1mM DMOG or vehicle for up to 3.5 days in low (C) or high (D) buffer media. Data presented as mean of cells plated in triplicate ± standard error of the mean (SEM). Representative experiments of two each with biological triplicates. E. Upper panel: Luciferase activity of lysate collected periodically from U2OS Arntl::dLUC cells synchronized and grown in normoxic high buffer or hypoxic (1% O2, media pre-deoxygenated) low or high buffer conditions for up to 51 hours. After 29 hours some cells were removed from hypoxia and their media exchanged for normoxic high buffer media. Data presented as mean of technical duplicates ± standard deviation (SD) (but error bars generally too small to see). Representative experiment of 2. Lower panel: pH of media across timecourse. F. Real-time luminescence monitoring of U2OS Arntl::dLUC cells synchronized and grown in media of initial pH of 7.5, 7.0, 6.5, and 6.3. Representative experiment of 2 each with 1–2 biological replicates. Note the data shown for pH 6.3 appear also in Figure 1I as the data were divided between these figures for clarity. G. Real-time luminescence monitoring of U2OS cells stably expressing a hypoxia response element (HRE) reporter derived from the HRE of PGK1 (PGK1-HRE::dLUC) synchronized and treated with media pH 7.4 or 6.3 or 300 uM DMOG or vehicle in low buffer conditions. Data presented as the mean of cells plated in triplicate with SEM error bars. H. Expression of the hypoxia inducible factor (HIF)-responsive genes lactate dehydrogenase A (LDHA), phosphoglycerate kinase 1 (PGK1), solute carrier family 2 member 1 (SLC2A1, GLUT1), and vascular endothelial growth factor A (VEGFA) in U2OS Arntl::dLUC cells in acidic (pH 6.3) and neutral (pH 7.4) media over a 52-hour timecourse as determined by RNA-sequencing (RNA-seq) of RNA collected every 4 hours. Reported as fragments per kilobase of transcript per million mapped reads (FPKM). I. Immunoblot for HIFIα using lysate collected periodically from U2OS Arntl::dLUC cells treated with 1 mM DMOG in low or high buffer media or media of pH 7.4 or 6.3 (in parallel to Figures 2B-D). J. Real-time luminescence monitoring of U2OS cells stably expressing PGK1-HRE::dLUC or a reporter derived from the HRE of VEGF (VEGF-HRE::dLUC) synchronized and treated with 1mM DMOG or vehicle in low or high buffer media. Data presented as mean of ≥2 plates with SEM error bars. Representative experiment of ≥2 per reporter. K. Relative expression of HIFα subunits (upper) and HIF-responsive genes (lower) in U2OS Arntl::dLUC cells following treatment with non-targeting control (siCtl) siRNA or siRNA against both HIF1α subunits (HIF1A, EPAS1) prior to synchronization and DMOG (787.5 uM) treatment as in Figures 1E and IH. 10 nM siRNA each condition (5 nM each when two siRNA). qPCR of RNA collected 14 hours after DMOG or vehicle treatment, with expression normalized to respective target expression in the siCtl vehicle condition. Data presented as mean of technical triplicates ± SEM. T-tests of individual genes (unpaired, two-tailed, unequal variance), **p<0.01 each. L. Expression of genes encoding HIFα subunits in U2OS Arntl::dLUC cells after 4 hours in media of pH 7.4 as determined by RNA-seq.
A. Expression of the HIF-responsive gene pyruvate dehydrogenase kinase (PDK1) during the timecourses shown in Figures 2B-D as well as in a similar timecourse obtained in hypoxia (S2F, described below) as determined by qPCR and normalized to the respective control (e.g. vehicle, pH 7.4, normoxia) 4 h time point. B. Real-time luminescence monitoring of U2OS Arntl::dLUC cells treated in parallel to the endogenous RNA timecourses in Figures 2B-D. Mean of cells plated in triplicate or duplicate with SEM error bars. Data from the hypoxic timecourse shown in Figure S1E are also shown again here for completeness of comparisons. C. Endogenous ARNTL expression (previously depicted in Figures 2B-D or appearing in Figure S2F) is shown to highlight that the luciferase reporter shown in B closely mirrors these endogenous transcript levels. D. Media pH over the same timecourses as C (and Figures 2B-D). E. Scatterplot of normalized fast Fourier transform (FFT) peak (descriptive parameter of variance of periodic data indicative of strength of rhythmicity) vs. period for individual cells analyzed by single-cell luminescence imaging (n= 30, 29, 25 for pH 7.4, 6.8, 6.3, respectively). Cells above the annotated FFT=0.07 threshold were scored rhythmic as cells with a period (T) clearly outside the circadian range (T <15 h, T > 35 h) tended to have a FFT peak value < 0.07. Cells with FFT peak < 0.07 were scored arrhythmic. Percent rhythmic cells reported in Figure 2A is the percent of cells analyzed with FFT peak > 0.07. See Methods. F. Expression of constituents of the endogenous core clock over a 52-hour timecourse in U2OS Arntl::dLUC cells synchronized and grown in normoxic high buffer or hypoxic (1% O2, media pre-deoxygenated) low or high buffer conditions for 52 hours. Total RNA was collected every 4 hours and expression was assessed by qPCR and normalized to that at 4 h in normoxia. Media pH during this timecourse (shown also in D) shown here to highlight the correlation between acidification and suppression of circadian oscillation of transcripts. G. Expression of DEC1 (BHLHE40) and RORA during 1 mM DMOG treatment or upon exposure to acidic (pH 6.3) media relative to control (vehicle or pH 7.4) conditions at 4 or 8 hours after synchronization and exposure. Representative experiment of at least two independent experiments.
A. Expression of representative core clock genes over the 52-hour timecourse in pH 7.4 and 6.3 as determined by RNA-sequencing (RNA-seq) (left) versus real-time polymerase chain reaction (qPCR) (right, data also appear in 2D) or RNA collected as described in Figure 3A. RNA-seq reported as fragments per kilobase of transcript per million mapped reads (FPKM). B. Expression in pH 7.4 and 6.3 of the 86 protein-coding genes with statistically significant circadian oscillation in pH 6.3 (see Figure 3B) (p<0.05, false discovery rate (FDR) <0.2) ordered by pH 6.3 phase. Color scale as in Figure 3A. C. p-value statistic of test for circadian rhythmicity of expression (as in Figure 3A) for core and secondary feedback loop clock genes and representative clock paralogs (NPAS2) and output regulators (DBP, TEF) in pH 7.4 or 6.3. D. Most highly significant biological process ontologies represented in the 571 acid-induced and 859 acid-suppressed transcripts (defined in Figure 3E) with terms related to unfolded protein response, vesicle trafficking, DNA repair, and cell cycle colored as shown. p<0.05 above the dashed line. For pH 6.3, all ontologies with B&H q-value<0.05 shown; for pH 7.4, the top 10 ontologies are shown (q<1×10⁻⁵).
A. Representative standard curve and linear best-fit equation relating the ratiometric signal of the cytoplasmic pH probe mCherry-SEpHluorin to intracellular pH (pHi) generated by incubating U2OS cells stably expressing the construct in media of pH 6.0–8.0 containing ionophores that cause pHi to equilibrate with extracellular pH (pHe). Reporter is a fusion of pH-insensitive mCherry and pH-sensitive GFP (SuperEcliptic (SE) pHluorin). Data presented as mean ±standard deviation (SD) of the ratios of the intensities of the SEpHluorin and mCherry signals across an entire 10× field for three or more fields per pH standard. Representative experiment of >6. B. Representative 10x fields used upon which A was generated. C. Representative 10x fields upon which Figure 4A was generated. D. Real-time luminescence monitoring of U2OS Arntl::dLUC cells synchronized and treated with vehicle or 200 uM amiloride (left) or 250 uM α- cyano-4-hydroxycinnamate (αCHC) (right). At the indicated times, treatment was washed out by media change. Representative experiments of ≥3. E. Timecourse of pHi of U2OS cells over three days of treatment with vehicle, 500 uM DMOG, 200 uM amiloride or 250 uM αCHC. Day 1 pHe also indicated for reference (orange line). pHi ± SD derived from three or more 10x fields as in A. Student’s T-tests (unpaired, two-tailed, equal variances) comparing treatment to vehicle at same time point. *p≤0.05, **p≤0.01, ***p≤0.001, ****p≤0.0001, ns = p>0.05. Representative experiment of 3. F. Immunoblots for CLOCK using lysate collected in Figures 4C and4D. Tubulin loading controls shared with Figures 4C and 4F. G. Immunoblots for HIFIα and the indicated mTORC1-signaling components using lysate collected from U2OS cells every 4 hours for 48 hours after synchronization and treatment with vehicle or 300 uM DMOG in low buffer media. Ser209 (EIF4E). H. Real-time luminescence monitoring of U2OS Arntl::dLUC cells treated in parallel to the timecourse in G. Representative of 2. I. Media pH during G. J. Immunoblot for phosphorylation of Thr56 of eEF2 using U2OS cell lysate collected 8 hours after synchronization and placement in normoxia or hypoxia (1% O2, media pre-deoxygenated), or treatment with vehicle or 300 uM DMOG in low or high buffer media, or exposure to media of pH 7.4 or 6.3. Tubulin control shared with blots in Figure 4H. K. Real-time luminescence monitoring of U2OS Arntl::dLUC cells synchronized and treated with vehicle or 300 uM DMOG and 0–100 uM A-484954 (eEF2K inhibitor) in low buffer media. Mean of triplicates. Similar results seen with A-484954 treatment of cells in media of pH 7.4 and 6.3 (not shown). L. Immunoblots for the indicated mTORC1 signaling or clock components using lysate collected periodically from 293T (left) or synchronized MDA-MB-231 cells (right) treated with 500 (293T) or 500 and 1000 (MDA- MB-231) uM DMOG in low buffer conditions or exposed to acidic media. Representative experiment of ≥3 each condition. Vehicle control in high (293T) or low (MDA-MB-231) buffer media. Bottom panel indicates media pH at the time of lysate collection in 293T cells. M. Immunoblot for mTORC1 signaling using lysate collected from U2OS cells after 1 and 27 hours of treatment with vehicle or 1–1000 nM Torin2. All lanes from same gel with intervening lanes cropped for space. N. Real-time luminescence monitoring of U2OS Arntl::dLUC cells synchronized and treated with vehicle or 100 nM Torin2. Mean plus SEM of cells plated in triplicate. Representative experiment of 2. O. Normalized ratio of the background-corrected intensities of p4EBP1 to total 4EBP1 at 27 hours (quantified from M) and the average amplitude (plus SEM) over 4 days (beginning 1 day after synchronization and based upon the mean profile of biological triplicates as in N) both as a function of Torin2 dose. Y-axis scaled as log([Torin]+1). P. Immunoblots for mTORC1 signaling using lysate collected periodically over 2 days from U2OS cells synchronized and either left untreated or treated with 0.4% of the primary alcohol n-butanol to deplete phosphatidic acid or control treated with the non-phosphatidyl-reactive tertiary alcohol tert-butanol (see Methods). Q. Real-time luminescence monitoring of U2OS Arntl::dLUC cells treated in parallel to P. Representative experiment of 4 each with 1–3 biological replicates and with additional arms revealing dose-dependent effects of 0.2–0.6% n-butanol treatment. R. Immunoblots (left) for mTORC1 signaling using lysate collected from synchronized U2OS cells after treatment with vehicle or 5–30 nM rapamycin for 1, 6, 27, or 46 hours in two independent experiments. Right: Real-time luminescence monitoring of U2OS Arntl::dLUC cells synchronized and treated with vehicle or 5–30 nM rapamycin. Mean of cells plated in triplicate. S. Immunoblots for HIFIα and indicated clock network proteins (left) or 4EBP1 (right) using lysate collected from unsynchronized (no dexamethasone) Arntl::dLUC EIF4EBP1 (4EBP1) CRISPR knockout or parental Arntl::dLUC U2OS cells after 1 or 16 hours of exposure to media of pH 7.4 or 6.3 or treatment with vehicle or 500 uM DMOG in low buffer media. Black rectangles enclose immunoblots from same gel. Yellow lines for readability only.
A. Immunoblot for mTORC1 signaling using lysate collected from U2OS cells treated with 5 nM non-targeting control (siCtl) siRNA or siRNA against transcripts encoding leucine-sensing Sestrins (SESN1, SESN2) or the non-leucine sensing SESN3 prior to synchronization and treatment with vehicle or 500 uM DMOG in low buffer media for 20 hours. 2.5 nM siRNA each when two oligos used. B. Real-time luminescence monitoring of Amtl::dLUC U2OS cells treated with 2 nM non-targeting control (siCtl) siRNA or siRNA against SESN1 or SESN3 prior to synchronization and treatment with 500 uM DMOG in low buffer media. Representative experiment of ≥4 with 1–3 biological replicates per condition. C. Immunoblot for Sestrin-2 following immunoprecipitation of FLAG-tagged proteins from lysate collected from 293T cells stably expressing Flag-tagged Rap2A (control protein) or WDR24 (a component of the GATOR2 complex) and near-starved of all amino acids (AA) or leucine (L) for 50 minutes (pH 7.4) prior to rescue with AA/L or continued starvation for 10 minutes. Lysate was additionally immunoblotted for components of mTORC1 signaling. (Starvation media base contained no AA/L but was supplemented with 5% undialyzed serum.) Note Ig heavy chain runs just below Sestrin-2. D. Immunoblots of immunoprecipitated proteins and lysate as in C using lysate collected from Flag- WDR24 293T cells near-starved of leucine for 50 min in pH 7.4 or 6.3 prior to 10 minutes of leucine rescue or continued starvation (in same pH). An additional independent experiment generated similar results after 14 hours of acid exposure. E. Immunoblot for mTORC1 signaling using lysate collected from wild-type or SESN triple knockout (SESN TKO, where all three SESN genes have been silenced by CRISPR editing) 293T cells after exposure to media of pH 7.4 or 6.6 for 50 minutes or treatment with vehicle or 1mM DMOG in low buffer media for 6 hours. F. Immunoblot for mTORCI signaling using lysate collected from wild-type (+/+) or TSC2 null (−/−) mouse embryonic fibroblasts (MEFS) (both p53 null) after 8 hours of exposure to normoxic or hypoxic (1% O2, pre-deoxygenated media) low or high buffer media or media of pH 7.4 or 6.3. Unrelated intervening lanes cropped. G. Immunoblot for mTORCI signaling using lysate collected from U2OS cells treated with 10 nM non-targeting, EIF4EBP, or TSC2 siRNA prior to treatment with vehicle or 300 uM DMOG treatment in low buffer media for 14 hours. H. Real-time luminescence monitoring of the Amtl/.dLUC reporter monitored continuously in parallel to Figure 5F. Mean of biological duplicates. Representative experiment of 3 each with 2–3 biological replicates. I./J. Immunoblots for phosphorylated (Thr172) and total AMPK using lysate collected every 4 hours for 48 hours from synchronized U2OS cells in normoxic high buffer or hypoxic low buffer media (I) or in media of pH 7.4 or 6.5 (J). AMP-activated protein kinase (AMPK) was inactivated (dephosphorylated) in acidic conditions. Two additional independent experiments encompassing 8, 19, 37, 49, and 66-hour time points confirmed reduced pAMPK in pH 6.5 or DMOG low buffer conditions. K/L. Immunoblots for phosphorylated cRaf (Ser338), ERK (Thr202/Tyr204), and GSK3β (Ser9) using lysate collected every 4 hours for 48 hours from synchronized U2OS cells treated with vehicle or 300 uM DMOG in low buffer media (K) or in media of pH 7.4 or 6.5 (L). Although phosphorylation of c-Raf was suppressed in DMOG treatment, the downstream extracellular signal-regulated kinase (ERK/MAPK) was not suppressed in either DMOG or acidic media. Dephosphorylation indicative of activation of glycogen synthase kinase 3 beta (GSK3B), a TSC2-activating kinase, was unapparent in acidic conditions (L). M. Expression of DDIT4 (REDD1) in media of pH 6.3 and 7.4 over a 52-hour timecourse as determined by RNA-seq of RNA collected every 4 hours. Reported as FPKM as in S1H. Note REDD2 (DDIT4L) was not expressed (undetectable by RNA-seq). N/O. Immunoblots for REDD1 using lysate collected every 4 hours for 48 hours from synchronized U2OS cells treated with vehicle or 300 uM DMOG in low buffer media or in media of pH 7.4 or 6.5 (N). Additional immunoblots from an independent experiment using lysate collected at three time points following treatment with vehicle or 500 uM DMOG in low or high buffer media or exposure to media of pH 7.4 or 6.5 (O). Unrelated intervening lanes cropped. Tubulin loading controls in I-L and N shared with corresponding membranes in Figures 4C-D, 4F, S4G, S7O.
A. U2OS cells immunostained for lysosomal protein LAMP2 imaged at lower magnification. Independent replicate experiment of that shown in Figure 6A. B. U2OS cells coimmunostained with LAMP2 and mTOR. Cells were starved of amino acids for 140 min followed by rescue (+AA) or not (-AA) with amino acids for 10 min before processing and imaging. Independent experiment from that shown in Figure 6C. C. Live imaging of U2OS cells transiently expressing lysosomal protein LAMP1 fused to green fluorescent protein after incubation in media of pH 7.4 or 6.3 for 2.5 hours. Lower panels: merged GFP (pseudocolored red for better visibility) and phase-contrast images. (Heterogeneity in LAMP1 expression owing to variable transfection efficiency). Independent replicate experiment of that shown in Figure 6F using different LAMP1- fusion construct. D. U2OS cells coimmunostained for LAMP2 and filamentous (F-) (polymerized) actin following exposure to media of pH 7.4 or 6.3 for 2.25 hours. E. U2OS cells coimmunostained for LAMP2, alpha-tubulin, and DAPI (nuclear stain) following exposure to media of pH 7.4 or 6.3 for 2.75 hours. Quantified in Figure 6I. Independent replicate experiment from that shown in Figure 6G. F. U2OS cells coimmunostained for LAMP2 and mTOR following incubation in media of pH 7.4 or 6.3 for 2.25 hours. Independent experiment from that shown in Figure 6J. G. U2OS cells coimmunostained for LAMP2 and mTOR following incubation in media of pH 6.3 for 120 min. Enlarged to highlight colocalization of LAMP2 and mTOR. Independent replicate experiment of that shown in F. H. U2OS cells coimmunostained for LAMP2 and mTOR following incubation in media of the first indicated pH for 105 min followed by 30 min in media of the second indicated pH. I. Live imaging of U2OS cells expressing LAMP1 fused to GFP after treatment with vehicle or 60 uM ciliobrevin D for 55 min, 90 min, and 9 hours. Images on right at each time point show merged GFP and phase-contrast images. Additional fields and time point of Figure 6N. J. Live imaging of U2OS cells treated with vehicle or 2 uM nocodazole (tubulin depolymerizing agent) for 6.5 hours. Lysosomes and polymerized tubulin labeled with the acidophilic dye LysoTracker (L) and TubulinTracker (T), respectively, prior to imaging. K. Immunoblot for mTORC1 signaling using lysate collected from unsynchronized U2OS cells over an 8-hour timecourse during treatment with vehicle or 2 uM nocodazole. Representative experiment of 3. L. Live imaging of U2OS cells expressing LAMP1 fused to GFP after treatment with vehicle or 2 uM nocodazole for 25 min, 75 min, and 6 hours. M. Live imaging of U2OS cells expressing LAMP1 fused to GFP after treatment with vehicle or 2 uM nocodazole for 7 hours showing initiation of lysosome reclustering. Lysosomes labeled with LysoTracker prior to imaging to highlight colocalization of signal from both lysosome-labeling techniques for the subset of cells expressing LAMP1-GFP. (Heterogeneity in LAMP1 expression owing to variable transfection efficiency.) N. Immunoblot for mTORC1 signaling using lysate collected from unsynchronized U2OS cells after 4 and 30 hours of treatment with vehicle (veh.), 60 uM ciliobrevin D (CbD), or 2 uM nocodazole (Noc.). Representative fields of multiple fields acquired from each of ≥3 biological replicates. Images visualizing endogenous proteins/lysosomes contrasted uniformly (see Methods).
A. Expression of kinesin family members (n=46) in U2OS cells as determined by RNA-seq. Log2 of the mean fragments per kilobase of transcript per million mapped reads (FPKM) determined every 4 hours for 52 hours (13 time points) after exposure to media of pH 7.4 or 6.3. Ranked by mean expression in pH 6.3. B. Expression of the 6 most abundant kinesins as determined in A.C. Previously activated OVA-specific CD8+ T cells (OT-1, see Methods) coimmunostained for LAMP2, mTOR, and DAPI following starvation of amino acids and growth factors for 1 hour (neutral pH) prior to continued starvation for 30 minutes or rescue with replete media (full amino acids and serum) of pH 7.6, 7.2, 6.5, or 6.2 for 60 minutes. Images of staining of endogenous proteins contrasted uniformly (see Methods). D. Quantification of mTOR lysosomal enrichment in C. n = 5–7 fields each condition, encompassing 437, 293, 303, 243, and 393 total cells, respectively. Mean plus SEM superimposed by raw data. Ordinary 1-way ANOVA followed by Tukey method comparing all means. Rescue from starvation increases mTOR lysosomal enrichment. Increasing acidity of rescue media does not reduce mTOR lysosomal association. *p<0.05. E. U2OS cells coimmunostained for LAMP1 and RHEB after 2 days of treatment with non-targeting siRNA or siRNA targeting RHEB, RHEBL1, or both RHEB and RHEBL1 (10 nM each target, normalized to 20 nM with non-targeting siRNA where needed) to validate immunofluorescence specificity of the anti-RHEB antibody. RE of >3. F/G. qPCR (F) and immunoblot (G) of RNA and protein collected in parallel to E to assess knockdown efficiency and accordance with an independent anti-RHEB antibody (Cell Signaling) (G). Mean±SEM of technical replicates in F. RE of 3 each. H. U2OS cells immunostained for LAMP1, mTOR, RHEB and nuclei (DAPI) after amino acid starvation for 155 minutes followed by 10 minutes of amino acid or mock rescue. RE of 3. I. Representative U2OS cell in media pH 7.4 immunostained for LAMP1, mTOR, RHEB, and nuclei (DAPI). Channel combinations as shown to highlight high coincidence of mTOR and LAMP1 staining consistent with localization of mTOR to lysosomes. Distinct patterning of RHEB suggests possible occupancy of a separate but spatially adjacent compartment. J. Immunoblots for mTORCI signaling using lysate collected from HCT116 cells exposed to media of the indicated pH or treated with vehicle or 1 mM DMOG in low or high buffer media for the durations indicated. RE of 2 each with 2 BR. K. Immunoblots of lysate from MCF7 cells as in J. L/M. Immunohistochemical pS6 staining of cross sections of MCF7 (L) and MDA-MB-231 (M) xenograft tumors carried by host mice drinking normal tap water or 400 mM sodium bicarbonate ad libitum from 3 days post tumor cell inoculation through tumor harvest (five weeks later). Representative high-power fields with inset low-power images of tumor cross section. Positivity mask in lower panels. Percent pS6 positive pixels quantified over entire viable area of tumor cross section. Mean±SD, n=5 mice (L) or 4 mice (M) for each arm. 2-tailed Student’s t-tests *p<0.05, ns=not significant N. Luminescence of RHEBN153T-overexpressing and control Arntl::dLUC U2OS cells treated with vehicle or 500 uM DMOG in low buffer conditions. Mean of 3 BR. RE of 4, 1–3 BR each. O. Immunoblot for phosphorylated and total eIF2α (Ser51) using lysate collected from U2OS cells every 4 hours for 48 hours after synchronization and treatment with vehicle or 300 uM DMOG in low buffer media (upper) or exposure to media of pH 7.4 or 6.5 (lower). Tubulin loading controls shared with Figures S4G and 4F. P. Model. Acid produced during hypoxic metabolic rewiring suppresses circadian clock oscillation through inhibition of mTORC1-governed translation as a consequence of centrifugal redistribution of lysosome-bound mTORC1. Orthogonal stress signaling pathways, such as that resulting in inhibitory phosphorylation of eIF2α, can likewise inhibit circadian clock oscillation by converging on a common mechanism of dampened cap-dependent translation. Q. Immunoblot for signaling downstream of PERK over a 3-day timecourse using lysate collected from RHEBN153T- overexpressing or control U2OS cells synchronized and treated with vehicle or 500 uM DMOG in low or high buffer conditions or exposed to media of pH 7.4 or 6.5. *non-specific artifact. Representative experiment of 4 with varying sampling intervals. RE= representative experiment. Biological replicates = BR.STAR Methods
Data Availability Statement
Raw and processed RNA-seq data from this study have been submitted to NCBI Gene Expression Omnibus (GEO; http://www.ncbi.nlm.nih.gov/geo/) under accession number GSE101988.