Abstract
We present a new illumination modeling tool, called IllumNG, developed at NASA Goddard Space Flight Center (GSFC). We describe its capabilities to enhance the analysis and calibration of science data collected by planetary missions. We highlight these with examples making use of lunar data, particularly the topographic and radiometric measurements collected by the Lunar Orbiter Laser Altimeter (LOLA) instrument, with applications to radiometric measurements from other LRO instruments as well. The unique features of IllumNG are its accuracy and flexibility to handle multiple types of observers and light sources, and its ability to accurately model both singly- and doubly-scattered radiation to an observer.
Keywords: illumination, calibration, Moon, LROC, LAMP, LOLA
1. Introduction
The illumination conditions of planetary surfaces, particularly in their polar regions, can have important implications for their thermal state and geological processes, and thus their ability to retain certain volatile species over long time periods, as recognized early (e.g., Watson et al., 1961; Arnold, 1979).
The Lunar Reconnaissance Orbiter (LRO) has been studying the lunar poles since its launch in 2009 (Chin et al., 2007), with a suite of instruments observing a broad range of energies and spatial scales, from high-energy particles (Mitrofanov et al., 2010) to ultra-violet (Gladstone et al., 2012), visible (Robinson et al., 2010), near-infrared (Smith et al., 2010), thermal infrared (Paige et al., 2010b), and radio (Patterson et al., 2017) radiation. In addition to the repeated imaging of the poles by the LROC WAC and NAC cameras (Speyerer and Robinson, 2013) which provide ground truth but have limited spatio-temporal sampling, the topographic data acquired by the Lunar Orbiter Laser Altimeter (LOLA) have enabled the simulation of the illumination conditions near the poles at any time and place for arbitrary observers. For example, using LOLA topography, the permanently shadowed regions (PSRs) of the Moon were determined through illumination modeling over a complete lunar nutation cycle (~18.6 years; Mazarico et al., 2011).
Prior to the arrival of LRO at the Moon, ground-based radar data (Margot et al., 1999) and temporally-limited lunar orbiter images from Clementine (Bussey et al., 2010) were used to assess the illumination conditions at the poles. The impact on the architecture of future surface exploration was also studied (Fincannon, 2008). The laser altimeter onboard the Japanese mission SELENE acquired high-quality elevation data over hundreds of tracks near the lunar poles, resulting in the first unbiased systematic study of illumination conditions (Noda et al., 2008). The more extensive LOLA dataset has since allowed refined, higher-resolution studies of permanent shadow, high- illumination sites, and scattering conditions within PSRs (Mazarico et al., 2011). McGovern et al. (2013) performed simulations over a wider area and made an inventory of the lowest-latitude PSRs, down to 58○ latitude. The LOLA data were also the basis for follow-up analysis on the most promising sites for future exploration at the lunar poles (Gläser et al., 2014; Gläser et al., 2017). The elevation data are also an important input to the planning for robotic or human surface mission scenarios (e.g., traverses), in particular in preparation for the NASA Resource Prospector mission (McGovern et al., 2015; Otten et al., 2015).
Other illumination and thermal modeling tools exist (e.g., Paige et al., 2010a, 2013; Alί-Lagoa et al., 2015; Kömle et al., 2017; Hu et al., 2017; Magri et al., 2018), but they are geared towards simulating surface conditions rather than simulating observations from an observer, as will be presented below. Stubbs et al. (2016) simulated LRO star tracker images to determine potential contribution from surface-reflected light. Our software and its capabilities evolved as a result of various analysis and mission-related needs over the past few years. Since our original work (Mazarico et al., 2011), we expanded our studies to topics of observation planning and context, data modeling, and data calibration, and here we provide a brief overview. We have computed the actual illumination of the surface within the LOLA FOV (Section 3.2), instead of relying on local time or solar zenith angle, in order to understand its relationship to LOLA surface albedo measurements (Lemelin et al., 2016; Fisher et al., 2017). Similarly, average illumination within the larger LEND (Mitrofanov et al., 2010) footprint was computed to find a correlation with possible time-variable neutron measurements. Our tool can also produce the time series of solar flux ratio received by spacecraft orbiting any planetary body, which is used in the computation of solar radiation pressure acceleration to integrate their orbit (LRO, GRAIL, etc.; e.g., Mazarico et al., 2017a; Lemoine et al., 2014, see Section 3.3). We computed the incident radar flux on Mercury’s north polar region at the times of Arecibo observations, in order to better understand the signal quality over different quadrants, and assess whether low-signal areas were due to signal strength or lack of sub-surface ice (Deutsch et al., 2016). Beyond Sun and Earth visibility, we expanded the illumination sources available to include stars (to model UV starlight input for LAMP; Section 4.4), Mars-shine and Mars thermal radiation (for Phobos; Mazarico and Barker, 2018), etc. We computed scattering conditions within lunar polar craters for comparison with anomalous LAMP data (Mandt et al., 2017). An important thrust for developing the observer and associated boresight capability was to understand the Lunar Horizon Glow observations made by LOLA through its Laser Ranging telescope; although the measurement is effectively only provided over a single large ‘pixel’, it was critical to assess the actual scene within it, at sub-pixel scale, to calibrate and analyze the observations (Barker et al., 2018, Section 4.2). Because the higher albedo observed by LOLA (Lemelin et al., 2016; Fisher et al., 2017) within some lunar PSRs was not apparent in long-exposure LROC images (Koeber et al., 2014), we also worked to simulate these images, obtained under scattered light, to disentangle photometric effects from surface reflectance properties (Section 5.3). We have used the boresight capability to assess the effect of surface roughness and off-nadir angle on the spatio-temporal shape of return lidar pulses, for LOLA at the Moon and MLA at Mercury (Cavanaugh et al., 2007). We have also used our tool to produce realistic artificial data for geodetic simulations, particularly the landmark measurements from camera images, as we can take into account both surface illumination and landmark-observer constraints (e.g., Mazarico et al., 2017b, for OSIRIS-REx; similarly for the proposed New Frontiers 4 CAESAR mission).
Here, we describe our latest advances in modeling capabilities, and how they enable these new calibration, analysis, and observation planning tasks. Section 2 presents the concept for modeling illumination with raytracing and discusses some of the implementation choices. Section 3 shows some examples of direct illumination onto a surface or observer. Section 4 introduces simulations of singly-scattered radiation, such as for an orbiting sensor receiving sunlight reflected off the surface. Section 5 discusses doubly-scattered radiation, adding complexity to these simulations by considering scattering between surface points.
2. Theory and Implementation
2.1. Theory
The modeling of illumination is conceptually simple, with only two main tasks to be addressed. First, the visibility between various points in space needs to be established, and we do this through raytracing, which has a vast literature, particularly in computer science. While our implementation makes use of some optimization techniques, these are not critical to our modeling approach per se. The other part is the modeling of the absorption and reflection of radiation off surfaces. That is, we want to accurately account for the photometric properties of the surface.
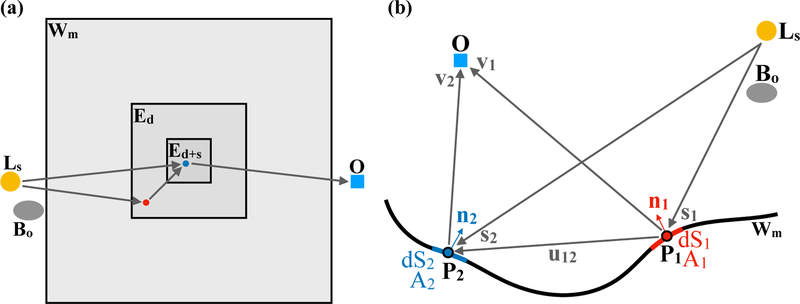
As shown in Figure 1, raytracing is required to assess the existence of unobstructed lines-of-sight between radiation sources and surface points on a planetary body, between points on the body, and between surface points and an observer. With moving sources and observers (in the reference frame of the body), most of these sight lines need to be computed repeatedly. Although most light sources are extended sources, our raytracing computations are limited to point-to-point boolean visibility. Thus, for an extended disc source such as the Sun, we do not directly compute the percentage of the source visible from a surface point. Instead, we discretize the source into individual point sub-sources, and perform raytracing to each.
Figure 1:
Block diagram showing the various interactions between objects necessary to compute the illumination received at the surface or at an observer (O) from a number of sources. The arrows indicate line-of-sight evaluations through raytracing. Datasets of various types, resolutions, extents, and projections can be combined to create a single triangular mesh Wm to test against for raytracing. Any number of light sources (Ls) and occulting bodies (Bo) can be used. Either direct (Ed) or surface-scattered (Es) input can be evaluated.
Figure 2 presents conceptual diagrams, both in map view and cross- section, of the geometry for computing direct (Ls → O, Ls → Ed, or Ls → Ed+s), singly-scattered (Ls → Ed → O or Ls → Ed+s → O) and doubly-scattered (Ls → Ed Ed+s → O) radiation.
Figure 2:
a. Map-view conceptual diagram showing that the region where direct and scattered radiation is to be evaluated (Ed+s) is nested within the direct-only region (Ed) and the overall shape model (Wm). b. Cross-sectional view of the geometry involved in photometric computations. Line-of-sights (Ls → P1, Ls → P2, P1 → P2, P1 → O, P2 → O) may need to be evaluated, and the photometric function evaluations at P1 and P2 will also involve the surface normal unit vectors at these points, . The point P1 is within Ed, meaning only direct illumination is considered. The point P2 is within Ed+s, meaning both direct and scattered illumintion need to be considered. A1 and A2 are the albedos of P1 and P2, while dS1 and dS2 are their respective surface areas.
We avoid simplifying assumptions on the photometric modeling to allow accurate computations. For each reflection (or bounce), we evaluate user- defined photometric functions to compute the intensity radiated in the out- going direction, given an incoming flux, surface normal, and relative source and target positions. Depending on the application, we may want to compute the radiation incident on a surface point directly from a source, the radiation received at a surface point after reflection off another surface point, and what an observer would receive in both of these cases.
Figure 2b shows the various vectors and quantities that enter the equations below which describe how the irradiance incident on the surface and radiance onto the observer is computed. The point P1 is within Ed, meaning only direct illumination is considered. The point P2 is within Ed+s, meaning both direct and scattered illumination need to be considered.
The flux incident on P1 from Ls is:
| (1) |
where F0 is the source flux (1365 W/m2 at 1 AU for the Sun) and i1 is the incident angle of the light on P1. The ‘hat’ notation indicates a vector with unity norm.
The (singly-scattered) intensity (with units of W/m2/sr) received at the observer O from P1 is:
| (2) |
where A1 is the surface normal albedo (i.e., the radiance factor at zero phase angle) at P1 and f1 is the photometric function chosen for P1. Its input parameters are three unit vectors describing the surface normal at P1 and the incidence and emission vectors, respectively. The three common incidence i, emission e, and phase g angles can be obtained simply from these given:
Similar expressions apply to FL2 and IL2O for P2:
| (3) |
| (4) |
The flux incident on P2 from light scattered by P1 is:
| (5) |
where I12 is the intensity from P1 towards P2 given by:
| (6) |
and Ω12 is the solid angle of the P1 element as seen from P2:
| (7) |
with dS1 the surface area assigned to P1.
The (doubly-scattered) intensity received at the observer O from P2 of radiation originally reflected off P1 is:
| (8) |
The total intensity received by the observer O from P2 is:
| (9) |
2.2. Implementation
Our earlier work (Mazarico et al., 2011) relied on the pre-calculation and storage of the local horizon at each surface location to speed the computations at each timestep. Most efficient for simulating long time periods, it was based on gnomonic projection simplifications, and thus implicitly required near-zero obliquity, and was thus applicable only to the immediate polar regions of the Moon and Mercury. While it could be extended beyond this assumption, computational gains may have diminished. Our new modeling tool makes no such geometrical assumption, and uses double-precision ray-tracing. It was entirely rewritten in object-oriented C++, and makes use of external libraries for efficiency. We leverage the Computational Geometry Algorithms Library (CGAL; The CGAL Project, 2018; Tangelder and Fabri, 2018) to handle the raytracing. We use the SPICE toolkit by NASA’s Navigation and Ancillary Information Facility (NAIF; Acton, 1996; Acton et al., 2018). We use Libconfig to allow flexible configuration syntax and varied input formats that make our new tool more versatile and able to inform a wider range of lunar and planetary science studies.
The terrain is constructed as an unstructured set of triangular elements, from any number of basemaps given at different resolutions in different projections and which can be truncated based on distance to the region of interest. An axis-aligned bounding box (AABB) octree is then computed to speed up the raytracing algorithm. Surface normals and spatially-varying albedo can be specified, and user-defined photometric functions (e.g., from the literature) can be selected.
Although the program can be used for any airless body, we here focus on the Moon and briefly discuss the available shape data for the Moon. The most accurate measurements of lunar surface elevation were obtained by the LOLA altimeter, which could obtain altimetric ranges globally, even in regions of permanent shadow. Its intrinsic geodetic accuracy makes it the natural dataset to define a lunar reference frame, in concert with Lunar Laser Ranging (Williams et al., 2008). However, it can lack in spatial coverage due to its narrow 5-beam footprints in comparison to raster imaging capabilities of instruments such as the LROC Wide-Angle Camera (WAC; Robinson et al., 2010) and Kaguya Terrain Camera (TC; Haruyama et al., 2008). While at the poles (polewards of 60○ latitude) the LOLA data are of sufficient density to provide high-resolution maps, Barker et al. (2016a) combined the LOLA and TC datasets into the highest-resolution near-global (60○S to 60○N) topographic model of the Moon, named SLDEM2015, up to a resolution of 512 pixels/degree, equivalent to approximately 60 meters/pixel at the equator. Both LOLA maps and the SLDEM2015 model are available on the LOLA Data Node of the NASA Planetary Data System (PDS, http://imbrium.mit.edu/). We used these shape models in the work presented below.
The illumination sources can be specified as points, two-dimensional shapes (on a plane always perpendicular to the line-of-sight) made of individual point sources, or three-dimensional vertices (fixed in any SPICE-recognized frame). Their center is positioned at every timestep according to a prescribed trajectory. This allows us to simulate illumination from the Sun of course, and discretization of the solar disc into several hundred elements can account precisely for limb darkening at any wavelength. We can also model starlight from UV-bright stars, Earthshine, etc. Such sources may also be occulted by user-defined ellipsoids (e.g., Mars for Phobos).
A number of outputs can be requested, such as the (boolean) visibility and the illumination (percentage of flux visible) of the sources, incident flux on the surface and shadow height; at every timestep or their average over the simulation period. Indirect illumination (i.e., secondary scattering) can be computed as well, provided enough spatial padding for the scatterers’ illumination conditions to be robustly evaluated (discussed in more detail below).
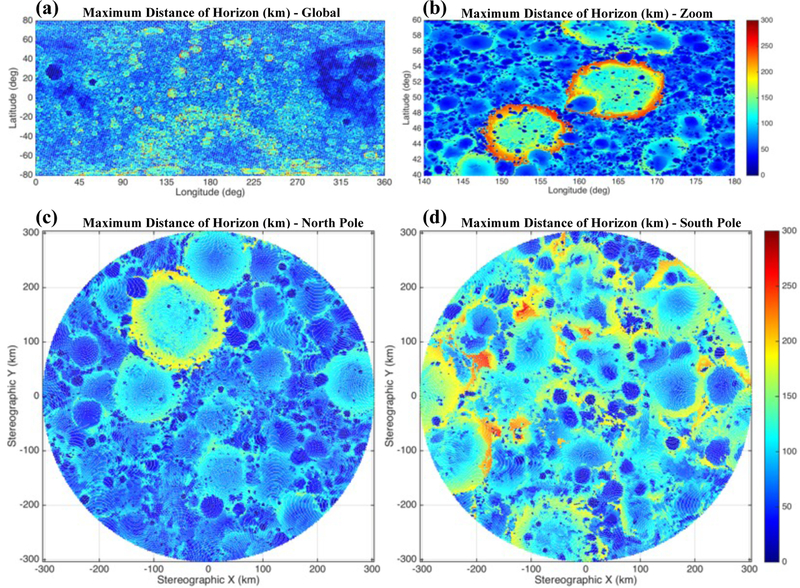
Theoretical work of Li et al. (2008) showed that the farthest horizon distance for the Moon would be around 300 km. Given this is a maximum, we can reduce computational costs in regions where the horizon is closer, by using a pre-computed map of horizon distance. Figure 3 shows our determined maximum distance of the horizon over the whole Moon, using 10 million points distributed evenly (on a spherical Fibonacci Lattice). We find a global maximum distance of 299.8 km, in excellent agreement with Li et al. (2008), but many regions with much closer horizons. This map is useful to optimize (restrict) the extent of the surrounding topography considered in simulations.
Figure 3:
Maps showing the maximum distance to the horizon from the surface of the Moon. Computations were done at 10 million points evenly distributed over the Moon’s surface. a: near-global map (80○S to 80○N), with a decimation factor for the points plotted of 33. b: zoom of a around craters Campbell and d’Alembert, but at full resolution. c/d: North/South polar regions (80○−90○ latitude) in polar steregraphic projection, at full resolution.
While computationally expensive, this capability enables exact modeling of the geometry of complex observations such as LROC long-exposure images of PSRs and LAMP data, as discussed below. Under the same intent to closely reproduce the actual observation geometry in our modeling, both direct and indirect illumination can be traced to any observer. Realistic photometric functions (e.g., Shkuratov et al., 1997; Gaskell et al., 2008; Buratti et al., 2011; Boyd et al., 2014; Sato et al., 2014; Barker et al., 2016b) are used to compute the intensity received from surface elements. Moreover, we allow boresight vectors to be defined in a SPICE frame (such as the LAMP instrument frame, fixed with respect to the telemetry-defined LRO spacecraft frame). At each timestep, intersections with the octree are determined and their illumination conditions, both direct and scattered, are assessed.
3. Direct Illumination
Various situations involving direct illumination arise in planetary science and exploration. IllumNG has great flexibility in what objects receive direct illumination. Any SPICE-defined planetary body or spacecraft can receive direct illumination. Here we focus on the Moon and various LRO datasets because of the high-resolution topography available from LOLA and the wide array of instrument and observation types available.
Most previous work on illumination condition modeling on the Moon has focused on direct solar input, primarily to investigate the presence of peaks of eternal light (Fincannon, 2008; Mazarico et al., 2011; Gläser et al., 2014) or to map the PSRs (Bussey et al., 2010; Margot et al., 1999; Noda et al., 2008; Mazarico et al., 2011; McGovern et al., 2013).
3.1. Incident flux on a surface region
We can of course address similar questions with our program, setting it up with only ‘direct’ evaluation points (Ed) anda base shape model (Wm). For illustration purposes, we look at the Faustini crater near the south pole of the Moon. Faustini is a ~50-km crater with a large PSR on its floor (Mazarico et al., 2011). It is of similar size and age as the neighboring Haworth and Shoemaker craters (Tye et al., 2015). It also hosts a ~9-km crater within its PSR; its doubly-shadowed floor is even colder than typical PSRs, with a maximum temperature <50K (Paige et al., 2010b). We use a resolution of 240 meters per pixel (m/px) in this example. We used Figure 3d to determine that a 200 km surrounding region was sufficient for our Faustini simulation to consider all possible obstacles near the horizon when performing raytracing.
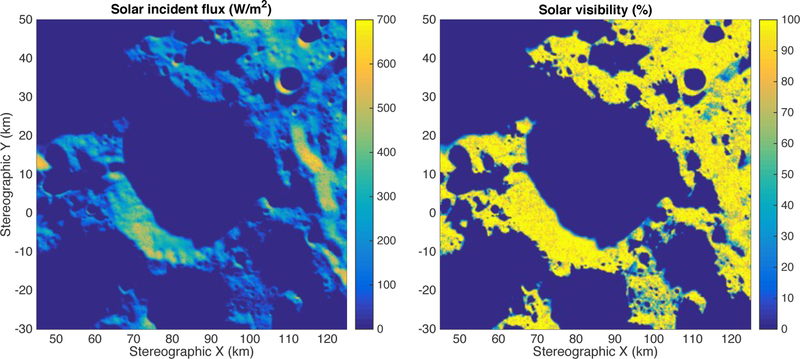
Figure 4a shows the incident flux on the surface computed at a specific timestep (August 29, 2012), while Figure 4b gives the visibility of the solar disc from the surface. In these cases, the Sun was modeled as 100 discrete sub-sources with radiances totaling 1365 W/m2 while accounting for limb darkening (the visibility is thus weighted by the limb-darkened irradiance of each sub-source).
Figure 4:
Incident flux (left, in W/m2) and solar disc visibility (right, in percent) of the Faustini crater and surrounding area, on August 29, 2012 02:37 UTC. The map is shown in south polar stereographic projection, with true scale at the pole and a reference radius of 1737.4 km.
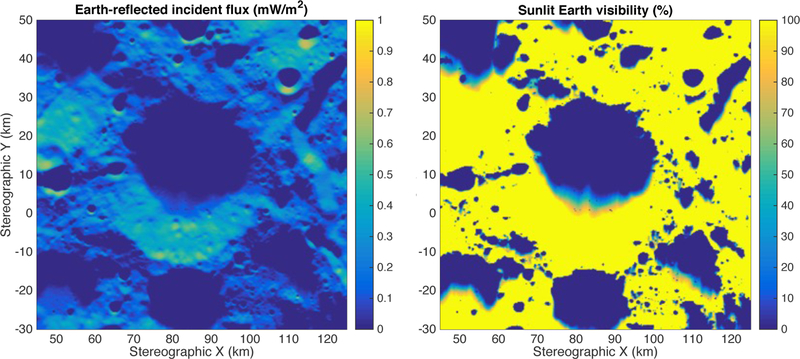
Figure 5 shows the same outputs, but using the Earth as a 3-dimensional illumination source with 671 surface elements reflecting solar radiation to the Moon. In this case, the reflected solar radiance is computed using a Lambertian approximation, with varying albedo to represent continents and oceans.
Figure 5:
Incident flux from Earth-reflected light (left, in mW/m2) and sunlit Earth visibility (right, in percent) of the Faustini crater and surrounding area, on August 29, 2012 02:37 UTC. The map is shown in south polar stereographic projection, with true scale at the pole and a reference radius of 1737.4 km.
3.2. Incident flux on a groundtrack
Another example is given as illustration of the ‘boresight’ capability. We simulate the illumination of the surface that falls within the fields of view (FOV) of each of five detectors of the LOLA instrument onboard LRO (Smith et al., 2010, 2017; Chin et al., 2007). Each FOV was discretized into 50 boresights. The LOLA groundtrack during an LRO orbit extends over thousands of kilometers and covers all latitudes, and a much larger spatial extent is necessary compared to the previous example. Because we want to avoid the computational burden of using as input a global shape model of the Moon even at ~240m/px, we combine multiple basemaps of various resolutions. Within 30km of the groundtrack (which can first be computed with sufficient precision for this purpose with a low-resolution global lunar topog- raphy), a resolution of 128 pixels/degree (ppd ; ~240m/px at the equator) is used; within 60km, 64ppd; within 120km, 32ppd; within 300km, 16ppd; and 4 ppd beyond that (although not really necessary given the curvature of the Moon; Li et al., 2008). Although it requires some additional preparatory work to setup such a multi-resolution base mesh, it can significantly speed up the runtime, with reduced input data reading, memory usage, and more efficient projection transformations and AABB octree creation.
Figure 6a presents the computation results, illustrated with the flux incident on the surface within the fields of view of LOLA’s five receivers (averaging the 50 boresights).
Figure 6:
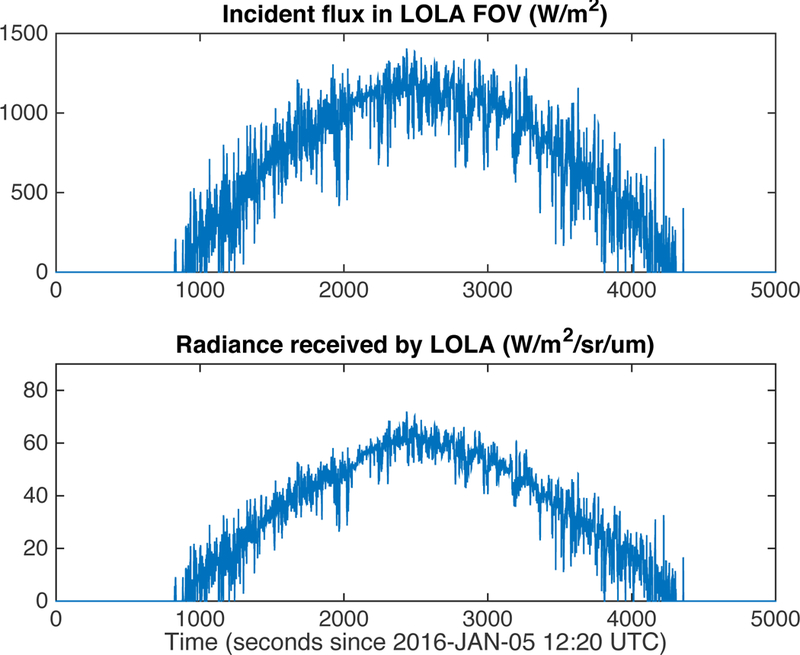
a: Incident flux from the Sun onto the lunar surface within the LOLA FOV (top, in W/m2). b: Radiance received by LOLA from sunlight at 1064 nm (irradiance 647 W/m2/µm) reflected o↵ the lunar surface within its FOV (bottom, in W/m2/sr/µm).
3.3. Source visibility from Observer
Lastly, instead of evaluating the illumination of the surface, we can compute the visibility of an illumination source from the perspective of an observer such as an orbiting spacecraft. This proves especially useful for space- craft orbit determination (Mazarico et al., 2012). One important perturbation on a spacecraft that needs to be accounted for when integrating its orbit is the solar radiation pressure. It depends on the spacecraft’s cross-sectional area and reflectivity properties, but also of course on the input solar flux. In eclipse or in ‘full Sun’, its value is trivial (~1365 W/m2 at 1 AU), but its accuracy in penumbra and during umbra transitions requires precise modeling. For instance on the Moon, the difference in eclipse timings between assuming a spherical shape and using the global LOLA model can be as high as 200 seconds near the start/end of eclipse seasons. During the analysis of the GRAIL Ka-band Range-Rate (KBRR) data to derive high-resolution lunar gravity field models (Lemoine et al., 2014), such modeling actually proved necessary to avoid force mismodeling which resulted in errors orders of magnitude above the noise level. We can achieve a high accuracy using a 2D (or 3D) source by simply increasing the number of sub-sources, rather than having to deal with disc/segment intersection as in our previous work (Mazarico et al., 2011).
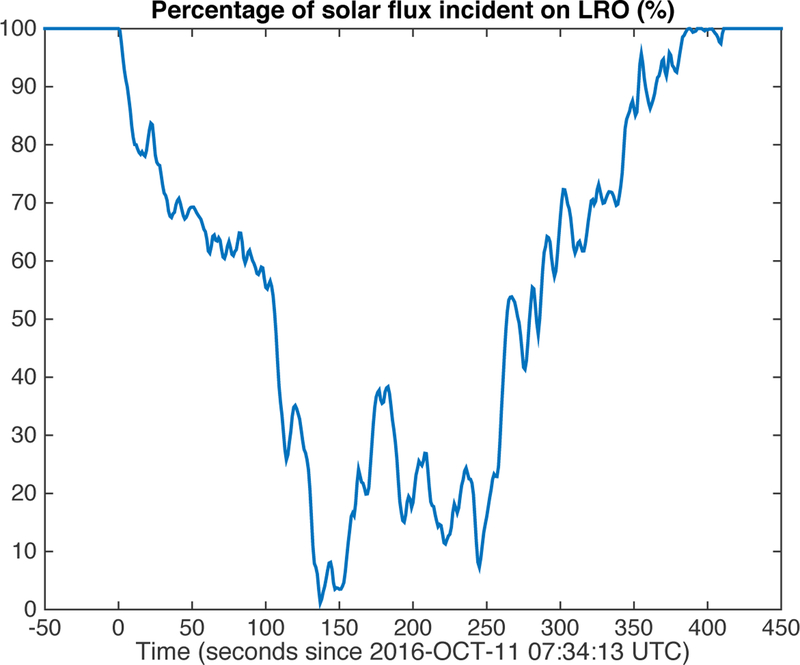
In our processing of the LRO radio tracking data to derive high-quality ‘science’ orbits (Mazarico et al., 2017a), we now use our illumination model to compute a history of solar visibility observed at LRO. This is illustrated in Figure 7, which shows a single day-to-night transition at grazing geometry (on October 11, 2016; β ~ 70.2○). In this case, a spherical Moon of radius 1737.1 km (the average radius) or even 1738 km (the gravity reference radius) would actually yield no partial obscuration of the Sun at all.
Figure 7:
Simulation of the percentage of solar flux received at LRO, on 11 October 2016. At that time, the LRO orbit is grazing the Moon’s topography as seen from the Sun, and LRO spends nearly 7 minutes in penumbra. The varying terrain elevation at the lunar limb creates this complex time series.
4. Scattered Illumination to an Observer
The computational results from the section above can be easily expanded to derive the expected radiance received at an observer, using the photometric equations described in Section 2.1.
4.1. LOLA passive radiometry
The radiance received by each of the five LOLA detectors, during the same orbit as in the previous groundtrack example, was calculated and is shown in Figure 6b. In this example, we use the photometric function f(i, e, g) derived by Barker et al. (2016b) for that same 1064-nm wavelength. These modeled radiance values can be used to calibrate and analyze the passive radiometry measurements obtained by the LOLA instrument since early 2014 (when not recording altimetric measurements due to loss of signal at high spacecraft altitude). The raw measurements are considered ‘noise counts’ by the detector, but are proportional to the number of photons, and thus converted to absolute radiance after detector dark current and responsivity corrections and comparison with Kaguya Spectral Profiler data (Barker et al., 2016b). Simulations such as that above can help calibrate and analyze these measurements.
4.2. LOLA lunar horizon glow campaign
The illumination code has also been used extensively in the data analysis for the LOLA lunar horizon glow campaign to look for forward-scattered sunlight from low-altitude (<20km) exospheric dust grains (Barker et al., 2018). These LOLA observations require slewing the spacecraft to point the High-Gain Antenna and co-boresighted Laser Ranging (LR) telescope, on the anti-nadir spacecraft deck, toward the lunar limb just before sunrise or after sunset.
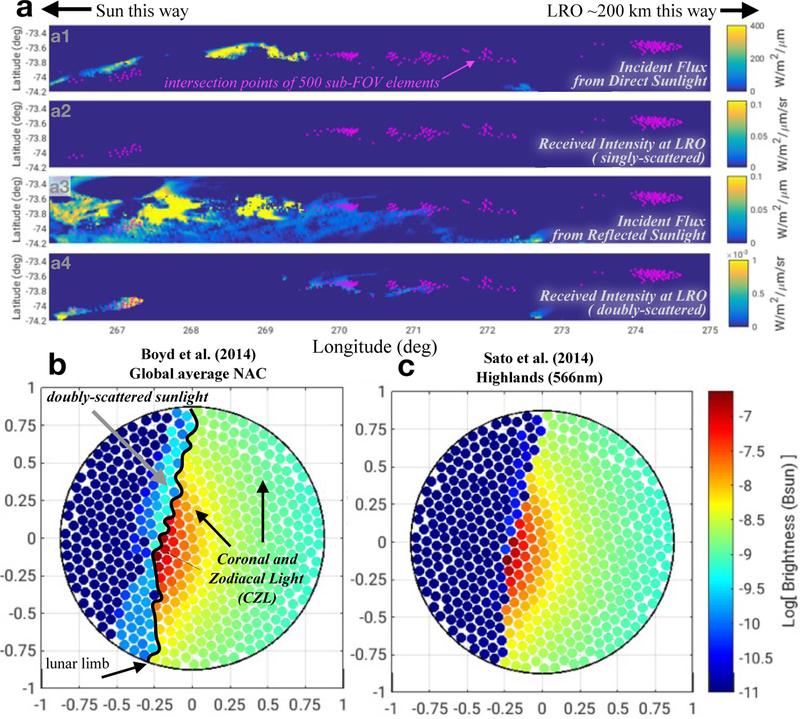
The FOV of the LR telescope is large (~1.75○) and only sampled with a single effective pixel, so the radiance measured cannot be directly interpreted because it typically encompasses a large part of the sky and the lunar limb. A narrow band-pass filter around 532 nm is also present (matched to the laser wavelength of the Satellite Laser Ranging stations for the 1-way ranging experiment; Mao et al., 2017). The fill factor of the limb within the FOV and the coronal-zodiacal light (CZL) need to be modeled to assess whether or not the LOLA measurement shows an excess signal indicative of lunar dust grains. In our analysis, we create a simulated image by sub-sampling the LR FOV with 500 boresights. We determine whether each boresight intersects the lunar shape model, and if not, what CZL radiance it would measure using Large Angle Spectroscopic Coronagraph (LASCO) images (Brueckner et al., 1995). We can also compute where the shadow boundary is along each boresight vector, an important ingredient necessary to compute the expected radiation forward-scattered towards the observer by dust grains along that vector. For the boresights that do intersect the surface, we can ascertain whether they fall onto illuminated terrain. Because of the geometry, with LRO on the nightside of the Moon and the LR telescope pointing towards the terminator, we really mean to verify that all the terrain is indeed dark as expected. Figure 8 shows a typical example of a lunar limb observation, for an instantaneous timestep (the scans normally last 100–150 seconds, involving many such timesteps) in which no singly-scattered sunlight is expected to be reflected off the Moon into the LR telescope, but there is a small amount of doubly-scattered light (see Section 5.1).
Figure 8:
a: Map view of the surface region observed by the LR telescope (magenta points are the intersections of 500 boresights). Panels a1 and a3 show the Sun-to-surface (direct) and surface-to-surface (reflected) incident flux, respectively. Panels a2 and a4 show the resulting intensity observable by the LRO spacecraft (e.g., not facing away and with no obstacle in-between) and falling within the LR FOV (at magenta points); these are the received singly-scattered and doubly-scattered radiation, respectively. Only doubly- scattered radiation contributes. b: Simulated image of topography (corresponding to the magenta points in a) and sky within the LR FOV. The Boyd et al. (2014) photometric function was used. Axes are in degrees, and the radiance values are given in terms of solar brightness (Bsun = 2.84.107W/m2/sr/µm at 532 nm). The Sun is just below the horizon. c: Same as b but with the Sato et al. (2014) photometric function, illustrating in comparison with b the strong dependence of modeling results on the assumed photometry.
4.3. Framing Camera
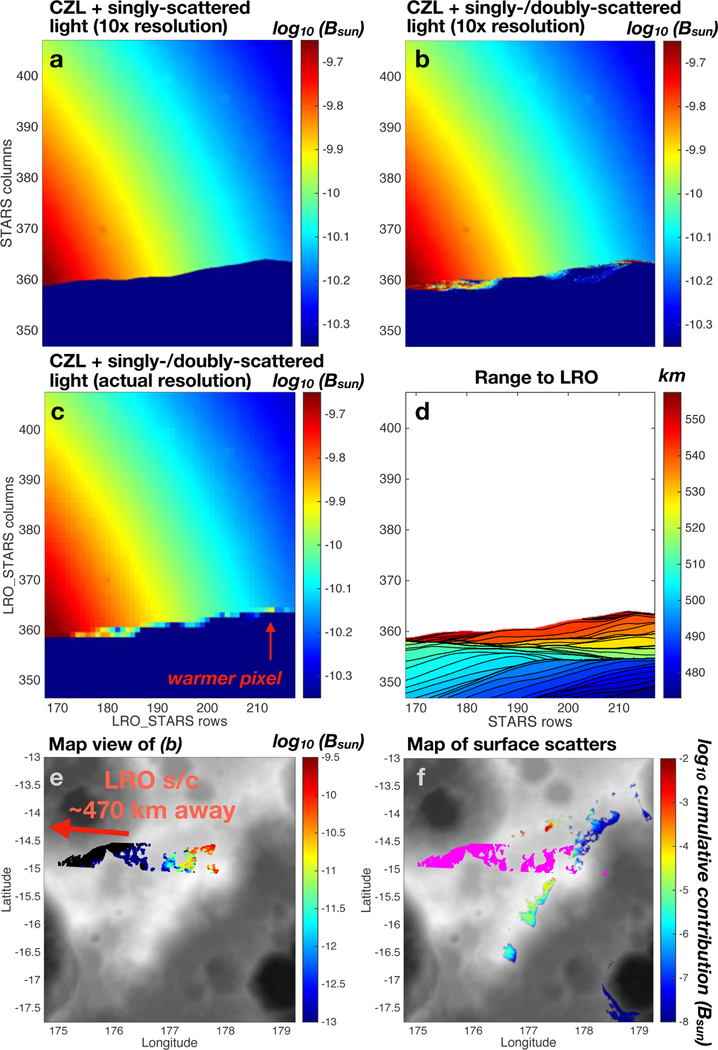
The boresight capability can also be used to simulate images obtained by cameras onboard spacecraft, including framing cameras. We illustrate this capability with the LRO star trackers. These were used to investigate lunar horizon glow earlier in the mission, by extracting limited image subsets at times when their FOVs covered the lunar limb in favorable geometric conditions (Stubbs et al., 2016). We choose an image obtained with the secondary star tracker acquired on 25 December 2013 at 2:45 UTC. Although the image is only ~3,000 pixels, we conducted the simulation with super- resolution, by a factor of 10, so that 100 simulated pixels can be averaged into a single actual pixel in order to avoid missing finer topographic structures. This can also allow for more precise convolution of the camera point-spread function for comparison with the acquired image.
Figure 9a shows the result of our simulation based on the highest-resolution topography available (SLDEM2015, at 512ppd; see Barker et al., 2016a). It compares favorably with the original image shown in Stubbs et al. (2016), but unlike the simulation result of Stubbs et al. (2016) we do not find any pixel with (high-phase angle) singly-scattered surface radiation. Instead, this appears rather to be due to doubly-scattered light at moderate (< 90○) phase angles from distant high peaks where the first scatter is generally back toward the Sun and the second scatter is to the camera (see Section 5.2).
Figure 9:
a: Simulated LRO Star Tracker image (in pixel space), showing radiation re- ceived from CZL and from singly-scattered sunlight from the surface. The original pixel resolution was increased 10 times to capture subtle topographic features. b: Same as a but adding doubly-scattered light originating from surrounding terrain outside the FOV. c: Same as b after averaging the modeled pixels back to the original image resolution. d: Contour plot of the distance of surface points seen in the image to the spacecraft, for context. e: Spatial map view in cylindrical projection of lunar topography (grayscale) with superposed surface boresight intersection points within the image FOV. That is, we place the lunar surface shown in a–d on a map. The color indicates the level of radiation doubly-scattered to LRO. Note the color scale shows fainter values than in b–c. Black indicates no secondary radiation. f: Same as e, but surface boresight intersections are now all magenta color. The neighboring surfaces contributing doubly-scattered radiation are shown following the color scale (showing the sum of radiation eventually arriving at LRO, through any surface boresight point).
4.4. Push-broom/push-frame Camera
LRO carries several passive instruments that use line array sensors to image the surface thanks to the along-track motion of the spacecraft.
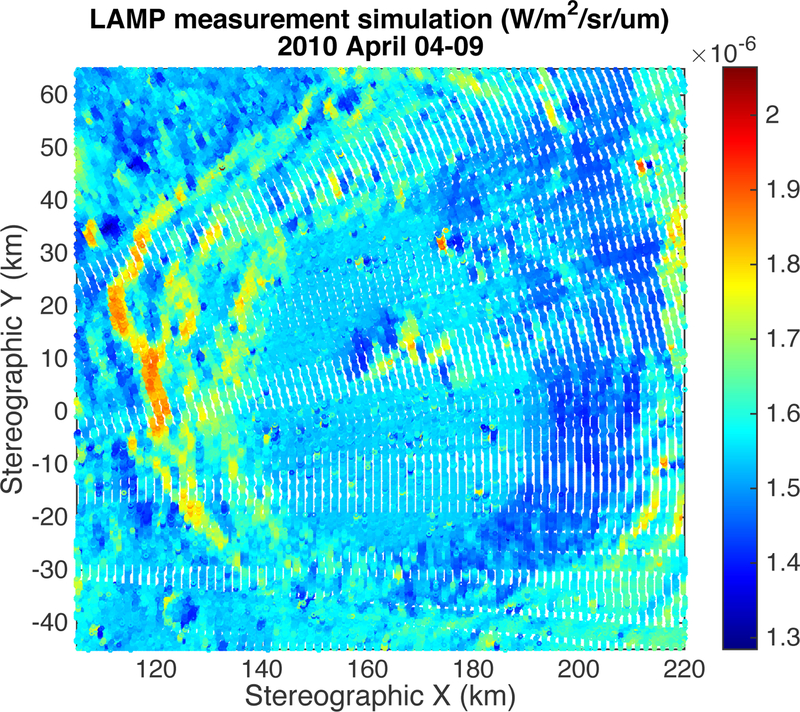
One such instrument is LAMP, which measures reflected light at UV wave- lengths (Gladstone et al., 2010). It can use starlight as an illumination source to image the PSRs in different spectral bands to identify the presence of water ice (Gladstone et al., 2012; Hayne et al., 2015). The accuracy of the calibration and analysis can be aided by accounting for all known discrete sources, rather than using broad sky sources as in Gladstone et al. (2012). Here, we use a set of 1,000 UV-bright stars (P. Miles, personal communication) to model the nighttime radiation collected by the 21 active LAMP pixels, with a timestep of 150 milliseconds to build an image of similar resolution as the LAMP science products ( 240m/px). Figure 10 shows the results for Amundsen in April 2010. By conducting similar simulations over a full year, we find that there is a seasonality to the flux predicted to be received by LAMP, with the January-July months receiving 20% more than the August-December months due to the discrete distribution of the brightest UV stars.
Figure 10:
Simulation of nighttime LAMP observations over Amundsen crater, using 1000 UV-bright stars as illumination sources. The along-track spacing ~240m (150ms) is commensurate with the map products created by the LAMP team (Gladstone et al., 2012).
5. Doubly-scattered Illumination to an Observer
In this section, we increase the complexity of the modeling, by considering the light incident on these same kinds of terrain from neighboring surfaces. In the case of high terrain, some of these ‘neighbors’ can be distant (tens to hundreds of kilometers) which can considerably increase the extent of the surface that needs to be considered to determine their own state of direct illumination.
5.1. LOLA lunar horizon glow
While the LOLA lunar limb scans near sunset and sunrise do not show any contribution from singly-scattered sunlight (Figure 8), we can use our modeling tool to assess the importance of doubly-scattered illumination, whereby sunlight is reflected off a surface point onto another location which itself is Visible to the spacecraft. These computations are carefully conducted because of the complexity of the manual setup. Using the outputs from the singly-scattered illumination simulation, we first derive a list of the surface points that are visible from the raytraced boresight-surface intersections (for all timesteps of that scan). We can then compute the visibility of the Sun from these neighboring points, and for those sunlit neighbors compute the doubly-scattered radiance from them to the surface points within the FOV and to the spacecraft (using Eq. 9; see a3/a4 panels of Figure 8 in particular). As shown in Figure 8b, we find that the doubly-scattered light can normally be ignored as it does not exceed 1% of the CZL level in the most optimistic cases. The range in our simulation results is primarily related to the choice of the photometric function for the surface, with some (e.g., Sato et al., 2014) yielding much lower levels than others (e.g., Boyd et al., 2014).
5.2. Framing Camera
Building on the previous LRO Star Tracker simulation (Section 4.3), we expanded the selected topography around the near-limb region of interest falling within the star tracker FOV, to allow the illumination state of all the ‘scatterers’ to be computed. Once we know each boresight intersection point, its viewshed can be computed by looping through all the scatterer points within the wider Ed map and checking for direct line-of-sight. Observer-received intensity can then be computed using exact photometric calculations and summing over all scatterers. After a first pass with a low-resolution model to evaluate the surface region contributing to the doubly-scattered intensity, we run with a full-resolution (512ppd) lunar shape. The results are shown in Figure 9b–f. We find that much of the terrain on the nightside of the terminator does get some limited amount of light scattered off neighboring peaks and crater rims (Figure 9f), with one well-exposed 10×10km area dominating the contributions. We note several areas in the image near the sky boundary that do receive surface-scattered light of a level comparable to the surrounding CZL. Indeed, the warmer pixel indicated by Stubbs et al. (2016) in the actual image may correspond to a particularly strong doubly-scattered input from the most distant lunar surface within the frame.
5.3. Push-broom/push-frame Camera
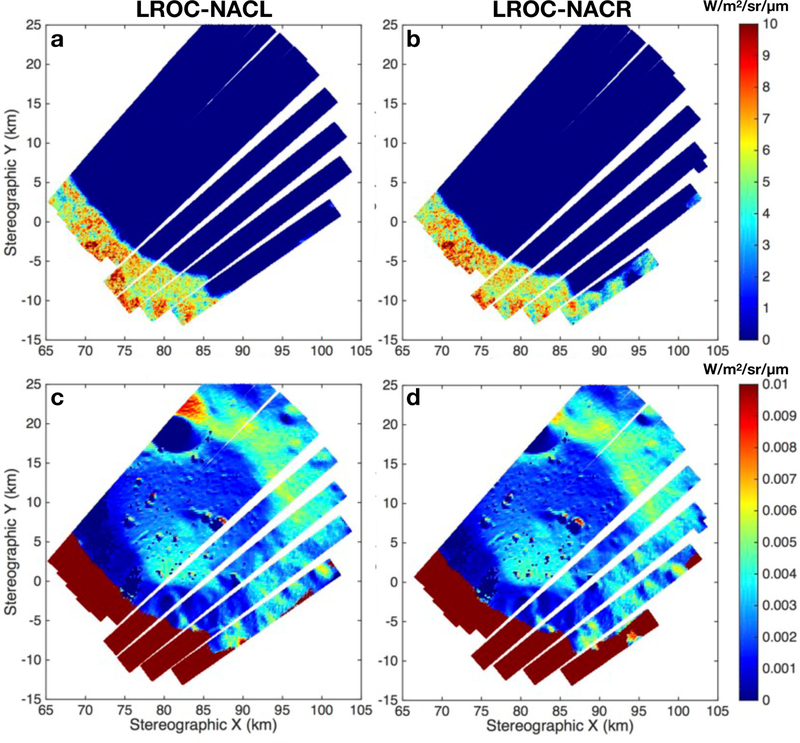
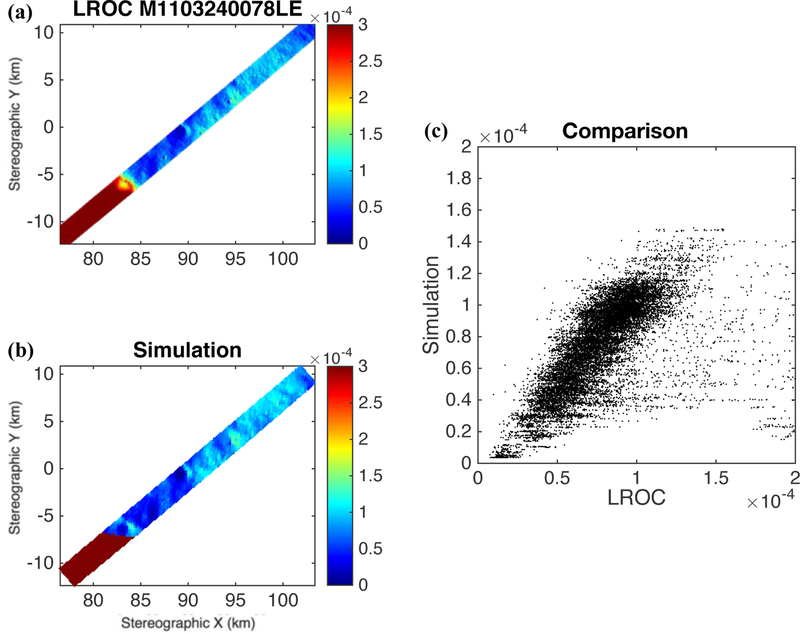
During the extended mission of LRO, ‘PSR imaging’ campaigns were conducted with the LROC NAC instrument. Images were acquired with long exposures in order to map and potentially identify the presence of volatiles hinted by several other LRO instrument investigations (Zuber et al., 2012; Lucey et al., 2014; Fisher et al., 2017; Gladstone et al., 2012; Hayne et al., 2015), morphologically and through albedo variations. One difficulty in interpreting these images, particularly with quantitative analysis, is that the effective illumination source within the PSRs is typically a sunlit crater wall, close-by and very extended in terms of solid angle. It is not possible through intuition or simple calculations to derive the flux estimate expected at the camera, at least with sufficient robustness to ascertain whether observed brightness variations are albedo differences, and to derive an absolute albedo. We show here the results of simulations for a set of 10 LROC NAC image pairs acquired within the Faustini crater in August 2012 in this long-exposure mode. We process and calibrate the LROC images starting from the level-1 (EDR) products and map-project them into stereographic polar projection at a resolution of 50 meters/pixel. In our simulation, we choose a timestep of 50 ms and reduce the ~2000 pixels of the NAC line array to 60, to obtain a simulated dataset of similar resolution as the 50 m/px of our projected LROC images. Figure 11 shows the results of our simulation for both the NACL and NACR images, for both singly-scattered (Fig. 11a/b) and doubly- scattered (Fig. 11c/d) radiation. These compare well with the actual LROC images, although the selected photometric function is again important. We find that Boyd et al. (2014) performs the best, allowing for the most linear transformation between actual and simulation pixel values. Figure 12 shows a comparison of the simulated intensity and the LROC image data. After estimation of a scale to absorb expected errors in photometric function and surface albedo, the correspondence is excellent, with a correlation coefficient greater than 0.9. Some of the remaining differences are likely due to the limited simulation resolution, and possibly from camera stray light effects.
Figure 11:
Simulation of 10 LROC NAC image pairs (a: NACL; b: NACR) over the Faustini crater in August 2012. The same maps are shown in c/d but with a lower and much narrower range to highlight the scattered radiation. Projection is south polar stereographic.
Figure 12:
a: LROC NACL image M1103240078L, resampled at 50m/px. b: Simulated image after scale estimation. c: Direct comparison with a scatter plot, showing good linearity between the two datasets. All values are intensities, in W/m2/µm/sr.
6. Conclusion
We have presented the theoretical background and outlined key features of our implementation of an illumination modeling program designed and used at NASA GSFC, called IllumNG. We have shown through a variety of examples how the modeling of illumination conditions of the surface of a planetary body can bring valuable information for the calibration, analysis, and interpretation of the data collected by science instruments. Although our examples focused on the Moon and LRO, many similar problems can be addressed across planetary science.
Acknowledgements
We thank NASA and the LRO project for supporting this work. Funding through the NASA Internal Science Funding Model (ISFM) ‘Planetary Geodesy’ work package is also acknowledged. EM thanks Matthew Holub, Benjamin Byron, and Wendel Pericles who were interns at NASA GSFC through the OSSI program.
Contributor Information
Erwan Mazarico, NASA Goddard Space Flight Center, Greenbelt, MD, USA..
Michael K. Barker, NASA Goddard Space Flight Center, Greenbelt, MD, USA..
Joseph B. Nicholas, Emergent Space Technologies, MD, USA..
References
- Acton C, Bachman N, Semenov B, Wright E, 2018. A look towards the future in the handling of space science mission geometry. Planetary and Space Science 150, 9–12. doi: 10.1016/j.pss.2017.02.013. [DOI] [Google Scholar]
- Acton CH, 1996. Ancillary data services of nasa’s navigation and ancillary information facility. Planetary and Space Science 44, 65–70. doi: 10.1016/0032-0633(95)00107-7. [DOI] [Google Scholar]
- Alί-Lagoa V, Delbo M, Libourel G, 2015. Rapid temperature changes and the early activity on comet 67p/churyumovgerasimenko. The Astro- physical Journal Letters 810, L22. [Google Scholar]
- Arnold J, 1979. Ice in the lunar polar regions. Journal of Geophysical Research: Solid Earth 84, 5659–5668. doi: 10.1029/JB084iB10p05659. [DOI] [Google Scholar]
- Barker M, Mazarico E, Neumann G, Zuber M, Haruyama J, Smith D, 2016a. A new lunar digital elevation model from the Lunar Orbiter Laser Altimeter and SELENE Terrain Camera. Icarus 273, 346–355. doi: 10.1016/j.icarus.2015.07.039. [DOI] [Google Scholar]
- Barker M, Sun X, Mazarico E, Neumann G, Zuber M, Smith D, 2016b. Lunar phase function at 1064-nm from Lunar Orbiter Laser Al- timeter passive and active radiometry. Icarus 273, 96–113. doi: 10.1016/j.icarus.2016.02.008. [DOI] [Google Scholar]
- Barker MK, Mazarico E, Smith DE, Sun X, Zuber MT, McClanahan TP, Neumann GA, Torrence MH, Head JW, 2018. Searching for Lunar Horizon Glow with the Lunar Orbiter Laser Altimeter (LOLA), in: Lunar and Planetary Science Conference, p. 1258.
- Boyd AK, Stopar JD, Robinson MS, 2014. LROC NAC Photometric Analysis: A Global Solution and Local Applications, in: Lunar and Planetary Science Conference, p. 2826.
- Brueckner GE, Howard RA, Koomen MJ, Korendyke CM, Michels DJ, Moses JD, Socker DG, Dere KP, Lamy PL, Llebaria A, Bout MV, Schwenn R, Simnett GM, Bedford DK, Eyles CJ, 1995. The Large Angle Spectroscopic Coronagraph (LASCO). Solar Physics 162, 357–402. doi: 10.1007/BF00733434. [DOI] [Google Scholar]
- Buratti B, Hicks M, Nettles J, Staid M, Pieters C, Sunshine J, Boardman J, Stone T, 2011. A wavelength-dependent visible and infrared spectrophotometric function for the moon based on rolo data. Journal of Geophysical Research: Planets 116. doi: 10.1029/2010JE003724. [DOI] [Google Scholar]
- Bussey DBJ, et al. , 2010. Illumination conditions of the south pole of the Moon derived using Kaguya topography. Icarus 208, 558–564. [Google Scholar]
- Cavanaugh J, Smith J, Sun X, Bartels A, Ramos-Izquierdo L, Krebs D, McGarry J, Trunzo R, Novo-Gradac A, Britt J, Karsh J, Katz R, Lukemire A, Szymkiewicz R, Berry D, Swinski J, Neumann G, Zuber M, Smith D, 2007. The Mercury Laser Altimeter instrument for the MESSENGER mission. Space Sci. Rev 131, 451–480. doi: 10.1007/s11214-007-9273-4. [DOI] [Google Scholar]
- Chin G, Brylow S, Foote M, Garvin J, Kasper J, Keller J, Litvak M, Mitrofanov I, Paige D, Raney K, Robinson M, Sanin A, Smith D, Spence H, Spudis P, Stern SA, Zuber M, 2007. Lunar Reconnais- sance Orbiter Overview: TheInstrument Suite and Mission. Space Science Reviews 129, 391–419. doi: 10.1007/s11214-007-9153-y. [DOI] [Google Scholar]
- Deutsch AN, Chabot NL, Mazarico E, Ernst CM, Head JW, Neumann GA, Solomon SC, 2016. Comparison of areas in shadow from imaging and altimetry in the north polar region of mercury and implications for polar ice deposits. Icarus 280, 158–171. doi: 10.1016/j.icarus.2016.06.015. [DOI] [PMC free article] [PubMed] [Google Scholar]
- Fincannon J, 2008. Lunar Polar Illumination for Power Analysis. NASA TM 215446 URL: http://www.gltrs.grc.nasa.gov/reports/2008/TM-2008-215446.pdf.
- Fisher EA, Lucey PG, Lemelin M, Greenhagen BT, Siegler MA, Mazarico E, Aharonson O, Williams JP, Hayne PO, Neumann GA, Paige DA, Smith DE, Zuber MT, 2017. Evidence for surface water ice in the lunar polar regions using reflectance measurements from the lunar orbiter laser altimeter and temperature measurements from the diviner lunar radiometer experiment. Icarus 292, 74–85. doi: 10.1016/j.icarus.2017.03.023. [DOI] [PMC free article] [PubMed] [Google Scholar]
- Gaskell R, Barnouin-Jha O, Scheeres D, Konopliv A, Mukai T, Abe S, Saito J, Ishiguro M, Kubota T, Hashimoto T, Kawaguchi J, Yoshikawa M, Shirakawa K, Kominato T, Hirata N, Demura H, 2008. Characterizing and navigating small bodies with imaging data. Meteoritics & Planetary Science 43, 1049–1061. doi: 10.1111/j.1945-5100.2008.tb00692.x. [DOI] [Google Scholar]
- Gladstone GR, Retherford KD, Egan AF, Kaufmann DE, Miles PF, Parker JW, Horvath D, Rojas PM, Versteeg MH, Davis MW, Greathouse TK, Slater DC, Mukherjee J, Steffl AJ, Feldman PD, Hurley DM, Pryor WR, Hendrix AR, Mazarico E, Stern SA, 2012. Far-ultraviolet reflectance properties of the Moon’s permanently shadowed regions. Journal of Geophysical Research: Planets 117. doi: 10.1029/2011JE003913. [DOI] [Google Scholar]
- Gladstone GR, Stern SA, Retherford KD, Black RK, Slater DC, Davis MW, Versteeg MH, Persson KB, Parker JW, Kaufmann DE, Egan AF, Greathouse TK, Feldman PD, Hurley D, Pryor WR, Hendrix AR, 2010. LAMP: The Lyman Alpha Mapping Project on NASA’s Lunar Reconnaissance Orbiter Mission. Space Science Reviews 150, 161–181. doi: 10.1007/s11214-009-9578-6. [DOI] [Google Scholar]
- Gläser P, Oberst J, Neumann G, Mazarico E, Speyerer E, Robinson M, 2017. Illumination conditions at the lunar poles: Implications for future exploration. Planetary and Space Science doi: 10.1016/j.pss.2017.07.006. [DOI] [Google Scholar]
- Gläser P, Scholten F, De Rosa D, Marco Figuera R, Oberst J, Mazarico E, Neumann GA, Robinson MS, 2014. Illumination conditions at the lunar south pole using high resolution Digital Terrain Models from LOLA. Icarus 243, 78–90. doi: 10.1016/j.icarus.2014.08013. [DOI] [Google Scholar]
- Haruyama J, Matsunaga T, Ohtake M, Morota T, Honda C, Yokota Y, Torii M, Ogawa Y, 2008. Global lunar-surface mapping experiment using the Lunar Imager/Spectrometer on SELENE. Earth, Planets and Space 60, 243–255. doi: 10.1186/BF03352788. [DOI] [Google Scholar]
- Hayne PO, Hendrix A, Sefton-Nash E, Siegler MA, Lucey PG, Retherford KD, Williams JP, Greenhagen BT, Paige DA, 2015. Evidence for exposed water ice in the Moon’s south polar regions from Lunar Reconnaissance Orbiter ultraviolet albedo and temperature measurements. Icarus 255, 58–69. [Google Scholar]
- Hu X, Shi X, Sierks H, Blum J, Oberst J, Fulle M, Kührt E, Gütler C, Gundlach B, Keller HU, Mottola S, Pajola M, Barbieri C, Lamy PL, Rodrigo R, Koschny D, Rickman H, Agarwal J, AHearn MF, Barucci MA, Bertaux JL, Bertini I, Boudreault S, Büttner I, Cremonese G, Da Deppo V, Davidsson B, Debei S, De Cecco M, Deller J, Fornasier S, Groussin O, Gutíerrez PJ, Gutíerrez-Marqúes P, Hall I, Hofmann M, Hviid SF, Ip WH, Jorda L, Knollenberg J, Kovacs, Kramm JR, Küppers M, Lara LM, Lazzarin M, Lpez-Moreno JJ, Marzari F, Naletto G, Oklay N, Richards ML, Ripken J, Thomas N, Tubiana C, Vincent JB, 2017. Thermal modelling of water activity on comet 67p/churyumov-gerasimenko with global dust mantle and plural dust-to-ice ratio. Monthly Notices of the Royal Astronomical Society 469, S295–S311. doi: 10.1093/mnras/stx1607. [DOI] [Google Scholar]
- Koeber S, Robinson M, Speyerer E, 2014. LROC Observations of Permanently Shadowed Regions on the Moon, in: Lunar and Planetary Science Conference, p. 2811.
- Kömle NI, Macher W, Tiefenbacher P, Kargl G, Pelivan I, Knollenberg J, Spohn T, Jorda L, Capanna C, Lommatsch V, Cozzoni B, Finke F, 2017. Three-dimensional illumination and thermal model of the abydos region on comet 67p/churyumov-gerasimenko. Monthly Notices of the Royal Astronomical Society 469, S2–S19. doi: 10.1093/mnras/stx561. [DOI] [Google Scholar]
- Lemelin M, Lucey P, Neumann G, Mazarico E, Barker M, Kakazu A, Trang D, Smith D, Zuber M, 2016. Improved calibration of reflectance data from the LRO Lunar Orbiter Laser Altimeter (LOLA) and implications for space weathering. Icarus 273, 315–328. doi: 10.1016/j.icarus.2016.02.006. [DOI] [Google Scholar]
- Lemoine FG, Goossens S, Sabaka TJ, Nicholas JB, Mazarico E, Rowlands DD, Loomis BD, Chinn DS, Neumann GA, Smith DE, Zuber MT, 2014. GRGM900C: A degree 900 lunar gravity model from GRAIL primary and extended mission data. Geophysical Research Letters 41, 3382–3389. doi: 10.1002/2014GL060027. [DOI] [PMC free article] [PubMed] [Google Scholar]
- Li X, Wang S, Zheng Y, Cheng A, 2008. Estimation of solar illumination on the Moon: A theoretical model. Planetary and Space Science 56, 947–950. doi: 10.1016/j.pss.2008.02.008. [DOI] [Google Scholar]
- Lucey PG, Neumann GA, Riner MA, Mazarico E, Smith DE, Zuber MT, Paige DA, Bussey DB, Cahill JT, McGovern A, Isaacson P, Corley LM, Torrence MH, Melosh HJ, Head JW, Song E, 2014. The global albedo of the Moon at 1064 nm from LOLA. Journal of Geophysical Research: Planets 119, 1665–1679. doi: 10.1002/2013JE004592. [DOI] [Google Scholar]
- Magri C, Howell ES, Vervack RJ, Nolan MC, Fernndez YR, Marshall SE, Crowell JL, 2018. SHERMAN, a shape-based thermophysical model. I. Model description and validation. Icarus 303, 203–219. doi: 10.1016/j.icarus.2017.11.025. [DOI] [Google Scholar]
- Mandt K, Mazarico E, Greathouse TK, Byron B, Retherford KD, Gladstone R, Liu Y, Hendrix AR, Hurley D, Stickle A, Wes Patterson G, Cahill J, Williams JP, 2017. LRO-LAMP Observations of Illumination Conditions in the Lunar South Pole: Multi-Dataset and Model Comparison, in: AAS/Division for Planetary Sciences Meeting Abstracts #49, p. 404.08. [Google Scholar]
- Mao D, McGarry JF, Mazarico E, Neumann GA, Sun X, Torrence MH, Zagwodzki TW, Rowlands DD, Hoffman ED, Horvath JE, Golder JE, Barker MK, Smith DE, Zuber MT, 2017. The laser ranging experiment of the lunar reconnaissance orbiter: Five years of operations and data analysis. Icarus 283, 55–69. doi: 10.1016/j.icarus.2016.07.003. lunar Reconnaissance Orbiter - Part II. [DOI] [Google Scholar]
- Margot JL, Campbell DB, Jurgens RF, Slade MA, 1999. Topography of the Lunar Poles from Radar Interferometry: A Survey of Cold Trap Locations. Science 284, 1658. [DOI] [PubMed] [Google Scholar]
- Mazarico E, Barker MK, 2018. New Developments in Modeling of Illumination Conditions, at the Moon and Beyond, in: Lunar and Planetary Science Conference, p. 2801.
- Mazarico E, Neumann G, Smith D, Zuber M, Torrence M, 2011. Illumination conditions of the lunar polar regions using lola topography. Icarus 211, 1066–1081. doi: 10.1016/j.icarus.2010.10.030. [DOI] [Google Scholar]
- Mazarico E, Neumann GA, Barker MK, Goossens S, Smith DE, Zuber MT, 2017a. Orbit determination of the lunar reconnaissance orbiter: Status after seven years. Planetary and Space Science doi: 10.1016/jpss.2017.10.004. [DOI] [PMC free article] [PubMed] [Google Scholar]
- Mazarico E, Rowlands DD, Neumann GA, Smith DE, Torrence MH, Lemoine FG, Zuber MT, 2012. Orbit determination of the Lunar Reconnaissance Orbiter. Journal of Geodesy 86, 193–207. doi: 10.1007/s00190-011-0509-4. [DOI] [Google Scholar]
- Mazarico E, Rowlands DD, Sabaka TJ, Getzandanner KM, Rubincam DP, Nicholas JB, Moreau MC, 2017b. Recovery of Bennu’s orientation for the OSIRIS-REx mission: implications for the spin state accuracy and geolocation errors. Journal of Geodesy 91, 1141–1161. doi: 10.1007/s00190-017-1058-2. [DOI] [Google Scholar]
- McGovern J, Colaprete A, Bussey D, Stickle A, 2015. Resource prospector: Landing site survey, in: Lunar Exploration Analysis Group, LPI; p. 2079. [Google Scholar]
- McGovern JA, Bussey DB, Greenhagen BT, Paige DA, Cahill JTS, Spudis PD, 2013. Mapping and characterization of non-polar permanent shadows on the lunar surface. Icarus 223, 566–581. doi: 10.1016/j.icarus.2012.10.018. [DOI] [Google Scholar]
- Mitrofanov IG, Sanin AB, Boynton WV, Chin G, Garvin JB, Golovin D, Evans LG, Harshman K, Kozyrev AS, Litvak ML, Malakhov A, Mazarico E, McClanahan T, Milikh G, Mokrousov M, Nandikotkur G, Neumann GA, Nuzhdin I, Sagdeev R, Shevchenko V, Shvetsov V, Smith DE, Starr R, Tretyakov VI, Trombka J, Usikov D, Varenikov A, Vostrukhin A, Zuber MT, 2010. Hydrogen mapping of the lunar south pole using the lro neutron detector experiment lend. Science 330, 483–486. doi: 10.1126/science.1185696. [DOI] [PubMed] [Google Scholar]
- Noda H, et al. , 2008. Illumination conditions at the lunar polar regions by Kaguya (SELENE) laser altimeter. Geophys. Res. Lett 35, L24203. [Google Scholar]
- Otten ND, Jones HL, Wettergreen DS, Whittaker WL, 2015. Planning routes of continuous illumination and traversable slope using connected component analysis, in: 2015 IEEE International Conference on Robotics and Automation (ICRA), IEEE pp. 3953–3958.
- Paige DA, Siegler MA, Harmon JK, Neumann GA, Mazarico EM, Smith DE, Zuber MT, Harju E, Delitsky ML, Solomon SC, 2013. Thermal stability of volatiles in the north polar region of mercury. Science 339, 300–303. doi: 10.1126/science.1231106. [DOI] [PubMed] [Google Scholar]
- Paige DA, Siegler MA, Zhang JA, Hayne PO, Foote EJ, Bennett KA, Vasavada AR, Greenhagen BT, Schofield JT, McCleese DJ, Foote MC, DeJong E, Bills BG, Hartford W, Murray BC, Allen CC, Snook K, Soderblom LA, Calcutt S, Taylor FW, Bowles NE, Bandfield JL, Elphic R, Ghent R, Glotch TD, Wyatt MB, Lucey PG, 2010a. Diviner Lunar Radiometer Observations of Cold Traps in the Moon’s South Polar Region. Science 330, 479–482. doi: 10.1126/science.1187726. [DOI] [PubMed] [Google Scholar]
- Paige DA, et al. , 2010b. Diviner Lunar Radiometer observations of cold traps in the Moon’s south polar region. Science 330, 479–482. [DOI] [PubMed] [Google Scholar]
- Patterson G, Stickle A, Turner F, Jensen J, Bussey D, Spudis P, Espiritu R, Schulze R, Yocky D, Wahl D, Zimmerman M, Cahill J, Nolan M, Carter L, Neish C, Raney R, Thomson B, Kirk R, Thompson T, Tise B, Erteza I, Jakowatz C, 2017. Bistatic radar observations of the Moon using Mini-RF on LRO and the Arecibo Observatory. Icarus 283, 2–19. doi: 10.1016/j.icarus.2016.05.017. [DOI] [Google Scholar]
- Robinson MS, Brylow SM, Tschimmel M, Humm D, Lawrence SJ, Thomas PC, Denevi BW, Bowman-Cisneros E, Zerr J, Ravine MA, Caplinger MA, Ghaemi FT, Schaffner JA, Malin MC, Mahanti P, Bartels A, Anderson J, Tran TN, Eliason EM, McEwen AS, Turtle E, Jolliff BL, Hiesinger H, 2010. Lunar Reconnaissance Orbiter Camera (LROC) Instrument Overview. Space Science Reviews 150, 81–124. doi: 10.1007/s11214-010-9634-2. [DOI] [Google Scholar]
- Sato H, Robinson MS, Hapke B, Denevi BW, Boyd AK, 2014. Resolved Hapke parameter maps of the Moon. Journal of Geophysical Research: Planets 119, 1775–1805. doi: 10.1002/2013JE004580. [DOI] [Google Scholar]
- Shkuratov Y, Kreslavsky M, Stankevich D, 1997. On the lunar opposition spike observed by Clementine: New results, in: Lunar and Planetary Science Conference, p. 1307.
- Smith DE, Zuber MT, Neumann GA, Lemoine FG, Mazarico E, Torrence MH, McGarry JF, Rowlands DD, Head JW, Duxbury TH, Aharonson O, Lucey PG, Robinson MS, Barnouin OS, Cavanaugh JF, Sun X, Liva P, Mao D, Smith JC, Bartels AE, 2010. Initial observations from the Lunar Orbiter Laser Altimeter (LOLA). Geophys. Res. Lett 37. doi: 10.1029/2010GL043751. [DOI] [Google Scholar]
- Smith DE, Zuber MT, Neumann GA, Mazarico E, Lemoine FG, Head JW, Lucey PG, Aharonson O, Robinson MS, Sun X, Torrence MH, Barker MK, Oberst J, Duxbury TC, Mao D, Barmouin OS, Jha K, Rowlands DD, Goossens S, Baker D, Bauer S, Glaeser P, Lemelin M, Rosenburg M, Sori MM, Whitten J, McClanahan TP, 2017. Summary of the Results from the Lunar Orbiter Laser Altimeter after Seven Years in Lunar Orbit. Icarus 283, 70–91. doi: 10.1016/j.icarus.2016.06.006. [DOI] [Google Scholar]
- Speyerer E, Robinson M, 2013. Persistently illuminated regions at the lunar poles: Ideal sites for future exploration. Icarus 222, 122–136. doi: 10.1016/j.icarus.2012.10.010. [DOI] [Google Scholar]
- Stubbs TJ, Glenar DA, Wang Y, McClanahan TP, Myers DC, Keller JW, LRO Project Science Team, 2016. Searching for Lunar Horizon Glow with the LRO Star Tracker Cameras, in: Lunar and Planetary Science Conference, p. 2851.
- Tangelder H, Fabri A, 2018. dD spatial searching, in: CGAL User and Reference Manual. 4.12 ed.. CGAL Editorial Board. [Google Scholar]
- The CGAL Project, 2018. CGAL User and Reference Manual. 4.12 ed., CGAL Editorial Board. [Google Scholar]
- Tye A, Fassett C, Head J, Mazarico E, Basilevsky A, Neumann G, Smith D, Zuber M, 2015. The age of lunar south circumpolar craters Haworth, Shoemaker, Faustini, and Shackleton: Implications for regional geology, surface processes, and volatile sequestration. Icarus 255, 70–77. doi: 10.1016/j.icarus.2015.03.016 lunar Volatiles. [DOI] [Google Scholar]
- Watson K, Murray B, Brown H, 1961. The behavior of volatiles on the lunar surface. Journal of Geophysical Research 66, 3033–3045. doi: 10.1029/JZ066i009p03033. [DOI] [Google Scholar]
- Williams J, Boggs D, Folkner W, 2008. DE421 lunar orbit, physical librations, and surface coordinates, JPL IOM 335-JW, DB. Technical Report. WF-20080314–001, March 14.
- Zuber MT, et al. , 2012. Constraints on the volatile distribution within Shackleton crater at the lunar south pole. Nature 486, 378–381. [DOI] [PubMed] [Google Scholar]


