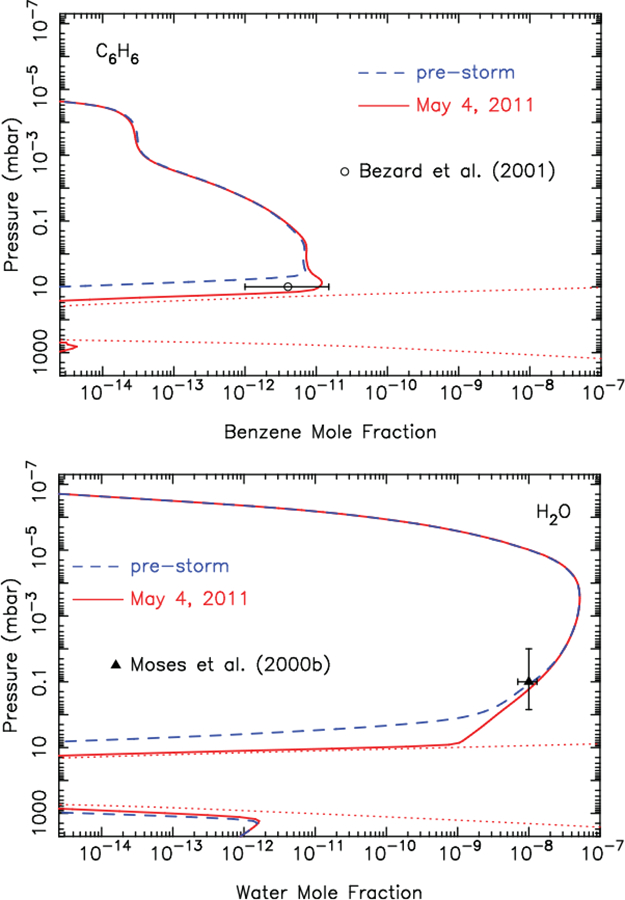
Figure 11:

The mole-fraction profile for benzene (top) and water (bottom) in our pre-storm model (blue dashed line) and in the hot beacon-core model for May 4, 2011 (red solid line). The red dotted lines represents the saturation vapor density curve for temperatures relevant to the May 4, 2011 CIRS observations. The data points with error bars are from ISO observations: C6H6 from Bézard et al. (2001) and H2O from Moses et al. (2000b).
