

Abstract
Dysfunction of the homeostasis‐maintaining systems in specific cell types or tissues renders the organism susceptible to a range of diseases, including cancers. One of the emerging mechanisms for maintaining tissue homeostasis is cellular senescence. Here, we report that the Hippo pathway plays a critical role in controlling the fate of ovarian cells. Hyperactivation of Yes‐associated protein 1 (YAP1), the major effector of the Hippo pathway, induces senescence in cultured primary human ovarian surface epithelial cells (hOSEs). Large tumor suppressor 2 (LATS2), the primary upstream negative regulator of YAP1, is elevated in both YAP1‐induced and natural replicative‐triggered senescence. Deletion of LATS2 in hOSEs prevents these cells from natural replicative and YAP1‐induced senescence. Most importantly, loss of LATS2 switches ovarian cells from YAP‐induced senescence to malignant transformation. Our results demonstrate that LATS2 and YAP1, two major components of the Hippo/YAP signaling pathway, form a negative feedback loop to control YAP1 activity and prevent ovarian cells from malignant transformation. Human cancer genomic data extracted from TCGA datasets further confirm the clinical relevance of our finding.
Keywords: cellular senescence, the Hippo pathway, tissue homeostasis, tumorigenesis, YAP1‐LATS2 feedback loop
Subject Categories: Autophagy & Cell Death, Cancer, Signal Transduction
Introduction
The Hippo signaling pathway is an evolutionarily conserved pathway that controls development and tumorigenesis through regulating cell proliferation, survival, differentiation, and stem cell self‐renewal 1, 2. The core of the canonical Hippo pathway is a kinase cascade consisting of mammalian STE20‐like protein kinase 1/2 (MST1/2) and large tumor suppressor kinase 1/2 (LATS1/2), as well as their co‐activators and scaffold proteins. Upon activation, MST1/2 and Salvador homolog 1 (Sav1) form the first kinase complex, which phosphorylates LATS1/2. Phosphorylated LATS1/2 forms the second kinase complex with activated MOB kinase activator 1A (MOB1A), resulting in phosphorylation of growth‐promoting transcriptional co‐activator Yes‐associated protein 1 (YAP1, or more commonly YAP) and WW domain containing transcription regulator 1 (WWTR1 or more commonly TAZ). Phosphorylation of YAP and TAZ leads to their cytoplasmic retention and ubiquitination‐dependent degradation 3, 4, 5. Non‐phosphorylated YAP/TAZ translocate from the cytoplasm into the nucleus and bind to transcription factors such as TEADs and KLF4 to drive expression of a wide range of genes that are involved in cell proliferation, survival, and stem cell renewal. Therefore, the physiological output of this pathway is to restrict the activities of YAP/TAZ co‐activators 6, 7, 8.
A role for the Hippo/YAP pathway in tumorigenesis has been reported frequently 2, 3, 6, 8, 9, 10, 11, 12, 13, 14, 15. Overall, the upstream core kinases of the Hippo pathway are tumor suppressors, while the major downstream effectors, YAP1/TAZ, have been described as oncoproteins 2, 4, 11. Elevated YAP expression has been observed in many types of human cancers, including cancer of lung, liver, ovary, cervix, colon, and others 1, 6, 9, 16, 17, 18, 19, 20, 21, 22. Consistently, the upstream tumor suppressors of the Hippo pathway, such as NF2 and LATS1/2, are frequently deleted or mutated in many malignancies 23, 24. Although mutations of YAP/TAZ are rare, a recent study reported that a germline point mutation of YAP (R331W) is correlated with a significantly higher incidence of lung carcinomas 25. Multidimensional analyses of human cancer patient genomic data extracted from The Cancer Genome Atlas (TCGA) also suggest that the Hippo/YAP pathway is frequently altered in many types of cancers 26. However, the molecular mechanism by which the Hippo/YAP signaling pathway contributes to the malignant transformation is still unclear.
Our previous studies showed that YAP, the major effector of the Hippo signaling pathway, is overexpressed and highly activated in ovarian cancer cells 22, 27. Using immortalized cell lines and xenograft mouse models, our recent research indicates that YAP interacts with EGFR signaling pathway to induce tumorigenesis of ovarian surface epithelial cells (OSE) 21. Our data also demonstrate that the Hippo/YAP pathway interacts with FGF signaling pathway to form a positive feedback loop to drive the malignant transformation of fallopian tube secretory epithelial cells (FTSECs) 9, which have been implicated as a cell of origin of ovarian high‐grade serous carcinoma. In efforts to further explore the molecular mechanisms by which the Hippo/YAP pathway regulates ovarian cell transformation, we ectopically expressed constitutively active YAP (YAPS127A) in primary human ovarian surface epithelial (hOSE) cells and ovarian granulosa cells (GCs). Surprisingly, we found that hyperactivation of YAP induces senescence in these primary cells. Our subsequent mechanistic studies indicate that the Hippo/YAP signaling pathway, via a YAP1‐LATS2 negative feedback system, serves as a switch between YAP‐induced cellular senescence and tumorigenesis.
Results
YAP regulates growth of cultured primary human ovarian surface epithelial (hOSE) cells
Our recent studies show that suppression of Hippo signaling or activation of YAP promotes proliferation and induces malignant transformation of immortalized epithelial cell lines in vitro and in vivo 9, 22, 26, 27. To investigate the function of the Hippo/YAP pathway in normal human ovarian surface epithelial cells, we used YAP1 siRNA to knock down YAP protein in cultures of primary human ovarian surface epithelial (hOSE) cells. Non‐targeting siRNA (si‐Ctrl) was used as a control. Western blot analysis indicated that YAP siRNA successfully reduced YAP protein in hOSE cells (Fig 1A). However, knockdown of YAP protein did not affect proliferation of hOSE cells within 4 days. Since recent studies suggested a compensatory effect of TAZ (a homolog of YAP gene) in YAP‐depleted cells 28, we knocked down both YAP and TAZ protein in hOSE cells to examine their effects on cell proliferation. We found that knockdown of either YAP or TAZ did not significantly change proliferation of hOSE cells. However, YAP and TAZ double knockdown significantly reduced the number of hOSE cells (Fig 1B).
Figure 1. Ectopic expression of YAP or constitutively active YAP induces arrest of cell growth in cultured primary human ovarian surface epithelial cells (hOSE).
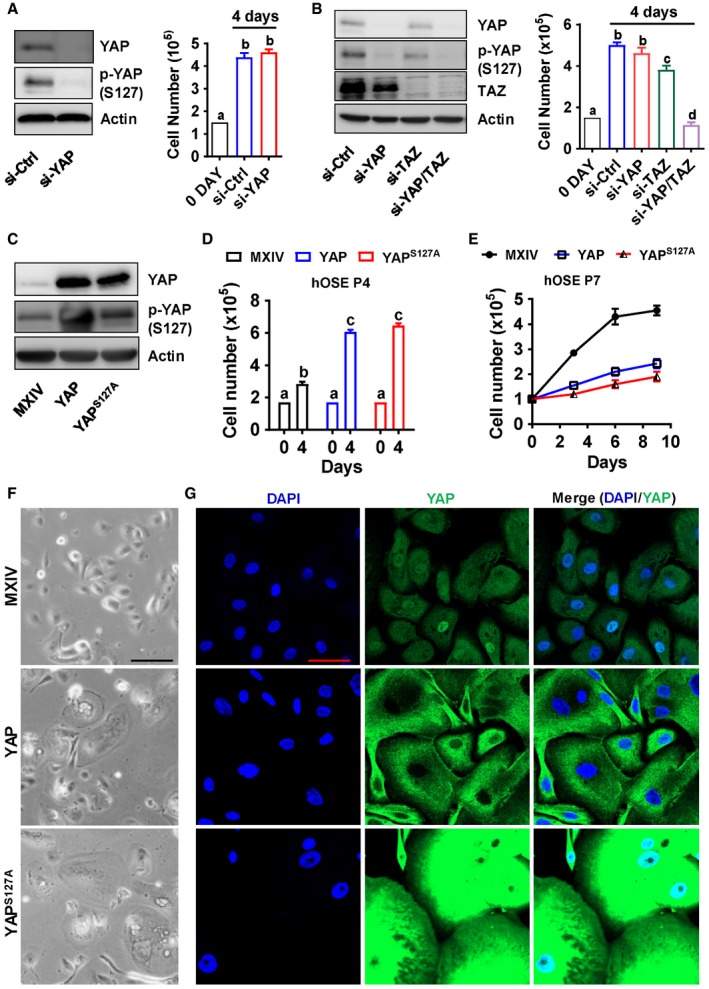
- Left panel: Representative blots showing protein levels of YAP and phosphorylated YAP (Ser127) in control (si‐Ctrl) and YAP knockdown (si‐YAP) hOSEs. Protein levels were detected by Western blotting. β‐Actin was used as a protein loading control. Right panel: Cell proliferation (cell number) in control (si‐Ctrl) and YAP knockdown (si‐YAP) hOSE cells. Each bar represents the mean ± SEM (n = 8). Bars with different letters are significantly different from each other (P < 0.01).
- Left panel: Representative blots showing protein levels of YAP and phosphorylated YAP (Ser127) in control (si‐Ctrl), YAP knockdown (si‐YAP), TAZ knockdown (si‐TAZ), and YAP/TAZ double knockdown (si‐YAP/TAZ) hOSE Cells. β‐Actin was used as a protein loading control. Right panel: Cell proliferation (cell number) of control (si‐Ctrl), YAP knockdown (si‐YAP), TAZ knockdown (si‐TAZ), and YAP/TAZ double knockdown (si‐YAP & si‐TAZ) hOSE cells. Each bar represents the mean ± SEM (n = 6). Bars with different letters are significantly different from each other (P < 0.05).
- Representative blots showing protein levels of YAP and phosphorylated YAP (Ser127) in control hOSEs (MXIV) and hOSEs expressing wild‐type YAP (YAP) or constitutively active YAP (YAPS127A). Cells were collected at passage 4. β‐Actin was used as a protein loading control.
- Growth of hOSE‐MXIV, hOSE‐YAP, and hOSE‐YAPS127A cells at passage 4. Each bar represents mean ± SEM of four independent samples. Bars with different letters are significantly different from each other (P < 0.001).
- Growth curves of hOSE‐MXIV, hOSE‐YAP, and hOSE‐YAPS127A cells at passage 7. Each point represents mean ± SEM of four independent samples.
- Representative images showing the morphologic changes of hOSE‐MXIV, hOSE‐YAP, and hOSE‐YAPS127A cells at passage 7. Scale bar: 50 μm.
- Representative images showing expression and location of YAP in hOSE‐MXIV, hOSE‐YAP, and hOSE‐YAPS127A cells at passage 7. YAP was visualized using an Alexa‐488 (green)‐conjugated secondary antibody. Nuclei were stained with DAPI. Scale bar: 50 μm.
To further study the role of YAP in normal hOSE cells, we established three cell lines with differential YAP protein levels and activities, including hOSE‐MXIV cells (transfected with control vector MXIV), hOSE‐YAP cells (transfected with a vector expressing wild‐type YAP), and hOSE‐YAPS127A cells (transfected with a vector expressing YAPS127A, a constitutively active form of YAP). As shown in Fig 1C, YAP and YAPS127A were successfully overexpressed in hOSE cells. We observed that ectopic expression of YAP or YAPS127A promoted cell proliferation over the course of four passages (two passages after transfection) (Fig 1D). However, YAP‐ and YAPS127A‐overexpressing cells almost stopped proliferation after seven passages (five passages after transfection, Fig 1E). BrdU cell proliferation assay also showed that hyperactivation of YAP in the 7th passage hOSEs significantly reduced BrdU incorporation (Appendix Fig S1), suggesting that hyperactivation of YAP1 suppressed DNA synthesis of the primary hOSE cells. The size of YAP‐ and YAPS127A‐overexpressing cells increased as observed using light microscope (Fig 1F). Fluorescent immunohistochemistry indicated that YAP levels in YAP and YAPS127A expressing cells dramatically increased compared to control cells. In control and hOSE‐YAPS127A cells, YAP protein was localized to both nuclei and cytoplasm (Fig 1G). In hOSE‐YAP cells, YAP was primarily localized to cytoplasm. Moreover, YAP and DAPI staining indicated that the size of nuclei in hOSE‐YAP and hOSE‐YAPS127A cells was markedly increased. In addition, many multinucleated cells were observed in hOSE‐YAP and hOSE‐YAPS127A cells (Fig 1G).
Hyperactivation of YAP induced cellular senescence in primary hOSE cells
The phenotype of hOSE‐YAP and hOSE‐YAPS127A cells is appeared to be similar to senescent cells which have lost their proliferative capacity 29. Senescence‐associated β‐galactosidase (SA‐β‐gal) staining indicated that the percentage of SA‐β‐gal‐positive cells in control group was very low at passage seven. In contrast, about 60% of hOSE‐YAP cells and 80% of hOSE‐YAPS127A cells were SA‐β‐gal positive (Fig 2A and B) at passage seven, suggesting that hOSE‐YAP and hOSE‐YAPS127A cells were undergoing senescence.
Figure 2. YAP induces cellular senescence in cultured primary human OSE cells.
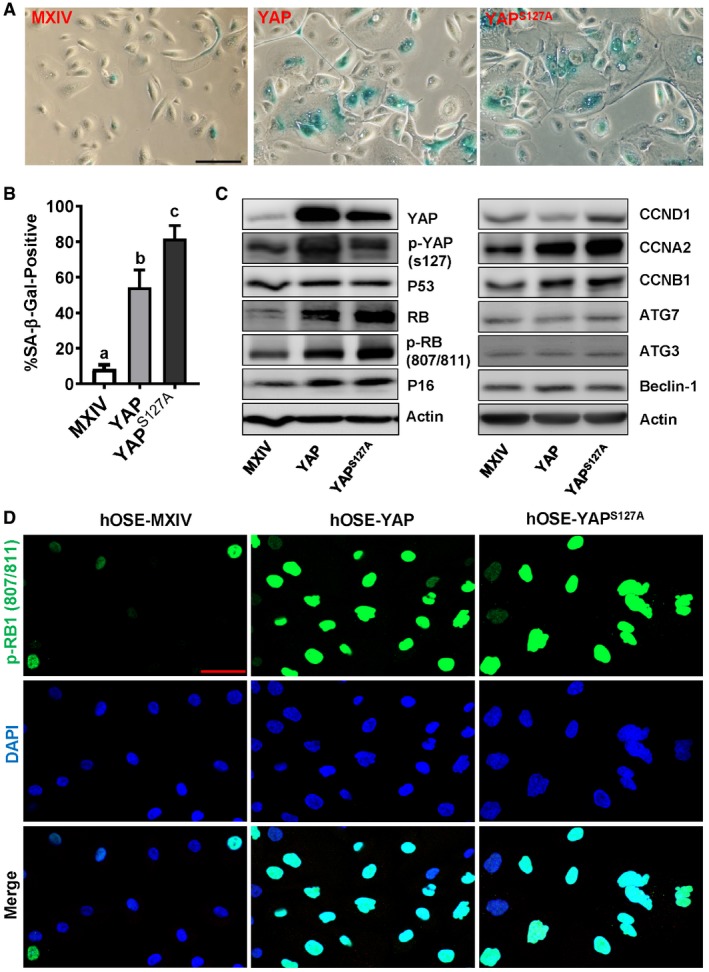
- Representative images showing SA‐β‐gal staining in hOSE‐MXIV, hOSE‐YAP, and hOSE‐YAPS127A cells at passage 7. Scale bar: 50 μm.
- Quantitative data showing the ratio of SA‐β‐gal‐positive cells in hOSE‐MXIV, hOSE‐YAP, and hOSE‐YAPS127A cells. Each bar represents the mean ± SEM (n = 6). Bars with different letters are significantly different from each other (P < 0.05). Data were analyzed for significance using one‐way ANOVA with Tukey's post hoc tests.
- Representative blots showing expression of key proteins associated with cell cycle arrest in hOSE‐MXIV, hOSE‐YAP, and hOSE‐YAPS127A cells analyzed using Western blotting at the 7th passage. β‐Actin was used as a protein loading control.
- Representative images showing expression and location of phosphorylated pRB (807/811) in hOSE‐MXIV, hOSE‐YAP, and hOSE‐YAPS127A cells at the 7th passage. Phosphorylated pRB (807/811) was visualized using an Alexa‐488 (green)‐conjugated secondary antibody. Nuclei were stained with DAPI (blue). Scale bar: 50 μm. Each experiment was repeated at least three times.
Source data are available online for this figure.
Formation of senescence‐associated heterochromatin foci (SAHF) is another characteristic of cells undergoing oncogene‐induced or replicative senescence. We found that macroH2A and H3K9Me3, two markers of SAHF, were accumulated and formed foci in hOSE‐YAP and hOSE‐YAPS127A cells, while their immunosignals were relatively weaker and formed fewer foci in control cells (Fig EV1).
Figure EV1. YAP1 induced senescence‐associated heterochromatin foci (SAHF) in hOSE cells.
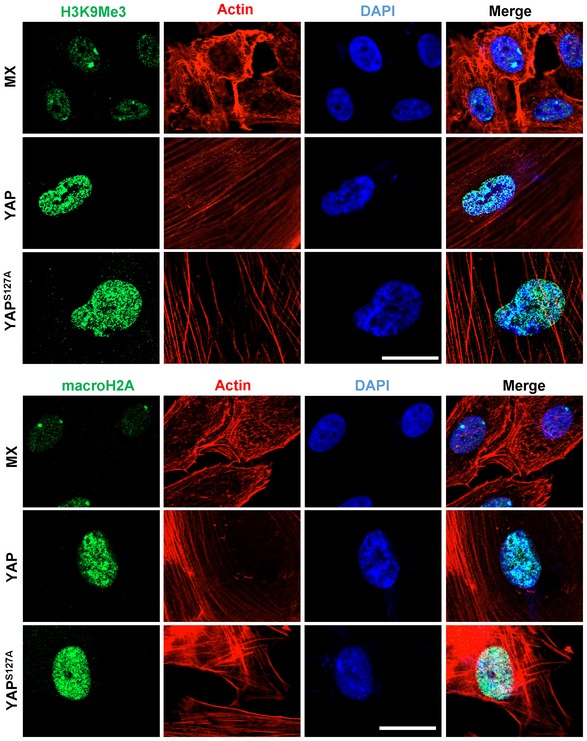
Representative images showing the expression of H3K9Me3 and macroH2A in the seventh passage hOSE cells transfected with empty (MX), wild‐type YAP (YAP), or constitutively active YAP (YAPS127A) vectors. H3K9Me3 and macroH2A were visualized by an Alexa‐488‐conjugated secondary antibody (green). Actin filaments were stained with rhodamine‐phalloidin (red). Scale bar = 20 μm.
Cell cycle arrest is a major feature of senescent cells. To further confirm our results, the expression of several key cell cycle regulatory proteins in control and YAP‐overexpressing cells was examined. Compared to the control cells, hOSE‐YAP and hOSE‐YAPS127A cells have elevated levels of RB1 and p16. However, ectopic expression of YAP or constitutively active YAP had no obvious effect on the level of p53 protein in hOSE cells. Increases in the levels of phosphorylated RB, cyclin A, and cyclin B were also observed in hOSE‐YAP and hOSE‐YAPS127A cells. Although YAP up‐regulated cyclin D1 in several immortalized or cancerous cells 30, it did not affect cyclin D1 expression in hOSE cells (Fig 2C). Confocal immunofluorescent microscopy indicated that hOSE‐YAP and hOSE‐YAPS127A cells had higher level of phosphorylated RB (807/811), which was mainly co‐localized with DAPI in the nucleus. These data suggest that ectopic expression of YAP induced cell cycle arrest in primary cells (Fig 2D). Although morphology of hOSE‐YAP and hOSE‐YAPS127A cells also displayed some features normally attributed to OSE cells undergoing autophagy, our immunoblotting results showed that expressions of ATG3, ATG7, and Beclin‐1, three well‐characterized cell autophagy regulatory proteins, were not affected by ectopic expression of YAP and YAPS127A (Fig 2C). These results provide evidence to suggest that hyperactivation of YAP in hOSE cells induced cell growth arrest and cellular senescence.
It is known that senescent cells are metabolically active and have a senescence‐associated secretory phenotype (SASP). Under physiological or pathophysiological conditions, SASP factors produced by the senescent cells affect surrounding cells and induce cell proliferation, inflammation, tissues repair, and angiogenesis. We examined mRNA expressions of several known SASP factors (bFGF/FGF2, VEGFα, IL‐6 and IL‐8, CTGF, and hbEGF) in hOSE‐MX, hOSE‐YAP, and hOSE‐YAPS127A at their seventh passages. The results showed that all examined SASP factors were up‐regulated in passage 7 hOSE‐YAP and hOSE‐YAPS127A cells (Fig EV2A). These results further confirmed that hyperactivation of YAP induced cellular senescence in primary hOSE cells. Consistent with these observations, we found that YAP target genes such as AREG, CCNE1, ERBB3, and MYC were up‐regulated by hyperactivation of YAP1 in passage 4, but not passage 7 hOSEs, suggesting that the transcriptional activity of YAP1 is also altered in the pre‐senescent or senescent hOSEs (Fig EV2B).
Figure EV2. YAP induced cellular senescence in hOSE cells.
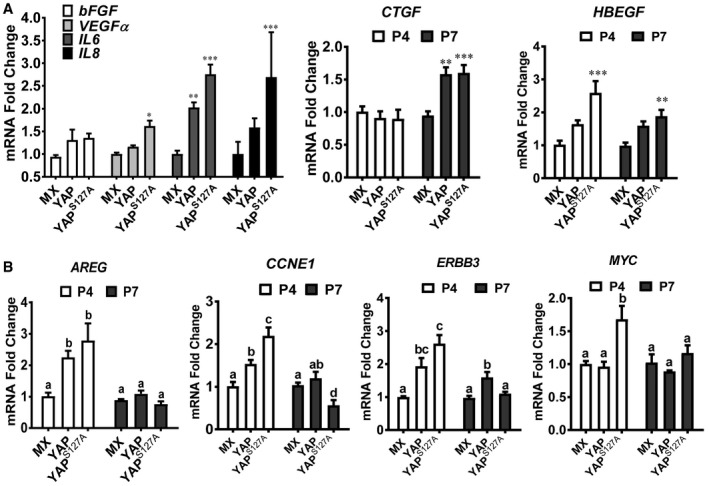
- Relative mRNA levels of SASP factors (FGF2, VEGFA, IL‐6, IL‐8, CTGF, and HBEGF) in hOSE‐MX cells (hOSEs transfected with empty MXIV vectors), hOSE‐YAP cells (hOSEs transfected with vectors expressing wild‐type YAP), and hOSE‐YAPS127A cells (hOSEs transfected with vectors expression constitutively active YAP, indicated as YAPS127A) at their 7th passage. Relative mRNA levels of CTGF and HBEGF in these cells at their 4th passage were also presented. Data were normalized with mRNA levels of GAPDH. Each bar represents mean ± SEM (n = 4). *P < 0.05, **P < 0.01, ***P < 0.001, compared to the MX control cells in the same group.
- mRNA expressions of YAP1 target genes (CCNE1, MYC, ERBB3, and HBEGF) in hOSE‐MX cells, hOSE‐YAP cells, and hOSE‐YAPS127A cells at their 4th and 7th passages. Data were normalized with mRNA level of GAPDH. Each bar represents mean ± SEM (n = 4). Bars with different letters are significantly different from each other.
To examine whether YAP can induce senescence in other cell types, we repeated above experiments in primary cultures of human umbilical vein endothelial cells (HUVEC), human ovarian granulosa cells (hGC), and human ovarian microvascular endothelial cells (HOMEC). HUVEC cells transfected with vectors expressing wild‐type YAP (HUVEC‐YAP) or vectors expressing constitutively active YAP (HUVEC‐YAPS127A) proliferated significantly slower than control cells (HUVEC‐MXIV, transfected with empty MXIV vectors) (Appendix Fig S2A and B). Like hOSE‐YAP and hOSE‐YAPS127A cells, HUVEC‐YAP and HUVEC‐YAPS127A cells also exhibit senescent cellular morphology, which is indicated by enlargement and flattening of cells in culture dishes (Appendix Figs S2B and S3A–C), appearance of multinucleated cells (Appendix Fig S2B ), heterogeneous cell nuclei (Appendix Fig S2B), as well as significantly increased SA‐β‐galactosidase activity (Appendix Fig S3C and D). Moreover, ectopic expression of constitutively active YAP suppressed tubule formation of cultured HUVEC cells (Appendix Fig S3E and F), perhaps due to the senescence of HUVEC cells. Similar results were observed in human ovarian microvascular endothelial (HOMEC) cells (Appendix Fig S4A and B) and human ovarian granulosa cells (Appendix Fig S4C). These results indicate that hyperactivation of YAP can induce senescence in different types of human cells, not only in hOSE cells.
Human papillomavirus E6/E7 oncoproteins prevent hOSE cells from YAP‐induced cellular senescence
Our previous studies showed that YAP promoted proliferation and induced malignant transformation in HOSE‐T80, an immortalized human ovarian surface epithelial cell line 22. Since HOSE‐T80 cells ectopically express HPV oncoproteins E6/E7, we speculate that E6/E7 protein is able to prevent human OSE cells from YAP‐induced cellular senescence. To test this hypothesis, we transfected hOSE‐MXIV, hOSE‐YAP, and hOSE‐YAPS127A cells with a lentivirus‐based vector expressing HPV16 E6/E7 proteins. Previous studies demonstrate that HPV E6 and E7 proteins regulate the cell cycle progression via suppressing TP53 and RB1, respectively 31, 32, 33. Consistently, Western blot analysis showed that ectopic expression of HPV E6/E7 in these cells markedly reduced p53 and RB1 protein levels (Fig 3A), indicating that E6/E7 were successfully expressed in these cells. Expression of E6/E7 blocked YAP‐induced cell cycle arrest in hOSE cells. In E6/E7 expression hOSE cells, both YAP and YAPS127A promoted cell proliferation, even after nine passages (Fig 3B). Importantly, in HPV E6/E7 expressing hOSE cells, neither YAP nor YAPS127A induced senescence‐associated morphological changes (Fig 3C). In addition, expression of HPV E6/E7 almost totally blocked the YAP‐ or YAPS127A‐induced increase in SA‐β‐gal‐positive cells (Fig 3C and D). These results indicate that HPV‐E6/E7 assists hOSE cells to escape from YAP‐induced cellular senescence. In our culture system, hOSE cells gradually stop proliferation and become senescent after thirteen passages. Expression of HPV E6/E7 in hOSE cells was also able to prevent these cells from natural replicative senescence (Fig 3E). Similarly, HPV E6/E7 protein prevented YAP‐induced senescence in cultures of the primary human umbilical vein endothelial cells (Appendix Fig S5).
Figure 3. HPV E6/E7 oncoproteins prevent hOSEs from YAP‐induced senescence.
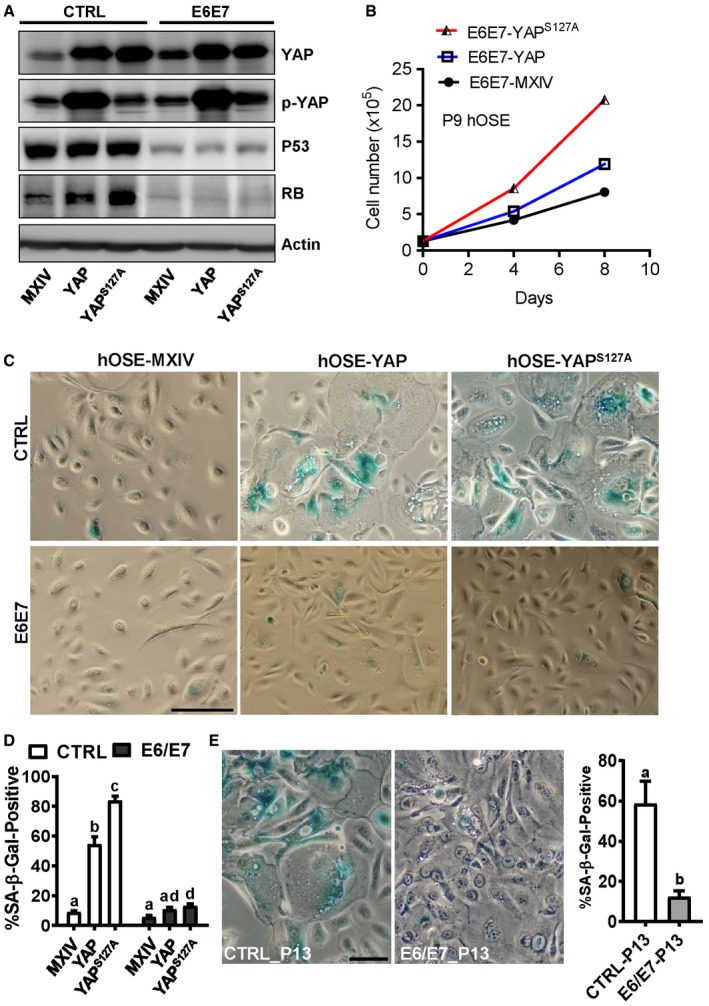
- Representative blots showing expression of TP53 and RB1 expression in hOSE‐MXIV, hOSE‐YAP, and hOSE‐YAPS127A cells in the presence or absence of HPV E6/E7 oncoproteins at the 7th passage. β‐Actin was used as a protein loading control.
- Growth curves of hOSE‐MXIV, hOSE‐YAP, and hOSE‐YAPS127A cells in the presence of HPV E6/E7 oncoproteins at the 9th passage. Each point represents mean ± SEM of four independent samples.
- Representative images showing SA‐β‐gal staining in hOSE‐MXIV, hOSE‐YAP, and hOSE‐YAPS127A cells in the presence or absence of HPV E6/E7 oncoproteins at the 7th passage. Scale bar: 50 μm.
- Quantitative data showing the ratio of SA‐β‐gal‐positive cells in hOSE‐MXIV, hOSE‐YAP, and hOSE‐YAPS127A cells in the presence or absence of HPV E6/E7 oncoproteins. Each bar represents the mean ± SEM (n = 6). Bars with different letters are significantly different from each other (P < 0.01).
- Representative images showed SA‐β‐gal staining in cultured primary hOSE cells in the presence or absence of HPV E6/E7 oncoproteins. Cells were collected and stained at the 13th passage. Scale bar: 25 μm. Right graph showing the ratio of SA‐β‐gal‐positive cells in P13 hOSE cells transfected with empty vectors (CTRL‐P13) or vectors expressing E6/E7 oncoproteins (E6/E7‐P13). Each bar represents the mean ± SEM (n = 4). Bars with different letters are significantly different from each other (P < 0.05).
RB1 pathway is involved in YAP‐induced cellular senescence
As mentioned, HPV E6 and E7 proteins regulate the cell cycle progression via suppressing protein levels of TP53 and RB1 31, 32, 33. Consistently, we observed drastic reduction of TP53 and RB1 in E6/E7‐transfected hOSE cells (Fig 3A). Intriguingly, we found that overexpression or constitutive activation of YAP in hOSE cells significantly increased protein level of RB1, but not TP53 (Fig 3A), indicating that RB1 may be involved in YAP‐induced cell cycle arrest. RB1 was then knocked down in hOSE cells using lentivirus‐based RB1 shRNAs to examine its potential role in YAP‐induced senescence. Non‐targeting shRNA was used as a control (shCtrl). Western blot analysis demonstrated that RB1 shRNAs successfully reduced RB1 protein level in hOSE‐YAP and hOSE‐YAPS127A cells (Fig 4A). Similar to ectopic expression of E6/E7, knockdown of RB1 also reversed YAP‐ and YAPS127A‐induced cell growth arrest in hOSE cells, even after nine passages (Fig 4B). Consistently, knockdown of RB1 also blocked YAP‐induced morphology change in hOSE cells (Fig 4C) and reduced YAP‐ or YAPS127A‐induced SA‐β‐galactosidase activity in hOSE cells (Fig 4C). These results clearly indicate that loss of RB1 can prevent YAP‐induced senescence. Interestingly, although TP53 was not up‐regulated by YAP in these cells, knockdown of TP53 still partially blocked YAP‐ and YAPS127A‐induced SA‐β‐gal staining in hOSE cells (Fig 4C, Appendix Fig S6).
Figure 4. Involvement of RB1 signaling pathways in YAP‐induced senescence.
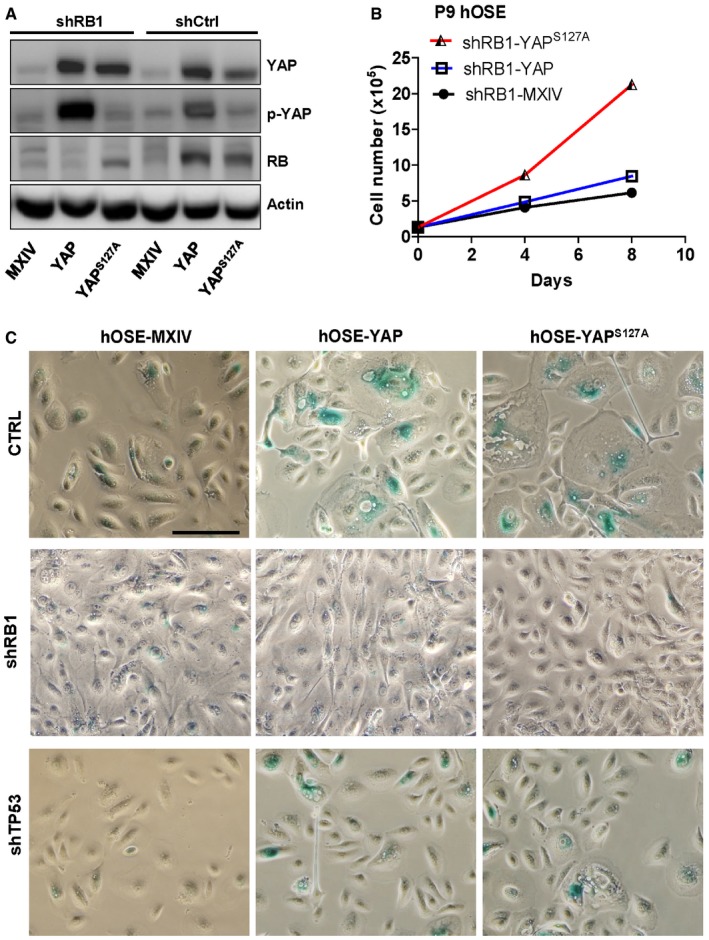
- Representative blots showing the expression of YAP and RB1 in hOSE‐MXIV, hOSE‐YAP, and hOSE‐YAPS127A cells with or without pRB knockdown. Cells were collected at the 7th passage, and protein levels were analyzed using Western blotting. β‐Actin was used as a protein loading control.
- Growth curves of hOSE‐MXIV, hOSE‐YAP, and hOSE‐YAPS127A cells after RB1 knockdown. Each point represents mean ± SEM of four independent samples.
- Representative images showing SA‐β‐gal staining in the hOSE‐MXIV, hOSE‐YAP, and hOSE‐YAPS127A cells with or without RB1 or TP53 knockdown. Cells were collected at the 7th passage. Scale bar: 50 μm.
Source data are available online for this figure.
LATS2 is a critical regulator of natural replicative senescence
To further elucidate the mechanism underlying YAP induction of cellular senescence, we compared changes of YAP expression and localization in hOSE cells during YAP‐induced cellular senescence and natural replicative senescence. In hOSE‐MXIV control cells (at the 7th passages), YAP immunosignal in nuclear was relatively higher than that in cytoplasm (Fig EV3A). However, in YAP‐induced senescent hOSE cells, YAP immunosignal was primarily localized to the cytoplasm. Importantly, in the senescent hOSE‐YAPS127A cells, which express constitutively active type of YAPS127A (nuclear YAP), we also detected relatively strong YAP immunosignal in the cytoplasm (Fig EV3A). These observations suggest that Hippo pathway might be activated during YAP‐induced cellular senescence, leading to cytoplasm retention of YAP protein. Consistent with this, YAP protein was localized to both nuclei and cytoplasm of hOSE cells at the 4th passage, but predominantly to cytoplasm of senescent hOSE cells at the 13th passage (Fig EV3B). Taken together, these data suggest that the Hippo pathway may be activated during YAP induction of senescence, and the activity of YAP protein is suppressed during YAP‐induced and natural replicative senescence.
Figure EV3. YAP activity was suppressed in senescent cells.
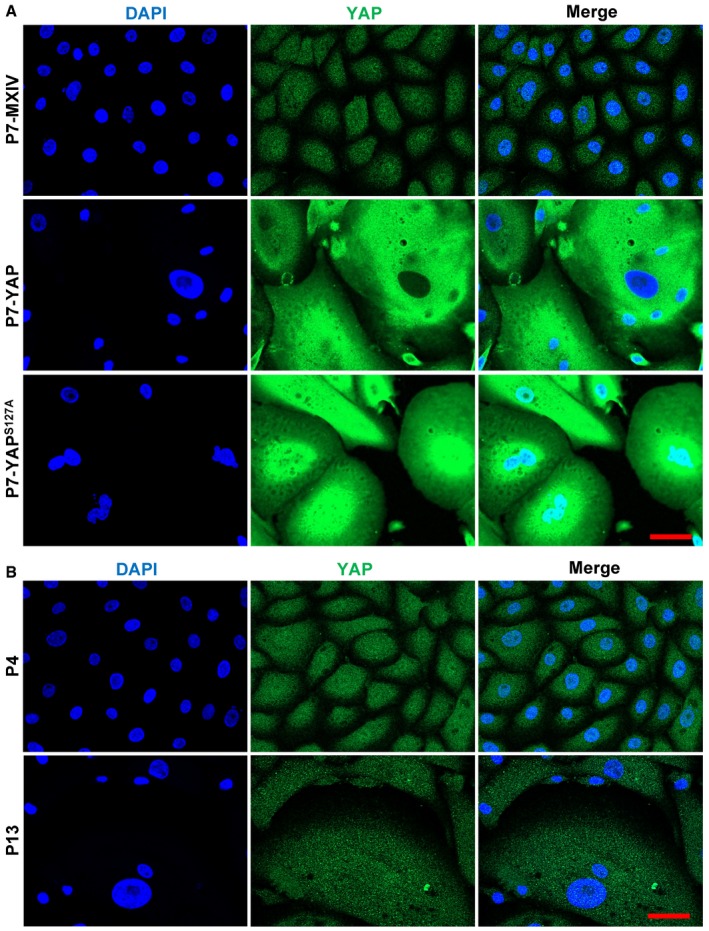
- Representative images showing the expression and location of YAP in hOSE‐MXIV, hOSE‐YAP, and hOSE‐YAPS127A cells at the 7th passage (P7). Scale bar = 20 μm.
- Representative images showing the expression and location of YAP in hOSE cells at the 4th (P4) and 13th (P13) passages. YAP was visualized using an Alexa‐488 (green)‐conjugated secondary antibody. Nuclei were stained with DAPI (blue). Scale bar = 20 μm.
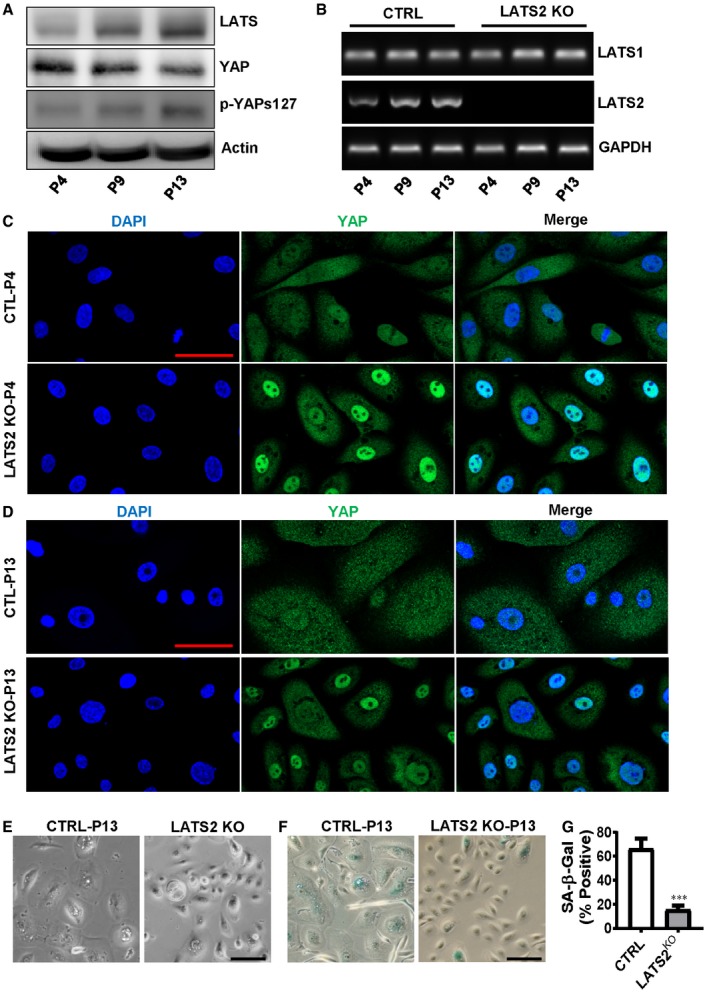
To confirm the involvement of the Hippo pathway in the replicative and YAP‐induced senescence, we examined the expression and phosphorylation of YAP and LATS using RT–PCR and Western blot in hOSE cells. We found that LATS protein level in hOSE cells was elevated with the increased passage number, and the increased LATS protein was associated with increased phosphorylation of YAP protein, although the total protein level of YAP was reduced in the senescent cells (Fig 5A). The RT–PCR result indicated LATS2, but not LATS1, was up‐regulated during cellular senescence (Fig 5B). These results suggested LAST2 might be an important player in natural replicative cellular senescence.
Figure 5. Involvement of LATS2 in natural replicative senescence of hOSEs.
-
ARepresentative blots showing LATS and YAP protein levels in hOSEs at the fourth, ninth, and thirteenth passage. β‐Actin was used as a protein loading control.
-
BRepresentative gel photographs showing mRNA levels of LATS1 and LATS2 in hOSEs with or without LATS2 knockout. CRISPR/Cas‐9 system was used to knock out LATS2 in hOSEs. LATS1/2 mRNA levels were analyzed using qRT–PCR at the fourth, ninth, and thirteenth passage.
-
CRepresentative images showing the expression and location of YAP in control and LATS2 knockout hOSE cells. Cells were collected at the 4th passage, and YAP expression was examined by fluorescent immunohistochemistry. YAP protein was visualized using an Alexa‐488 (green)‐conjugated secondary antibody. Nuclei were stained with DAPI. Scale bar: 50 μm.
-
DRepresentative images showing YAP protein expression in the 13th passage hOSE Cells with or without LATS2 knockout. YAP protein was examined by fluorescent immunohistochemistry and visualized using an Alexa‐488 (green)‐conjugated secondary antibody. Nuclei were stained with DAPI (blue). Scale bar: 50 μm.
-
E, FRepresentative images showing morphological change (E) and SA‐β‐gal staining (F) in the 13th passage (P13) hOSE cells with (LATS2 KO) or without (CTRL) LATS2 knockout. Scale bar: 50 μm.
-
GQuantitative data showing the ratio of SA‐β‐gal‐positive cells in the control (CTRL) and LATS2‐knockout (LATS2KO) P13 hOSE cells. Each bar represents mean ± SEM (n = 4). ***P < 0.001, compared to control group (CTRL). Data were analyzed for significance using one‐way ANOVA with Tukey's post hoc tests.
Source data are available online for this figure.
To further examine the role of LATS2 in cellular replicative senescence, we knocked out LATS2 in hOSE cells using the CRISPR/Cas9 gene editing technique. RT–PCR analysis indicated that LATS2 was successfully deleted by the CRISPR/Cas9‐LATS2 system in hOSE cells (Fig 5B). Fluorescent immunohistochemistry showed that YAP protein translocated to nucleus of LATS2‐knockout hOSE cells in both passage 4 and passage 13 (Fig 5C and D). Moreover, knockout of LATS2 inhibited senescence‐associated cell enlargement and significantly reduced the ratio of multinuclear cell in P13 hOSE cells (Fig 5D–F). Most importantly, knockout of LATS2 in hOSE cells diminished natural replicative cellular senescence, as indicated by the decrease in the activity of SA‐β‐galactosidase in LATS2‐knockout hOSE cells after culture for 13 passages (Fig 5F and G). Similar results were also observed in HUVEC cells, in which deletion of LATS2 significantly reduced the number of SA‐β‐gal‐positive cells after culture for 16 passages (Appendix Fig S7).
Deletion of LATS2 prevents YAP‐induced senescence in hOSE cells
To determine whether LATS2 is also involved in YAP‐induced cellular senescence, first we used Western blotting and PCR to detect the expression levels of the LATS2 and LATS2‐associated genes in hOSE cells with different levels of YAP activity. As shown in Fig 6A, protein levels of YAP1 downstream targets such as CCNE1 and CCND1 were significantly up‐regulated in the early passage (passage 4), but not in the late passage (passage 7) hOSE‐YAP and hOSE‐YAPS127A cells. However, LATS1/2 proteins were consistently elevated in hOSE‐YAP and hOSE‐YAPS127A cells regardless cell passage (Fig 6A). Similarly, ectopic expression of YAP and YAPS127A in hOSE cells up‐regulated expression of YAP1 downstream genes such as AREG, ERBB3, MYC, NF2, and AMOT in P4 cells, but not in P7 cells (Fig EV2, Appendix Fig S8). Importantly, both real‐time PCR and semi‐quantitative PCR results indicated that LATS2, but not LATS1, was consistently up‐regulated by YAP and YAPS127A in hOSE cells (Appendix Fig S8, Fig 6B and C). Since LATS2 is a major upstream suppressor of YAP in the Hippo signaling pathway, these results suggest that LATS2 expression is regulated by YAP via a potential negative feedback mechanism. Consistent up‐regulation of LATS2 in P7 hOSE‐YAP and hOSE‐YAPS127A cells also suggests that LATS2 may be involved in YAP‐induced senescence. We then knocked out LATS2 in hOSE‐MXIV, hOSE‐YAP, and hOSE‐YAPS127A cells using CRISPR/Cas9 system (Fig 6C). Knockout of LATS2 inhibited YAP and YAPS127A‐induced enlargement of cell size and reduced the ratio of multinucleated cells in both hOSE‐YAP and hOSE‐YAPS127A groups (Fig 6D). Immunofluorescent results showed that in the presence of LATS2, overexpressed YAP protein was localized to both nucleus and cytoplasm in hOSE‐YAP and hOSE‐YAPS127A cells (Fig EV4). However, knockout of LATS2 not only rescued cellular morphological changes induced by hyperactivation of YAP, but also changed cellular localization of YAP protein (Fig EV4). In the LATS2 knockout hOSE‐YAP and hOSE‐YAPS127A cells, YAP is predominated localized to the nuclear. These results indicate loss of high levels of LATS2 resulted in re‐activation of YAP1 in hOSE cell (Fig EV4). Consistently, knockout of LATS2 almost eliminated SA‐β‐galactosidase activity in hOSE‐YAP and hOSE‐YAPS127A cells (Fig 6D and E). In addition, we observed that YAP and YAPS127A significantly promoted cell proliferation in LATS2‐knockout hOSE cells (Fig 6F). BrdU incorporation assays also showed that deletion of LATS2 can rescue YAP1‐induced inhibition of DNA synthesis in late passage hOSE‐YAP and hOSE‐YAPS127A cells (Appendix Fig S9A and B). These data indicate that the loss of LATS2 prevents hOSE cells from YAP1‐induced senescence. Importantly, we found that YAP also induced expression of LATS2 and RB1 in HUVEC cells (Appendix Fig S10). Knockout of LATS2 in HUVEC cells also prevents these cells from YAP‐induced senescence (Appendix Fig S11). Serine 127 is one of the LATS2 phosphorylation sites of YAP. Similar to YAPS127A, mutation of all five LATS2 phosphorylation sites (Ser61, Ser109, Ser127, Ser164, and Ser381, hereinafter referred to as YAP5SA) also induced drastic senescence in hOSE‐YAP5SA cells at the 4th passage (Appendix Fig S12). However, in the LATS2 knockout hOSE‐YAP5SA cells, no senescent phenotype was observed at the 4th passage (Appendix Fig S12). Interestingly, IHC studies showed that high LATS2 was translocated to the nucleus of the hOSE‐YAP5SA cells (Appendix Fig S13). This observation is consistent with previous report that under oncogenic stress, LATS1/2 translocated to the nucleus to facilitate TP53‐mediated apoptosis 34.
Figure 6. Involvement of LATS2 in YAP‐induced senescence of hOSE cells.
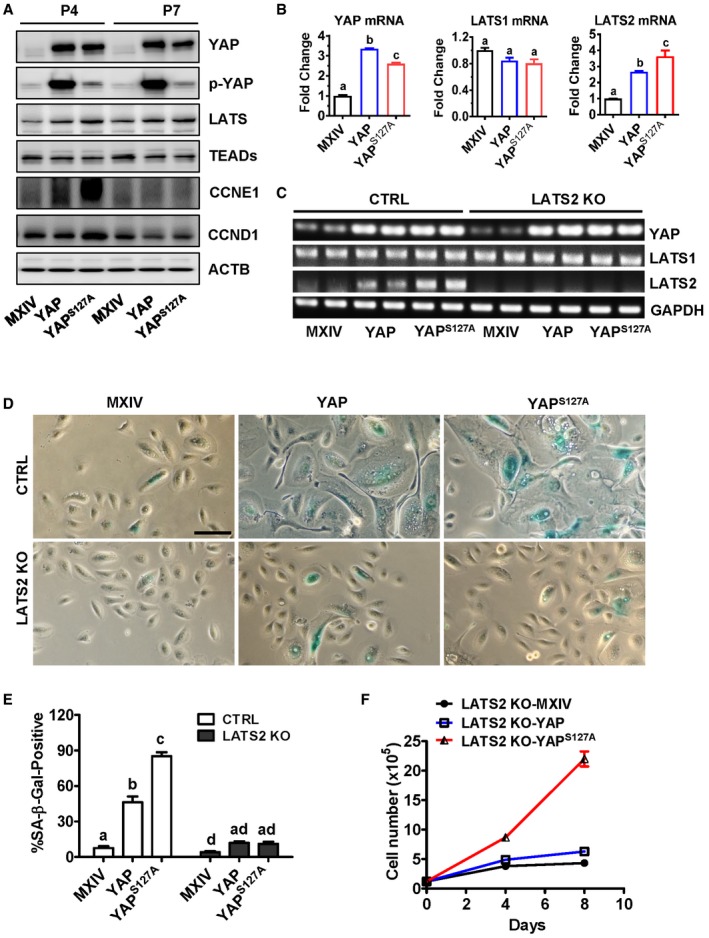
- Representative blots showing expression levels of LATS1/2, CCNE1, CCND1, and YAP in hOSE‐MXIV, hOSE‐YAP, and hOSE‐YAPS127A cells. Cells were collected at passage four (P4) and passage seven (P7). Actin was used as internal control.
- mRNA levels of LATS1, LATS2, and YAP in hOSE‐MXIV, hOSE‐YAP, and hOSE‐YAPS127A cells. Cells were collected at passage seven, and mRNA levels were analyzed using quantitative real‐time PCR. Each bar represents mean ± SEM (n = 5). Bars with different letters are significantly different from each other (P < 0.05).
- Representative gel photographs showing mRNA levels of LATS1, LATS2, and YAP in the control and LATS2‐knockout hOSE‐MXIV, hOSE‐YAP, and hOSE‐YAPS127A cells examined using semi‐quantitative RT–PCR at passage seven.
- Representative images showing the morphologic changes and SA‐β‐gal staining in control and LATS2‐knockout hOSE‐MXIV, hOSE‐YAP, and hOSE‐YAPS127A cells. Scale Bar: 50 μm.
- Quantitative data showing the ratio of SA‐β‐gal‐positive cells in the control and LATS2‐knockout hOSE‐MXIV, hOSE‐YAP, and hOSE‐YAPS127A cells at the seventh passage. Each bar represents mean ± SEM of four independent samples. Bars with different letters are significantly different from each other (P < 0.05).
- Growth curves of the control and LATS2‐knockout hOSE‐MXIV, hOSE‐YAP, and hOSE‐YAPS127A cells. Each point represents mean ± SEM of four independent samples.
Figure EV4. LATS2 deletion impeded YAP‐induced cellular senescence.
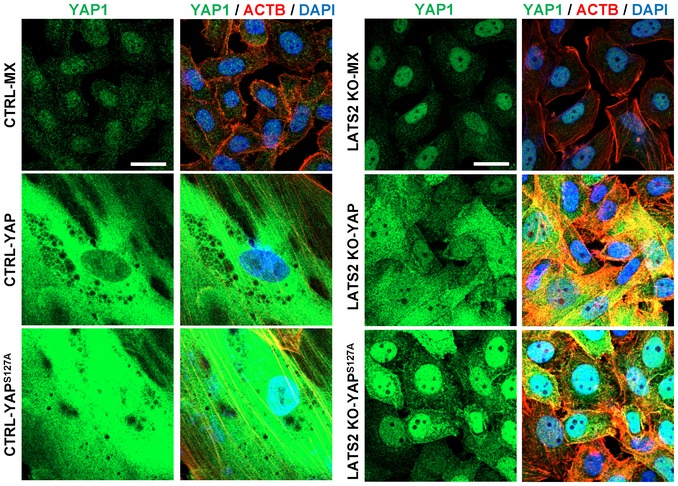
Representative images showing the expression and location of YAP1 in hOSE‐MX, hOSE‐YAP, and hOSE‐YAPS127A cells with or without knockout of LATS2 using CRISPR‐LATS2‐CAS9 vectors. Cells were fixed and stained at their 7th passage. YAP1 was visualized using an Alexa‐488‐conjugated 2nd antibody (green). Actin filaments were stained with rhodamine‐phalloidin (red). Nuclei were stained with DAPI (blue). Scale bar = 20 μm.
Ectopic expression of LATS2 induces cell cycle arrest and cellular senescence
To further examine the role of LATS2 in cellular senescence, we ectopically expressed LATS2 in hOSEs using a lentivirus‐based LATS2‐expressing vector. Control cells were transfected with empty vector. Fluorescent microscopy and real‐time PCR analyses showed that cells were successfully transfected, and LATS2 mRNA expression significantly increased (Fig 7A and B) in the hOSE‐LATS2 cells when compared to control cells. LATS1 and YAP transcripts were slightly, but significantly suppressed by LATS2 overexpression (Fig 7B). As expected, ectopic expression of LATS2 suppressed proliferation and induced senescence in hOSEs (both passage 4 and passage 9 cells), which is indicated by the reduced cell number, enlarged cell size, and increased SA‐β‐gal‐positive cells in LATS2‐overexpressing hOSEs when compared to control groups (Fig 7C–H). The similar results were observed in HUVEC cells. Ectopic expression of LATS2 also rapidly induced senescence in cultured primary HUVEC cells (Appendix Fig S14). Interestingly, ectopic expression of LATS2 induced significant increase in the expression of genes involved in DREAM complex formation, including E2F4, E2F5, RBBP4, and TFDP2 (Fig 7I, P < 0.001, compared to control groups). Most importantly, in the RB1 knockdown hOSEs, overexpression of LATS2 also induced cellular senescence, which is indicated by the arrest of cell proliferation (Fig 7J) and significant increase in the percentage of cells with positive SA‐β‐gal staining (Fig 7K–L).
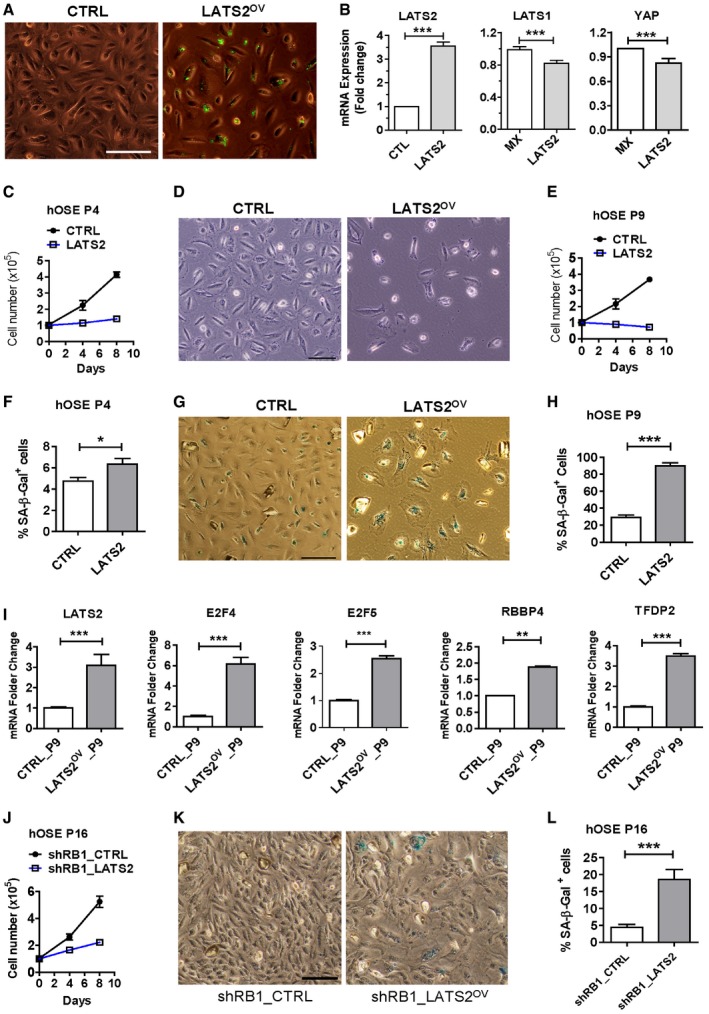
Figure 7. Ectopic expression of LATS2 suppressed proliferation and induced senescence in cultured primary hOSE cells.
-
ARepresentative images showing cells with ectopic expression of LATS2, which is labeled with GFP (the control is empty vectors). Scale bar: 50 μm.
-
BRelative mRNA levels of LATS1, LATS2, and YAP in the control and LATS2‐expressing hOSEs at the 4th passage. Relative mRNA levels were determined with RT–PCR. Each bar represents mean ± SEM (n = 4). ***P < 0.001, compared to control.
-
CGrowth curves of hOSE cells at the 4th passage with or without ectopic expression of LATS2. Each point represents mean ± SEM of at least four independent samples.
-
DRepresentative images showing the effects of LATS2 overexpression on the morphology and growth of hOSE cells at the 9th passage. Scale bar: 50 μm.
-
EGrowth curves of control and LATS2‐overexpressing hOSE cells. Each point represents mean ± SEM of at least four independent samples.
-
FQuantitative data showing the ratio of SA‐β‐gal‐positive hOSEs at their 4th passage with or without ectopic expression of LATS2. Each point represents mean ± SEM of at least four independent samples. *P < 0.05, compared to the control.
-
GRepresentative images showing the effect of LATS2 on the morphology and β‐galactosidase activities in cultured primary hOSE cells at the 9th passage. Scale bar: 50 μm
-
HQuantitative data showing the ratio of SA‐β‐gal‐positive hOSEs at their 9th passage with or without ectopic expression of LATS2. Each bar represents mean ± SEM of at least four independent samples. ***P < 0.001, compared to the control.
-
ImRNA levels of major components of the DREAM complex (E2F4, E2F5, RBBP4, TFDP2) in the control and LATS2‐overexpressing hOSEs at the 9th passage. Relative mRNA levels were examined by real‐time PCR. Each bar represents mean ± SEM (n = 4). **P < 0.01; ***P < 0.001, compared to control.
-
JGrowth curves of the hOSE‐shRB1 cells and hOSE‐shRB1‐LATS2 cells at their 16th passages. Each point represents mean ± SEM of at least four independent samples.
-
K, LRepresentative images showing cellular morphology and β‐galactosidase activities in control and LATS2‐overexpressing hOSEs (K). Scale Bar: 50 μm. Right bar graph (L) showing quantitative results of SA‐β‐gal‐positive cells in the hOSE‐shRB1 cells and hOSE‐shRB1‐LATS2 cells. Each bar represents mean ± SEM of at least four independent samples. ***P < 0.001, compared to control.
Blocking YAP‐induced senescence initiates cell transformation and tumorigenesis
Our previous study shows that overexpression of YAP induces malignant transformation in immortalized human ovarian surface epithelial cells, cervical squamous epithelial cells, and fallopian tube fimbria epithelial cells 9, 22, 26. We speculate that hyperactivation of YAP and deficiency of LATS2 or RB1 may induce transformation of hOSE cells. As postulated, soft agar assays showed that hOSE‐MXIV, hOSE‐YAP, hOSE‐YAPS127A, hOSE‐shRB1‐MXIV, and hOSE‐LATS2KO‐MXIV cells did not form colonies after culture for 9 days. However, hOSE‐shRB1‐YAP cells, hOSE‐LATS2KO‐YAP cells, hOSE‐shRB‐YAPS127A cells, and hOSE‐LATS2KO‐YAPS127A cells formed abundant large colonies on soft agar (Fig 8A and B). These results indicate that interruption of senescence signaling in YAP‐hyperactivated hOSE cells induces cell transformation.
Figure 8. YAP induces malignant transformation of hOSE cells with LATS2 deletion or pRB knockdown.
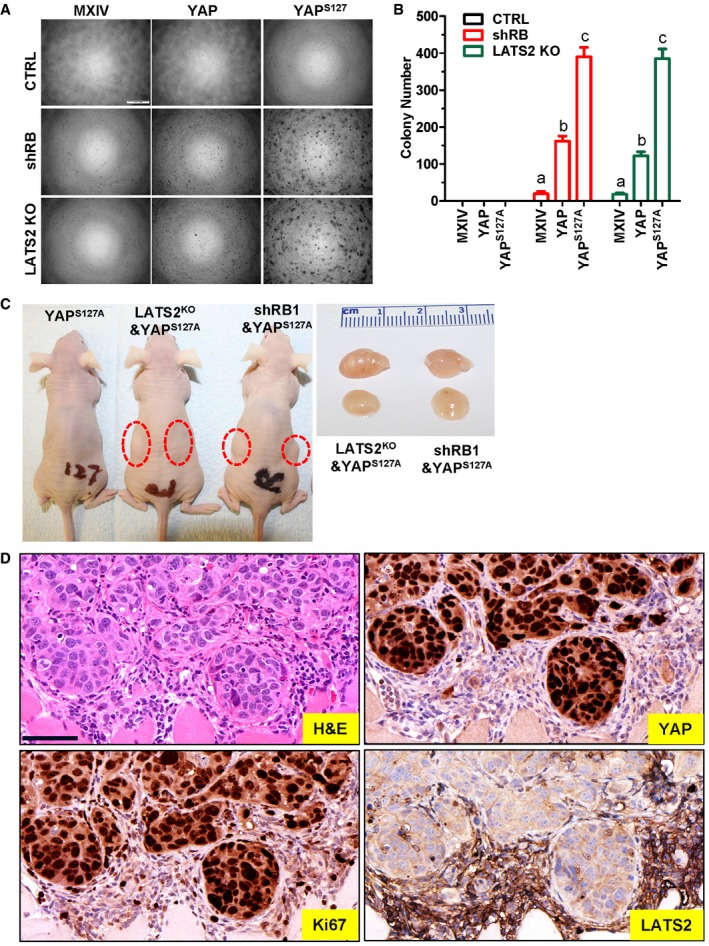
- Representative images showing colony formation in hOSE‐MXIV, hOSE‐YAP, and hOSE‐YAPS127A cells with or without pRB knockdown or LATS2 knockout. hOSEs at the 7th passage were incubated in the growth medium in a soft agar culture system for 9 days before imaging. Scale bar: 500 μm.
- Quantitative data showing colony numbers in hOSE‐MXIV, hOSE‐YAP, and hOSE‐YAPS127A cells with or without pRB knockdown or LATS2 deletion. hOSE cells at the 7th passage were incubated in the growth medium in a soft agar culture system for 9 days before counting colonies under a microscope. Each bar represents means ± SEM of four independent repeats. Bars with different letters are significantly different from each other (P < 0.001). Data were analyzed for significance using one‐way ANOVA with Tukey's post hoc tests.
- Representative images showing tumorigenesis (red circle area) of hOSE‐YAPS127A cells with or without pRB knockdown or LATS2 deletion. Tumors formed by hOSE‐YAPS127A cells with RB1 knockdown or LATS2 deletion are shown in red circle area. Right panel showing representative tumors formed by hOSE‐YAPS127A‐LATS2KO and hOSE‐YAPS127A‐shRB1 cells. Please note that no tumor xenografts formed in hOSE‐YAPS127A alone group.
- Representative images showing expression of YAP, Ki67, and LATS2 in hOSE‐LATS2KO‐YAPS127A cell‐derived tumors examined by immunohistochemistry. Scale bar: 50 μm.
To further examine the tumorigenic activity of transformed hOSE cells, hOSE‐YAPS127A cells, HOSE‐shRB‐YAPS127A cells, hOSE‐LATS2KO‐YAPS127A cells, and hOSE‐E6/E7‐YAPS127A cells were injected subcutaneously into athymic nude mice. As shown in Fig 8C, no tumors were observed in mice injected with the hOSE‐YAPS127A cells. However, tumors formed in mice injected with HOSE‐shRB1‐YAPS127A cells (80%, 8 out of 10) and hOSE‐LATS2KO‐YAPS127A cells (80%, 8 out of 10). However, tumors formed in mice injected with hOSE‐shRB1‐YAPS127A cells (80%, 8 out of 10) and hOSE‐LATS2KO‐YAPS127A cells (80%, 8 out of 10). These results indicate that YAPS127A was sufficient to induce tumorigenesis in hOSE cells deficient with LATS2 or RB1. Immunohistochemistry analysis showed strong staining for CAS9, YAP, and Ki67 in tumor tissues derived from HOSE‐LATS2KO‐YAPS127A cells, but LATS2 could not be detected in these tumor cells (Fig 8D and Appendix Fig S15).
LATS2 is involved in the process of human pathological senescence
Detection of senescent cells in human tissue is difficult because accumulation of senescent cells in normal tissues is very rare. However, human melanocytic nevus has been identified to display several established hallmarks of cellular senescence and has been recognized as a good model for studying human cellular senescence 35. Therefore, we used nevus tissues to examine whether LATS2 was also involved in regulation of cellular senescence in human tissues. As predicted, immunohistochemistry analysis indicated that LATS2 was highly expressed in nevus tissues (Figs EV5A and 5C, Appendix Fig S16). The intensity of the LATS2 immunosignal in melanocytes in the nevus tissues was significantly higher than in normal skin tissues (Figs EV5A and 5B and C, Appendix Fig S16). LATS2 protein in melanocytes of normal skin is nearly undetectable (Appendix Fig S16). Consistent with previous reports 35, we found that few cells were positive for Ki67, a well‐known proliferation biomarker, in nevus tissues (Fig EV5C). LATS2 expression was very low in melanoma tissues. These results indicated that LATS2 is up‐regulated and potentially involved in senescent process of human tissues under pathological (or potentially physiological) conditions.
Figure EV5. LATS2 is up‐regulated in human senescent tissues.
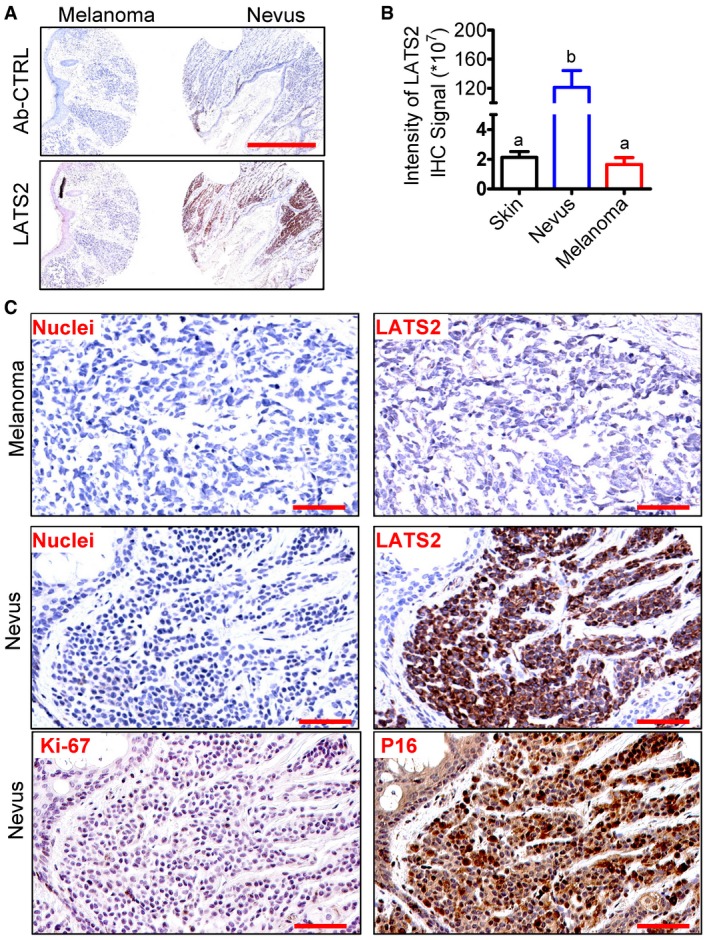
- Representative images showing the expression of LATS2 in nevus and melanoma tissues examined by immunohistochemistry. Scale bar: 1.0 mm.
- Quantitative data showing the immunosignal intensity of LATS2 in the normal skin (n = 8), nevus (n = 9), and melanoma tissues (n = 8). Each bar represents means ± SEM. Bars with different letters are significantly different from each other. Data were analyzed for significance using one‐way ANOVA with Tukey's post hoc tests.
- Representative high‐resolution images showing the expression and cellular location of LATS2, Ki67, and p16 (another known senescence marker) in nevus and melanoma tissues. LATS2 and P16 were visualized using a DAB staining kit and shown as brown. Nuclei were stained with hematoxylin (blue). Scale bar: 100 μm.
Discussion
Cells in the multicellular organisms employ a wealth of molecular mechanisms to maintain tissue homeostasis. Dysfunction of the homeostasis‐maintaining system in specific cell types or tissues renders the organism susceptible to a range of diseases, including malignancies. One of the emerging mechanisms for maintaining cell/tissue homeostasis is cellular senescence, a process whereby cells permanently lose the ability to divide. Normal human diploid cells undergo a certain number of divisions and then enter so‐called replicative senescence, which results from telomere shortening‐induced DNA damage. Hyperactivation of oncogenes, exposure to DNA‐damage agents, or excessive oxidative stress can also push cells to enter senescence. Since senescence prevents damaged or dysfunctional cells from proliferation, it serves as an important mechanism to constrain the malignant transformation of stress‐damaged cells 36, 37. Moreover, studies also demonstrate that cellular senescence drives the aging process and is essential for embryo development 35, 36, 37, 38, 39. Despite its role in the development, aging, and tumorigenesis, the exact molecular mechanism underlying the induction and progress of cellular senescence is still unclear. In the present study, we found that the Hippo/YAP signaling pathway plays a critical role in controlling cellular senescence of ovarian cells. Our results demonstrate that YAP, the major effector of the Hippo signaling pathway, induces senescence in primary human OSE cells in the presence of LATS2. Knockout of LATS2 in human ovarian OSE cells using the CRISPR/Cas9 technique blocked YAP‐induced senescence and induced malignant transformation of these cells. Most importantly, we found that hyperactivation of YAP induced expression of LATS2 protein in ovarian OSE cells, suggesting that LATS2 and YAP, two major components of the Hippo/YAP pathway, form a feedback loop to induce senescence and prevent ovarian cells from malignant transformation.
The effect of YAP on cell proliferation and transformation has been well documented. Most of these studies indicate that elevated expression and activation of YAP induce transformation in various types of cell lines 1, 5, 14, 18, 19, 22, 27, 39, 40, 41. Our previous studies also showed that hyperactivation of YAP induced tumors in immortalized ovarian surface epithelial cells and promote growth of ovarian granulosa cells 22, 27. While a majority of previous studies used immortalized cell lines or cancer cells as cellular models, the present study utilized primary cultures of human OSE cells (and other type of primary cells) to examine the role of YAP in the non‐immortalized cells. Indeed, ectopic expression of wild‐type YAP or constitutively active YAP (YAPS127A) in these cells promoted cell proliferation within four passages (two passages after cell transfection). However, high YAP and YAPS127A inhibited cell proliferation after seven passages (five passages after transfection). Further studies indicated that hyperactivation of YAP induced cellular senescence in primary cultures of hOSE cells (and other types of cells), which was evidenced by the arrest of cell cycle, enlargement of cell size, increase in the number of multinucleated cells, and expression of senescence‐associated β‐galactosidase. Importantly, we also found that hyperactivation of YAP induced cellular senescence in primary cultures of ovarian granulosa cells (hGC) and endothelial cells (HOMEC and HUVEC), suggesting that YAP also induces senescence in other type of cells.
Previous studies, including ours, clearly implicate YAP as an oncogene. While it may seem counterintuitive that expression of specific oncogenes can induce senescence, the concept is not new. Serrano and colleagues found that expression of oncogene H‐rasV12 in human primary cells led to cell cycle arrest 43. Many other oncogenes, such as RAF, AKT, E2F1/3, cyclin E, and CDC6, can induce cellular senescence in vitro and in vivo 42, 44, 45, 46, 47 "/>. From this perspective, it is not surprising that YAP induces cellular senescence in cultures of primary ovarian cells. Although a recent report demonstrated that silencing of YAP inhibits cell proliferation and induces premature senescence in an immortalized fibroblasts 48, this discrepancy could be explained by the difference of cell types used in two experiments. We used primary human cells, while Xie et al 48 used an immortalized human fetal lung fibroblast cell lines (IMR90). Our previous studies have also shown that hyperactivation of YAP induced proliferation and transformation of immortalized human OSE cells 22. Interestingly, Fausti et al 49 showed that up‐regulation of YAP in colorectal cancer cells also correlated with slower cell proliferation and accelerated senescence. It will be interesting to explore how up‐regulation of YAP induces senescence in colorectal cancer cells if the results are confirmed in other model systems.
Although molecular mechanisms involved in oncogene‐induced cellular senescence are not fully understood, previous studies have shown that tumor suppressive pathways, such as P53/P21 and P16/RB1 pathways, were involved in almost all cases of oncogene‐induced senescence 14, 35, 45. Consistently, we found that expression of the RB1 gene was markedly up‐regulated by constitutively active YAP in hOSEs and silencing RB1 rescued hOSE cells from YAP‐induced senescence. Although TP53 levels were not significantly affected by constitutively active YAP, knockdown of TP53 still partially prevented hOSEs from YAP‐induced senescence. These results indicate that P53 and RB1 tumor suppressive pathways are also important mediators of YAP‐induced senescence. Accumulating evidence indicates that the Hippo pathway is a powerful tumor suppressive pathway. However, previous reports considering the role of the Hippo pathway on cellular senescence are controversial 50, 51. LATS1 was showed to suppress cellular senescence 50, 51, while LATS2 was demonstrated to be essential for RAS‐induced senescence 52. Therefore, the role of the Hippo/YAP pathway in oncogene‐induced cellular senescence is still unclear. In the present study, we found that ectopic expression of wild‐type YAP or constitutively active YAP in primary cultured hOSE cells, which induced senescence in these cells, significantly increased expression of LATS2, but not LATS1. These results suggested that LATS2, but not LATS1, may be involved in YAP‐induced senescence. We then deleted LATS2 gene in hOSE cells using CRISPR/Cas 9 technique. Surprisingly, knockout of LATS2 completely inhibited YAP‐induced senescence. Most importantly, we found that hOSE‐YAP and hOSE‐YAPS127A cells with normal LATS2 were not tumorigenic. In contrast, deletion of LATS2 in hOSE‐YAP and hOSE‐YAPS127A cells induced tumor formation in the xenograft mouse models (Fig 8). Our results, for the first time, demonstrate that in normal cells, the Hippo/YAP pathway uses LATS2 kinase to surveil and regulate YAP activity to prevent oncogene‐induced tumorigenesis. The functionality of the Hippo/YAP pathway orchestrates the cell fate (senescence or transformation) and plays crucial role in maintaining cellular and tissue homeostasis. Interestingly, we found that LATS2 expression increased not only in YAP‐induced senescent cells, but also in cells undergoing nature replicative senescence. Moreover, knockout of LATS2 inhibited replication‐induced senescence. These data suggest that the Hippo/YAP pathway may represent a common signaling pathway that is critical for maintaining tissue homeostasis via controlling cell fate (senescence or tumorigenesis).
It is known that RB1 cooperates with a variety of repressor complexes to suppress expression of proliferation‐promoting E2F targets to promote cell cycle exit 53, 54. However, the role of LATS2 in cellular senescence is largely unknown. In the present study, we found that LATS2 significantly increased expression of major components of the DREAM repressor complex (dimerization partner, RB‐like, E2F, and multi‐vulval class B). Previous studies have shown that the transcriptional silencing of E2F target genes is important for the establishment of a stable arrest of the cell cycle and is implemented by changes in chromatin organization that are characteristic marks of senescent cells 55, 56. Therefore, LATS2 may mediate YAP‐induced senescence via repressing the assembly of the DREAM repressor complex, which is a RB1‐independent senescent pathway. However, knockdown of RB1 rescued YAP‐induced senescence in hOSE cells, which have elevated levels of LATS2, suggesting that the RB1 senescent pathway may also interact with LATS2 pathway to mediate YAP‐induced senescence. Consistent with this idea, Tschop et al 52 showed that knockdown of LATS2 suppresses some RB1‐induced senescence markers, and LATS2 cooperates with RB1 to promote the silencing of E2F target genes in a RB1 and TP53 mutant human osteosarcoma cells. However, our studies using primary cells showed that overexpression of LATS2 induced cell cycle arrest and expression of senescent marker in RB knockdown hOSE cells, suggesting that LATS2 along is sufficient to induce senescence in cultured primary hOSE cells. Obviously, more experiments are needed to fully figure out the role of LATS2 and RB1, as well as their crosstalk, in mediating YAP‐induced and natural replicative senescence.
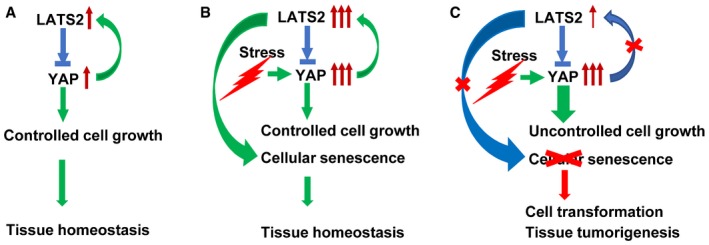
In summary, the present study demonstrates a previously unprecedented mechanism by which the Hippo pathway controls cell fate to maintain ovarian tissue homeostasis. Under normal physiological conditions, the LATS2‐YAP negative feedback loop is presented in normal ovarian cells and the Hippo pathway is functional in these cells. Activation of YAP will induce increased expression of LATS2 via the negative feedback loop. Increased LATS2 will inactivate YAP protein by phosphorylating and retaining it in the cytoplasm to block its action on cell proliferation, which will efficiently control cell growth (Fig 9A). Under pathological conditions, proliferative stress signals or other intrinsic or extrinsic tumorigenic signals may trigger over‐activation of YAP oncogene in ovarian cells in a Hippo pathway‐dependent or Hippo pathway‐independent manner. If the Hippo pathway is functional and the YAP‐LATS2 feedback loop is still active in these cells, high YAP activity can still trigger the feedback loop to induce expression of LATS2. High LATS2 will, on the one hand, phosphorylate YAP to suppress its action on cell proliferation; on the other hand, it facilitates the setup of the DREAM complex (or interacts with other tumor suppressors) to induce senescence of YAP1‐hyperactivated cells. In so doing, the Hippo pathway can successfully maintain controlled cell growth and ovarian tissue homeostasis (Fig 9B). However, if the Hippo pathway is disrupted and LATS2 is inactivated (e.g., mutations or deletions), YAP1‐hyperactivated cells will bypass YAP‐induced senescence and become tumorigenic (Fig 9C). Consistent with our findings, two recent studies have shown that YAP activation resulted in high expression of LATS2 and NF2 (neurofibromatosis type 2) kinases in both cultured cells and mouse tissues 28, 57. Importantly, multidimensional analyses of human cancer genomic data from TCGA database indicate that in human cancers, including in ovarian cancer, RB1 gene is frequently mutated or deleted in human cancers, and LATS2 gene is frequently inactivated (mutation, deletion, and reduced expression). At the same time, the YAP gene is frequently amplified in many different cancers (Appendix Fig S17A–C). Intriguingly, the LATS2 locus is physically linked with RB1 on 13q, and this region frequently displays loss of heterozygosity in human ovarian cancers 58. These observations further confirm the clinical relevance of our findings and strongly support our conclusion that the Hippo/YAP pathway plays critical role in maintaining tissue homeostasis via controlling cell fate (senescence or tumorigenesis) in ovary. In human tissues, dysregulation of the Hippo/YAP pathway in ovarian cells may result in disruption of cellular homeostasis and development of ovarian cancer.
Figure 9. Schematic illustrations showing the proposed mechanism underlying the Hippo pathway regulation of cellular senescence and tumorigenesis.
-
A–CData in this study support the existence of a YAP‐LATS2 negative feedback loop consisting of oncogene YAP and its upstream suppressor LATS2. Under normal physiological conditions, the feedback loop is functional, and activation of YAP leads to increased expression of LATS2, which may inactivate YAP via phosphorylating YAP and retain YAP in the cytoplasm, leading to the blockage of its proliferative action on hOSE cells (A). Under certain circumstances, YAP protein may be over‐activated by the intrinsic and extrinsic stresses (e.g., YAP gene amplification). If the Hippo pathway is still functional and the YAP‐LATS2 negative feedback still exists in these cells, hyperactivated YAP may induce cellular senescence via high expression of LATS2 (B). However, if the Hippo pathway is dysfunctional and the YAP‐LATS2 feedback loop is deficient, YAP may induce transformation and carcinogenesis of OSE cells (C).
Materials and Methods
Chemicals and cell lines
HOMEC and hOSE cells, as well as their culture media, were purchased from ScienCell Research Laboratories (Carlsbad, CA). HUVEC cells were purchased from ATCC (Manassas, VA). Human ovarian granulosa cells (HOGC) were purified from discarded granulosa cells of healthy IVF patients after oocyte retrieval. Fetal bovine serum (FBS) was from Atlanta Biologicals, Inc. (Lawrenceville, GA). The Ribogreen RNA Quantification Kit and Alexa‐conjugated secondary antibodies were from Life Technologies Corp. (Grand Island, NY); RNeasy Mini Kit was from Qiagen, Inc. (Valencia, CA). YAP siRNA, TAZ siRNA, LATS1 siRNA, and LATS2 siRNA were from Dharmacon/Thermo Scientific (Pittsburgh, PA). Lentivirus‐based shRB1 vectors were from Addgene (Cambridge, MA). Lentivirus (contains HPV16 E6/E7 and CRISP‐Cas9 all‐in‐one LATS2 knockout vectors) was from Applied Biological Materials (ABM), Inc. (Richmond, BC, Canada). PCR chemicals were from Invitrogen (Carlsbad, CA), Qiagen (Carlsbad, CA), or Bio‐Rad (Hercules, CA). Antibodies against YAP, phospho‐YAP (Ser127), phospho‐YAP (Ser397) LATS1/2, p53, pRB (phospho‐RB1), p16, CCND1, CCNA2, ATG3, ATG7, and Beclin‐1, SA‐β‐gal detection kit were from Cell Signaling Technology, Inc. (Danvers, MA). Antibodies against β‐actin were from Sigma‐Aldrich (St. Louis, MO). Peroxidase‐conjugated secondary antibodies for Western blot analysis were from Jackson Immunoresearch Laboratories, Inc. (West Grove, PA); the SuperSignal West Femto Chemiluminescent Substrate Kit was from Pierce/Thermo Scientific (Rockford, IL); and Optitran nitrocellular transfer membrane was from Schleicher & Schuell Bioscience (Dassel, Germany). All other molecular‐grade chemicals were purchased from Sigma (St. Louis, MO), Fisher (Pittsburgh, PA), or United States Biochemical (Cleveland, OH). The melanoma and nevus tissue arrays were purchased from US Biomax (Rockville, MD). This array contained 8 malignant melanoma cases and 9 nevus cases.
Western blot analysis, immunohistochemistry, and immunofluorescence
Western blot was used to determine protein levels as described previously 59. Briefly, normal or treated cells were harvested on ice with ice‐cold lysis buffer containing 10 mM Tris pH 7.4, 100 mM NaCl, 1 mM EDTA, 1 mM EGTA, 1 mM NaF, 20 mM Na4P2O7, 1% Triton X‐100, 10% glycerol, 0.1% SDS, and 0.5% deoxycholate and protease and phosphatase inhibitor cocktails. Samples (30 μg protein) were loaded to a 10% SDS–PAGE, fractioned through electrophoresis, and transferred onto nitrocellulose membranes. The membranes were blocked with 5% BSA and then probed with appropriate primary and horseradish peroxidase (HRP)‐conjugated secondary antibodies. The immunosignal was detected using a Thermo Scientific SuperSignal West Femto Chemiluminescent Substrate Kit. The images were captured and analyzed using a UVP gel documentation system (UVP, Upland, CA). Information for the validated antibodies used for Western blot, IHC, and IF (see below) is presented in the Appendix Table S1.
LATS2 expression in melanoma and nevus tissues was detected by using peroxidase‐based immunohistochemistry as described previously 60. Briefly, human tissues were deparaffinized with xylene, rehydrated with graded ethanol series, and autoclaved in an unmasking solution (Vector Laboratories, Burlingame, CA) for antigen retrieval before blocking endogenous peroxidase activity with 3% hydrogen peroxide. Tissues were then blocked with 10% normal donkey serum (NDS) at room temperature for 1 h followed by incubation with primary antibodies at 4°C for 16 h. After washing three times with PBS, tissues were incubated consecutively with biotinylated secondary antibody and streptavidin–peroxidase complex (Vector Laboratories, Burlingame, CA) at room temperature for thirty and 10 min, respectively. The immunosignal was visualized with an immPACT DAB kit (Vector Laboratories, Burlingame, CA). The sections were counterstained with Mayer's hematoxylin. For negative controls, the primary antibody was replaced with blocking buffer containing the same amount of IgG from the non‐immune rabbit serum. Sections were scanned with an iSCAN Coreo Slide Scanner (Ventana Medical Systems, Inc. Oro Valley, AZ). The intensity of the positive immunosignal was quantified using Aperio ImageScope software (Vista, CA). The intensity of positive signal and the positivity (i.e., the ratio of positive cell number relative to the total cell) of each section was recorded.
Co‐localization of LATS2 and melanocyte markers in normal skin and nevus tissue was performed using an ImmPRESS Duet Double Staining HRP/AP Polymer Kit following the instructions from the manufacturer (Vector Laboratories, Burlingame, CA). Melanocytes in healthy skin and nevus were probed with a mouse antibody cocktail for MART‐1, Tyrosinase, and gp100 (Novus Biologicals, Centennial, CO) and visualized using the ImmPACT™ SG substrate which develops blue‐gray color in melanocytes. LATS2 protein was probed with a rabbit monoclonal antibody (Cell Signaling Technology, Inc. Danvers, MA) and visualized using the ImmPACT™ Vector® Red substrate which develops red color in positive cells (Vector Laboratories, Burlingame, CA).
Immunofluorescent histochemistry (IF) was used to localize YAP in the established cell lines 61. Briefly, cells were fixed in freshly prepared 4% paraformaldehyde and stained for YAP using a protocol established in our laboratory 27, 62. Images were captured using a Zeiss 710 Meta Confocal Laser Scanning Microscope and analyzed using Zeiss Zen 2010 software (Carl Zeiss Microscopy, LLC, Thornwood, NY).
Quantitative real‐time PCR
Quantitative real‐time PCR (QT–PCR) was used to determine mRNA expression 63. Total RNA was prepared with TRIzol reagent (Invitrogen; Carlsbad, CA) and Qiagen RNeasy Mini Kit (Qiagen, Carlsbad, CA). RNA concentration was determined with NanoDrop™ Spectrophotometers. Reverse transcription was done by using high‐capacity cDNA reverse transcription kit (Applied Biosystems, Grand Island, NY). PCR was performed in a Bio‐Rad CFX96 real‐time fast PCR system. Primers for cell division‐associated genes (E2f4, E2f5, Rbbp4, Tfdp2) were from a Human Retinoblastoma Gene Primer Library (Item# HRBG‐I), primers for cell cycle‐associated genes (CCNE1, E2F4, RB1, TP53) were from a human cell cycle gene primer library (Item# HCC‐I), and primers for the Hippo pathway‐associated genes (YAP1, LATS1, LATS2, Tead1, Tead2, Tead3, Tead4, AMOT, MYC, NF2, CTGF) were from a human Hippo signaling gene primer library (Item# HHPO‐I). Primers for cytokine genes (IL‐6, IL‐8, FGF2, VEGFA) were from a human cytokine primer library. Primers for the ERBB pathway (HBEGF, AREG, ERBB3) were from a Human ERBB Signaling Primer Library (Item# HERBB‐I). These kits were purchased from the Real Time Primers, LLC (Elkins Park, PA). Each kit contains 88 primer sets directed against the retinoblastoma gene pathway and 8 housekeeping gene primer sets that has been validated by the manufacturer.
BrdU cell proliferation assay
The effect of YAP1 on DNA incorporation was analyzed using a BrdU Cell Proliferation Assay Kit (Cell Signaling Technology, Inc. #6813). Briefly, cells (5,000 cells/well) were plated in 96‐well plate and incubated with growth medium for 48 h. Cells were then incubated with BrdU containing medium (final concentration: 10 μM) for 6 or 24 h before fixation for BrdU concentration analysis according to the instructions provided in the assay kit. Optical density (OD) was recorded at 450/550 nm within 30 min.
Cell line establishment, cell proliferation, SA‐β‐gal staining, and colony formation assays
Primary cells were cultured to 40% confluent and then transfected with retrovirus or lentivirus‐based gene expression constructs. Stable genes expressing clones were selected using G418 or puromycin. Cell proliferation was determined by counting cell number with an Invitrogen Countess® Automated cell counter (Carlsbad, CA). SA‐β‐gal activations were detected by following the kit instructions (Cell Signaling Technology, Inc.). The ability of anchorage‐free cell growth was assessed with soft agar cell colony formation assay using Cytoselect 96‐Well Cell Transformation assay kit (Cell Biolabs, Inc.).
A LATS2 sgRNA CRISPR (Vector: pLenti‐U6‐sgRNA‐SFFV‐Cas9‐2A‐Puro) All‐in‐one Lentivirus set (Applied Biological Materials Inc. Catalog Number: K1198315) was used to generate LATS2 deleted cells. Three lentiviruses (titer: 9.7 × 10⁷ IU/ml) with different sgRNA were used to ensure the knockout efficiency. The targeted LATS2 sequences are (i) 26‐ATTTCCAGAATAAGTCG; (ii) 116‐GTCACTGTTTGGTCCTG; and (iii) 215‐CTTATCAGAAAGCCTTG. The primary hOSE cells and HUVEC cells were cultured to 40% confluent and then transfected with Lentivirus #1 (20 MOI) on day 0. Forty‐eight hours later, puromycin was added to the medium to select the positive cells for 4 days. Lentivirus #2 and lentivirus #3 (both at 20 MOI) were transfected on day 6 and day 7, respectively. Since cells with intact LATS2 or partially deleted LATS (delete one copy) grew much slower, gradually became senescent, and eventually eliminated from the culture, LATS2‐knockout cells rapidly accumulated and become the dominant population. Therefore, although not from a single cell clonal population, this pool of cells is composed predominantly of LATS2‐negative cells. Fluorescent immunohistochemistry of CAS9 was used to verify the enrichment of LATS2 deleted cells. qRT–PCR and semi‐quantitative PCR were used to monitor the expression of LATS2.
In vivo tumorigenicity
Animal handling and all experimental procedures were approved by the Institutional Animal Care and Use Committee (IACUC) of the University of Nebraska Medical Center. Cells (6 × 10⁶ cells suspended in 0.1 ml PBS with Matrigel) were injected subcutaneously into the right and left dorsal flank of 6‐week‐old female athymic nude mice. The tumor volume (mm3) was estimated by measuring the longest and shortest diameter of the tumor and calculating as follows: volume = (shortest diameter)2 × (longest diameter) × 3.14/6. All mice were euthanized 2 months after tumor cell inoculation. Tumors were collected, weighed, and processed for preparation of paraffin and frozen sections, protein and RNA. Immunohistochemistry was performed with a protocol described previously 60.
Human cancer genomic data analysis and statistical analysis
Genomic data mining was performed using cBioPortal for Cancer Genomics (available at http://www.cbioportal.org) as described previously 64. For analysis of YAP, LATS2, and pRB alterations in different cancer types, we used 146 available datasets from The Cancer Genome Atlas (TCGA) Data Portal in accordance with the publication guidelines (TCGA, Provisional).
Statistics
All experiments were repeated at least five times unless otherwise noted. Data are presented as mean ± SEM. Statistical analysis was conducted using GraphPad Prism software (GraphPad Software, Inc. La Jolla, CA). Data were analyzed for significance using one‐way ANOVA with Tukey's post hoc tests. A value of P < 0.05 was considered statistically significant.
Author contributions
CHe contributed to the experimental design, performance, data analysis, and manuscript preparation. XL contributed to experimental design, studies related to the relationship between the RB1 pathway and the YAP‐induced senescence, and in vivo experiments. CHu conducted IHC analysis. GH did the IF staining. XC performed real‐time PCR analysis. BM performed Western blotting. PCA contributed to studies related to the HPV E6/E7. JD constructed YAP retroviral vectors. JZ contributed to the cervical epithelium cells isolation. ZW contributed to data analysis. JSD contributed to experimental design, results discussion, and manuscript review. BRR contributed to results discussion and manuscript review. CW supervised these studies and contributed to the experimental design, data analysis, and manuscript preparation.
Conflict of interest
The authors declare that they have no conflict of interest.
Supporting information
Appendix
Expanded View Figures PDF
Source Data for Appendix
Review Process File
Source Data for Figure 1
Source Data for Figure 2
Source Data for Figure 3
Source Data for Figure 4
Source Data for Figure 5
Source Data for Figure 6
Acknowledgements
This work was supported by the National Cancer Institute/National Institute of Health (1R01CA197976, 1R01CA201500), the Olson Center for Women's Health (no number), the Fred & Pamela Buffett Cancer Center (Lb595), Colleen's Dream Foundation (no number), the Marsha Rivkin Center for Ovarian Cancer Research (the Barbara Learned Bridge Funding Award), the CoBRE grant from the Nebraska Center for Cellular Signaling/the National Institute of General Medicine/the National Institute for Health (5P30GM106397), and the Department of Obstetrics and Gynecology, Massachusetts General Hospital (no number). We thank Janice A. Taylor and James R. Talaska of the Advanced Microscopy Core Facility at the University of Nebraska Medical Center for providing assistance with confocal microscopy. We also thank Philip Hexley and Victoria B. Smith of The Flow Cytometry Research Facility at the University of Nebraska Medical Center for providing assistance with flow cytometry.
EMBO Reports (2019) 20: e44948
References
- 1. Hilman D, Gat U (2011) The evolutionary history of YAP and the hippo/YAP pathway. Mol Biol Evol 28: 2403–2417 [DOI] [PubMed] [Google Scholar]
- 2. Yu FX, Zhao B, Guan KL (2015) Hippo pathway in organ size control, tissue homeostasis, and cancer. Cell 163: 811–828 [DOI] [PMC free article] [PubMed] [Google Scholar]
- 3. Halder G, Johnson RL (2011) Hippo signaling: growth control and beyond. Development 138: 9–22 [DOI] [PMC free article] [PubMed] [Google Scholar]
- 4. Harvey K, Tapon N (2007) The Salvador‐Warts‐Hippo pathway ‐ an emerging tumour‐suppressor network. Nat Rev Cancer 7: 182–191 [DOI] [PubMed] [Google Scholar]
- 5. Zhao B, Wei X, Li W, Udan RS, Yang Q, Kim J, Xie J, Ikenoue T, Yu J, Li L et al (2007) Inactivation of YAP oncoprotein by the Hippo pathway is involved in cell contact inhibition and tissue growth control. Genes Dev 21: 2747–2761 [DOI] [PMC free article] [PubMed] [Google Scholar]
- 6. Dong J, Feldmann G, Huang J, Wu S, Zhang N, Comerford SA, Gayyed MF, Anders RA, Maitra A, Pan D (2007) Elucidation of a universal size‐control mechanism in Drosophila and mammals. Cell 130: 1120–1133 [DOI] [PMC free article] [PubMed] [Google Scholar]
- 7. Huang J, Wu S, Barrera J, Matthews K, Pan D (2005) The Hippo signaling pathway coordinately regulates cell proliferation and apoptosis by inactivating Yorkie, the Drosophila Homolog of YAP. Cell 122: 421–434 [DOI] [PubMed] [Google Scholar]
- 8. Camargo FD, Gokhale S, Johnnidis JB, Fu D, Bell GW, Jaenisch R, Brummelkamp TR (2007) YAP1 increases organ size and expands undifferentiated progenitor cells. Curr Biol 17: 2054–2060 [DOI] [PubMed] [Google Scholar]
- 9. Hua G, Lv X, He C, Remmenga SW, Rodabough KJ, Dong J, Yang L, Lele SM, Yang P, Zhou J et al (2016) YAP induces high‐grade serous carcinoma in fallopian tube secretory epithelial cells. Oncogene 35: 2247–2265 [DOI] [PMC free article] [PubMed] [Google Scholar]
- 10. Murakami H, Mizuno T, Taniguchi T, Fujii M, Ishiguro F, Fukui T, Akatsuka S, Horio Y, Hida T, Kondo Y et al (2011) LATS2 is a tumor suppressor gene of malignant mesothelioma. Cancer Res 71: 873–883 [DOI] [PubMed] [Google Scholar]
- 11. Pan D (2010) The hippo signaling pathway in development and cancer. Dev Cell 19: 491–505 [DOI] [PMC free article] [PubMed] [Google Scholar]
- 12. Hamaratoglu F, Willecke M, Kango‐Singh M, Nolo R, Hyun E, Tao C, Jafar‐Nejad H, Halder G (2006) The tumour‐suppressor genes NF2/Merlin and Expanded act through Hippo signalling to regulate cell proliferation and apoptosis. Nat Cell Biol 8: 27–36 [DOI] [PubMed] [Google Scholar]
- 13. Nishio M, Hamada K, Kawahara K, Sasaki M, Noguchi F, Chiba S, Mizuno K, Suzuki SO, Dong Y, Tokuda M et al (2012) Cancer susceptibility and embryonic lethality in Mob1a/1b double‐mutant mice. J Clin Invest 122: 4505–4518 [DOI] [PMC free article] [PubMed] [Google Scholar]
- 14. St John MA, Tao W, Fei X, Fukumoto R, Carcangiu ML, Brownstein DG, Parlow AF, McGrath J, Xu T (1999) Mice deficient of Lats1 develop soft‐tissue sarcomas, ovarian tumours and pituitary dysfunction. Nat Genet 21: 182–186 [DOI] [PubMed] [Google Scholar]
- 15. Chen Q, Zhang N, Gray RS, Li H, Ewald AJ, Zahnow CA, Pan D (2014) A temporal requirement for Hippo signaling in mammary gland differentiation, growth, and tumorigenesis. Genes Dev 28: 432–437 [DOI] [PMC free article] [PubMed] [Google Scholar]
- 16. Lee KP, Lee JH, Kim TS, Kim TH, Park HD, Byun JS, Kim MC, Jeong WI, Calvisi DF, Kim JM et al (2010) The Hippo‐Salvador pathway restrains hepatic oval cell proliferation, liver size, and liver tumorigenesis. Proc Natl Acad Sci USA 107: 8248–8253 [DOI] [PMC free article] [PubMed] [Google Scholar]
- 17. Avruch J, Zhou D, Bardeesy N (2012) YAP oncogene overexpression supercharges colon cancer proliferation. Cell Cycle 11: 1090–1096 [DOI] [PMC free article] [PubMed] [Google Scholar]
- 18. Kang W, Tong JH, Chan AW, Lee TL, Lung RW, Leung PP, So KK, Wu K, Fan D, Yu J et al (2011) Yes‐associated protein 1 exhibits oncogenic property in gastric cancer and its nuclear accumulation associates with poor prognosis. Clin Cancer Res 17: 2130–2139 [DOI] [PubMed] [Google Scholar]
- 19. Overholtzer M, Zhang J, Smolen GA, Muir B, Li W, Sgroi DC, Deng CX, Brugge JS, Haber DA (2006) Transforming properties of YAP, a candidate oncogene on the chromosome 11q22 amplicon. Proc Natl Acad Sci USA 103: 12405–12410 [DOI] [PMC free article] [PubMed] [Google Scholar]
- 20. Steinhardt AA, Gayyed MF, Klein AP, Dong J, Maitra A, Pan D, Montgomery EA, Anders RA (2008) Expression of Yes‐associated protein in common solid tumors. Hum Pathol 39: 1582–1589 [DOI] [PMC free article] [PubMed] [Google Scholar]
- 21. Yu FX, Guan KL (2013) The Hippo pathway: regulators and regulations. Genes Dev 27: 355–371 [DOI] [PMC free article] [PubMed] [Google Scholar]
- 22. He C, Lv X, Hua G, Lele SM, Remmenga S, Dong J, Davis JS, Wang C (2015) YAP forms autocrine loops with the ERBB pathway to regulate ovarian cancer initiation and progression. Oncogene 34: 6040–6054 [DOI] [PMC free article] [PubMed] [Google Scholar]
- 23. Petrilli AM, Fernandez‐Valle C (2016) Role of Merlin/NF2 inactivation in tumor biology. Oncogene 35: 537–548 [DOI] [PMC free article] [PubMed] [Google Scholar]
- 24. Furth N, Aylon Y (2017) The LATS1 and LATS2 tumor suppressors: beyond the Hippo pathway. Cell Death Differ 24: 1488–1501 [DOI] [PMC free article] [PubMed] [Google Scholar]
- 25. Chen HY, Yu SL, Ho BC, Su KY, Hsu YC, Chang CS, Li YC, Yang SY, Hsu PY, Ho H et al (2015) R331W missense mutation of oncogene YAP1 is a germline risk allele for lung adenocarcinoma with medical actionability. J Clin Oncol 33: 2303–2310 [DOI] [PubMed] [Google Scholar]
- 26. He C, Mao D, Hua G, Lv X, Chen X, Angeletti PC, Dong J, Remmenga SW, Rodabaugh KJ, Zhou J et al (2015) The Hippo/YAP pathway interacts with EGFR signaling and HPV oncoproteins to regulate cervical cancer progression. EMBO Mol Med 7: 1426–1449 [DOI] [PMC free article] [PubMed] [Google Scholar]
- 27. Fu D, Lv X, Hua G, He C, Dong J, Lele SM, Li DW, Zhai Q, Davis JS, Wang C (2014) YAP regulates cell proliferation, migration, and steroidogenesis in adult granulosa cell tumors. Endocr Relat Cancer 21: 297–310 [DOI] [PMC free article] [PubMed] [Google Scholar]
- 28. Moroishi T, Park HW, Qin B, Chen Q, Meng Z, Plouffe SW, Taniguchi K, Yu FX, Karin M, Pan D et al (2015) A YAP/TAZ‐induced feedback mechanism regulates Hippo pathway homeostasis. Genes Dev 29: 1271–1284 [DOI] [PMC free article] [PubMed] [Google Scholar]
- 29. Rodier F, Campisi J (2011) Four faces of cellular senescence. J Cell Biol 192: 547–556 [DOI] [PMC free article] [PubMed] [Google Scholar]
- 30. Mizuno T, Murakami H, Fujii M, Ishiguro F, Tanaka I, Kondo Y, Akatsuka S, Toyokuni S, Yokoi K, Osada H et al (2012) YAP induces malignant mesothelioma cell proliferation by upregulating transcription of cell cycle‐promoting genes. Oncogene 31: 5117–5122 [DOI] [PubMed] [Google Scholar]
- 31. Moody CA, Laimins LA (2010) Human papillomavirus oncoproteins: pathways to transformation. Nat Rev Cancer 10: 550–560 [DOI] [PubMed] [Google Scholar]
- 32. Boyer SN, Wazer DE, Band V (1996) E7 protein of human papilloma virus‐16 induces degradation of retinoblastoma protein through the ubiquitin‐proteasome pathway. Cancer Res 56: 4620–4624 [PubMed] [Google Scholar]
- 33. Crook T, Tidy JA, Vousden KH (1991) Degradation of p53 can be targeted by HPV E6 sequences distinct from those required for p53 binding and trans‐activation. Cell 67: 547–556 [DOI] [PubMed] [Google Scholar]
- 34. Aylon Y, Ofir‐Rosenfeld Y, Yabuta N, Lapi E, Nojima H, Lu X, Oren M (2010) The Lats2 tumor suppressor augments p53‐mediated apoptosis by promoting the nuclear proapoptotic function of ASPP1. Genes Dev 24: 2420–2429 [DOI] [PMC free article] [PubMed] [Google Scholar]
- 35. Mooi WJ, Peeper DS (2006) Oncogene‐induced cell senescence–halting on the road to cancer. N Engl J Med 355: 1037–1046 [DOI] [PubMed] [Google Scholar]
- 36. Campisi J (2011) Cellular senescence: putting the paradoxes in perspective. Curr Opin Genet Dev 21: 107–112 [DOI] [PMC free article] [PubMed] [Google Scholar]
- 37. Kuilman T, Michaloglou C, Mooi WJ, Peeper DS (2010) The essence of senescence. Genes Dev 24: 2463–2479 [DOI] [PMC free article] [PubMed] [Google Scholar]
- 38. Storer M, Mas A, Robert‐Moreno A, Pecoraro M, Ortells MC, Di Giacomo V, Yosef R, Pilpel N, Krizhanovsky V, Sharpe J et al (2013) Senescence is a developmental mechanism that contributes to embryonic growth and patterning. Cell 155: 1119–1130 [DOI] [PubMed] [Google Scholar]
- 39. Munoz‐Espin D, Canamero M, Maraver A, Gomez‐Lopez G, Contreras J, Murillo‐Cuesta S, Rodriguez‐Baeza A, Varela‐Nieto I, Ruberte J, Collado M et al (2013) Programmed cell senescence during mammalian embryonic development. Cell 155: 1104–1118 [DOI] [PubMed] [Google Scholar]
- 40. Childs BG, Durik M, Baker DJ, van Deursen JM (2015) Cellular senescence in aging and age‐related disease: from mechanisms to therapy. Nat Med 21: 1424–1435 [DOI] [PMC free article] [PubMed] [Google Scholar]
- 41. Campisi J (2001) Cellular senescence as a tumor‐suppressor mechanism. Trends Cell Biol 11: S27–S31 [DOI] [PubMed] [Google Scholar]
- 42. Braig M, Lee S, Loddenkemper C, Rudolph C, Peters AH, Schlegelberger B, Stein H, Dorken B, Jenuwein T, Schmitt CA (2005) Oncogene‐induced senescence as an initial barrier in lymphoma development. Nature 436: 660–665 [DOI] [PubMed] [Google Scholar]
- 43. Serrano M, Lin AW, McCurrach ME, Beach D, Lowe SW (1997) Oncogenic ras provokes premature cell senescence associated with accumulation of p53 and p16INK4a. Cell 88: 593–602 [DOI] [PubMed] [Google Scholar]
- 44. Courtois‐Cox S, Jones SL, Cichowski K (2008) Many roads lead to oncogene‐induced senescence. Oncogene 27: 2801–2809 [DOI] [PubMed] [Google Scholar]
- 45. Chen Z, Trotman LC, Shaffer D, Lin HK, Dotan ZA, Niki M, Koutcher JA, Scher HI, Ludwig T, Gerald W et al (2005) Crucial role of p53‐dependent cellular senescence in suppression of Pten‐deficient tumorigenesis. Nature 436: 725–730 [DOI] [PMC free article] [PubMed] [Google Scholar]
- 46. Collado M, Gil J, Efeyan A, Guerra C, Schuhmacher AJ, Barradas M, Benguria A, Zaballos A, Flores JM, Barbacid M et al (2005) Tumour biology: senescence in premalignant tumours. Nature 436: 642 [DOI] [PubMed] [Google Scholar]
- 47. Miyauchi H, Minamino T, Tateno K, Kunieda T, Toko H, Komuro I (2004) Akt negatively regulates the in vitro lifespan of human endothelial cells via a p53/p21‐dependent pathway. EMBO J 23: 212–220 [DOI] [PMC free article] [PubMed] [Google Scholar]
- 48. Xie Q, Chen J, Feng H, Peng S, Adams U, Bai Y, Huang L, Li J, Huang J, Meng S et al (2013) YAP/TEAD‐mediated transcription controls cellular senescence. Cancer Res 73: 3615–3624 [DOI] [PubMed] [Google Scholar]
- 49. Fausti F, Di Agostino S, Cioce M, Bielli P, Sette C, Pandolfi PP, Oren M, Sudol M, Strano S, Blandino G (2013) ATM kinase enables the functional axis of YAP, PML and p53 to ameliorate loss of Werner protein‐mediated oncogenic senescence. Cell Death Differ 20: 1498–1509 [DOI] [PMC free article] [PubMed] [Google Scholar]
- 50. Takahashi A, Ohtani N, Yamakoshi K, Iida S, Tahara H, Nakayama K, Nakayama KI, Ide T, Saya H, Hara E (2006) Mitogenic signalling and the p16INK4a‐Rb pathway cooperate to enforce irreversible cellular senescence. Nat Cell Biol 8: 1291–1297 [DOI] [PubMed] [Google Scholar]
- 51. Humbert N, Navaratnam N, Augert A, Da Costa M, Martien S, Wang J, Martinez D, Abbadie C, Carling D, de Launoit Y et al (2010) Regulation of ploidy and senescence by the AMPK‐related kinase NUAK1. EMBO J 29: 376–386 [DOI] [PMC free article] [PubMed] [Google Scholar]
- 52. Tschop K, Conery AR, Litovchick L, Decaprio JA, Settleman J, Harlow E, Dyson N (2011) A kinase shRNA screen links LATS2 and the pRB tumor suppressor. Genes Dev 25: 814–830 [DOI] [PMC free article] [PubMed] [Google Scholar]
- 53. Blais A, van Oevelen CJ, Margueron R, Acosta‐Alvear D, Dynlacht BD (2007) Retinoblastoma tumor suppressor protein‐dependent methylation of histone H3 lysine 27 is associated with irreversible cell cycle exit. J Cell Biol 179: 1399–1412 [DOI] [PMC free article] [PubMed] [Google Scholar]
- 54. Burkhart DL, Sage J (2008) Cellular mechanisms of tumour suppression by the retinoblastoma gene. Nat Rev Cancer 8: 671–682 [DOI] [PMC free article] [PubMed] [Google Scholar]
- 55. Narita M, Nunez S, Heard E, Narita M, Lin AW, Hearn SA, Spector DL, Hannon GJ, Lowe SW (2003) Rb‐mediated heterochromatin formation and silencing of E2F target genes during cellular senescence. Cell 113: 703–716 [DOI] [PubMed] [Google Scholar]
- 56. Zhang R, Chen W, Adams PD (2007) Molecular dissection of formation of senescence‐associated heterochromatin foci. Mol Cell Biol 27: 2343–2358 [DOI] [PMC free article] [PubMed] [Google Scholar]
- 57. Chen Q, Zhang N, Xie R, Wang W, Cai J, Choi KS, David KK, Huang B, Yabuta N, Nojima H et al (2015) Homeostatic control of Hippo signaling activity revealed by an endogenous activating mutation in YAP. Genes Dev 29: 1285–1297 [DOI] [PMC free article] [PubMed] [Google Scholar]
- 58. Cancer Genome Atlas Research, N (2011) Integrated genomic analyses of ovarian carcinoma. Nature 474: 609–615 [DOI] [PMC free article] [PubMed] [Google Scholar]
- 59. Wang C, Lv X, He C, Hua G, Tsai MY, Davis JS (2013) The G‐protein‐coupled estrogen receptor agonist G‐1 suppresses proliferation of ovarian cancer cells by blocking tubulin polymerization. Cell Death Dis 4: e869 [DOI] [PMC free article] [PubMed] [Google Scholar]
- 60. Hua G, He C, Lv X, Fan L, Wang C, Remmenga SW, Rodabaugh KJ, Yang L, Lele SM, Yang P et al (2016) The four and a half LIM domains 2 (FHL2) regulates ovarian granulosa cell tumor progression via controlling AKT1 transcription. Cell Death Dis 7: e2297 [DOI] [PMC free article] [PubMed] [Google Scholar]
- 61. Lv X, He C, Huang C, Hua G, Wang Z, Remmenga SW, Rodabough KJ, Karpf AR, Dong J, Davis JS et al (2017) G‐1 inhibits breast cancer cell growth via targeting colchicine‐binding site of tubulin to interfere with microtubule assembly. Mol Cancer Ther 16: 1080–1091 [DOI] [PMC free article] [PubMed] [Google Scholar]
- 62. Wang C, Roy SK (2010) Expression of E‐cadherin and N‐cadherin in perinatal hamster ovary: possible involvement in primordial follicle formation and regulation by follicle‐stimulating hormone. Endocrinology 151: 2319–2330 [DOI] [PMC free article] [PubMed] [Google Scholar]
- 63. Wang C, Lv X, Jiang C, Cordes CM, Fu L, Lele SM, Davis JS (2012) Transforming growth factor alpha (TGFalpha) regulates granulosa cell tumor (GCT) cell proliferation and migration through activation of multiple pathways. PLoS ONE 7: e48299 [DOI] [PMC free article] [PubMed] [Google Scholar]
- 64. Gao J, Aksoy BA, Dogrusoz U, Dresdner G, Gross B, Sumer SO, Sun Y, Jacobsen A, Sinha R, Larsson E et al (2013) Integrative analysis of complex cancer genomics and clinical profiles using the cBioPortal. Sci Signal 6: pl1 [DOI] [PMC free article] [PubMed] [Google Scholar]
Associated Data
This section collects any data citations, data availability statements, or supplementary materials included in this article.
Supplementary Materials
Appendix
Expanded View Figures PDF
Source Data for Appendix
Review Process File
Source Data for Figure 1
Source Data for Figure 2
Source Data for Figure 3
Source Data for Figure 4
Source Data for Figure 5
Source Data for Figure 6