

Abstract
Promoter‐associated long non‐coding RNAs (lncRNAs) regulate the expression of adjacent genes; however, precise roles of these lncRNAs in skeletal muscle remain largely unknown. Here, we characterize a promoter‐associated lncRNA, Myoparr, in myogenic differentiation and muscle disorders. Myoparr is expressed from the promoter region of the mouse and human myogenin gene, one of the key myogenic transcription factors. We show that Myoparr is essential both for the specification of myoblasts by activating neighboring myogenin expression and for myoblast cell cycle withdrawal by activating myogenic microRNA expression. Mechanistically, Myoparr interacts with Ddx17, a transcriptional coactivator of MyoD, and regulates the association between Ddx17 and the histone acetyltransferase PCAF. Myoparr also promotes skeletal muscle atrophy caused by denervation, and knockdown of Myoparr rescues muscle wasting in mice. Our findings demonstrate that Myoparr is a novel key regulator of muscle development and suggest that Myoparr is a potential therapeutic target for neurogenic atrophy in humans.
Keywords: chromatin, DEAD box protein, myogenesis, transcriptional regulation
Subject Categories: Development & Differentiation, RNA Biology
Introduction
Long non‐coding RNAs (lncRNAs) are pervasively transcribed from the genome. Intriguingly, most intergenic lncRNAs are derived from cis‐regulatory regions, i.e., enhancers and promoters 1. Enhancer‐derived lncRNAs, also known as eRNAs, are generally short, unstable, and bidirectional, and their generation is strongly associated with enhancer activity 2. Besides the enhancer region, multiple RNA polymerase II (Pol II)‐dependent promoters bidirectionally produce coding and non‐coding transcripts 3. Although promoter upstream transcripts (PROMPTs) are rapidly turned over by the RNA exosome 4, 5, increasing evidence indicates that promoter‐associated anti‐sense lncRNAs act in cis to regulate the transcription of neighboring protein‐coding genes, particularly as developmental regulators 3, 6, 7, 8. However, molecular characterization of these lncRNAs in cell proliferation, differentiation, and diseases remains unexplored.
The differentiation process of skeletal muscle cells, called myogenesis, has been studied as a model of cell differentiation systems. One of the myogenic regulatory factors (MRFs), MyoD, triggers the expression of cyclin‐dependent kinase inhibitors to arrest the cell cycle of proliferating myoblasts 9 and also initiates the expression of early skeletal muscle‐specific genes including myogenin, coding one MRF 10. Subsequently, MyoD and myogenin promote the entry of myoblasts into the myogenic differentiation lineage through the activation of later skeletal muscle‐specific genes 11. Additionally, muscle‐specific microRNAs (miRNAs) broaden the regulatory networks of myogenesis by modulating the expression of target genes in myoblast proliferation and differentiation 12. Thus, induction of muscle‐specific genes coordinated with the cell cycle exit at an appropriate time is required for the formation of terminally differentiated skeletal muscle cells.
Myogenin gene is indispensable for skeletal muscle development 13. The expression of myogenin is highly restricted to myogenic tissues in embryonic, fetal, and adult skeletal muscles. However, the mechanisms inducing high‐level myogenin expression in skeletal muscle cells have not been elucidated. In this study, we identified a novel promoter‐associated lncRNA, Myoparr, derived from the upstream region of the myogenin gene. Myoparr was coexpressed with myogenin and was essential for the active transcription of myogenin in an epigenetic manner. Thus, identification of Myoparr uncovered a molecular mechanism required for high‐level myogenin expression. Besides myogenin expression, Myoparr was essential to activate the expression of myogenic miRNAs, which control cell cycle withdrawal of myoblasts. In addition, we found that Myoparr bound Ddx17, a transcriptional coactivator of MyoD, and promoted the protein–protein interaction between Ddx17 and histone acetyltransferase PCAF, indicating that Myoparr functions by binding with transcriptional activator during myogenesis. Furthermore, we identified the human Myoparr counterpart from human primary skeletal muscle cells and provided in vivo evidence that Myoparr knockdown (KD) blocked neurogenic atrophy in mice. Thus, our study not only reveals a new role of promoter‐associated lncRNAs in cell proliferation and differentiation but also provides insight into human regenerative medicine targeting promoter‐associated lncRNAs.
Results
Identification and characterization of a myogenin promoter‐associated lncRNA, Myoparr, in skeletal muscle cells
Although the proximal 133 bp of the myogenin promoter region is sufficient to define its spatiotemporal expression, up to 1.5 kb of upstream region is required for high‐level myogenin expression in mouse skeletal muscle 14. Publicly available chromatin immunoprecipitation (ChIP) sequencing (ChIP‐seq) data showed the occupancy of Pol II around this locus in terminally differentiated myotubes (Fig 1A), suggesting that the upstream region of myogenin is transcriptionally active. Thus, we performed reverse transcription polymerase chain reaction (RT–PCR) to ascertain whether this region is actively transcribed in C2C12 myotubes and detected previously unidentified transcripts in an RT‐dependent manner in at least four different regions (Fig 1B). Subsequent strand‐specific RT–PCR using total and poly(A)+ RNAs showed the presence of polyadenylated anti‐sense and sense transcripts in the upstream region of myogenin (Fig 1C).
Figure 1. A promoter‐associated lncRNA, Myoparr, is expressed from the upstream region of the myogenin locus.
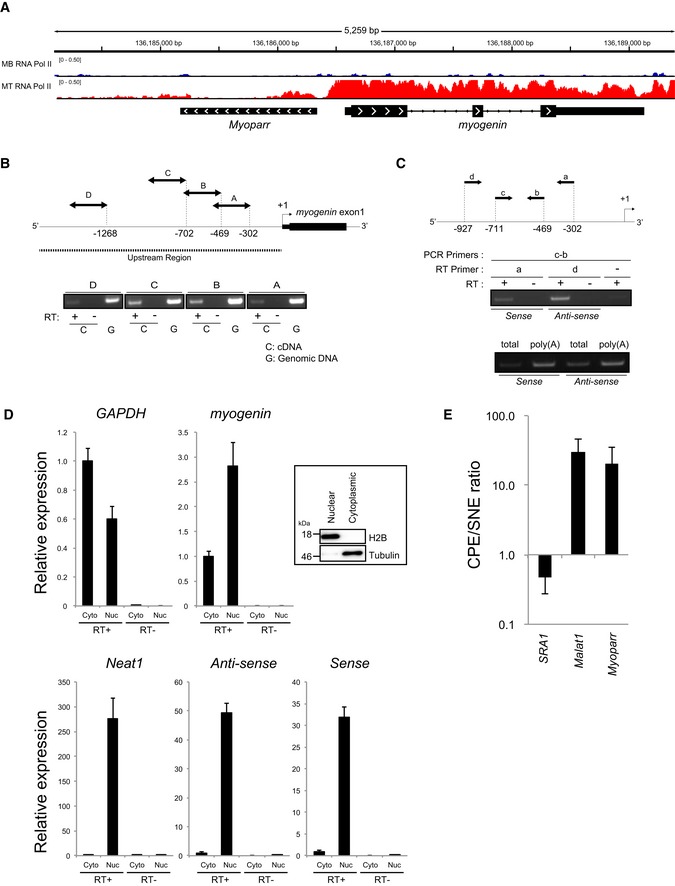
- Occupancies of Pol II at the myogenin locus in C2C12 myoblasts (MB, shown in blue) and myotubes (MT, shown in red). Myoparr is located immediately upstream from the myogenin gene.
- Schematic representation of the upstream region of myogenin and amplified regions by RT–PCR (top). RT–PCR for the novel transcripts at the upstream region of myogenin in C2C12 myotubes (bottom). The presence or absence of reverse transcriptase (RT) is shown by (+) or (−), respectively. The templates (cDNA or genomic DNA) are indicated by C or G, respectively.
- The primers used for RT–PCR (top). Strand‐specific RT–PCR for the novel transcripts at the upstream region of myogenin in C2C12 myotubes using total RNA (middle and bottom) and poly(A)+ RNA (bottom).
- Relative expression of indicated RNAs in differentiating C2C12 cells. The presence or absence of RT is shown by (+) or (−), respectively. PCR products were verified by sequencing. n = 3, mean ± SD. The nuclear/cytoplasmic fractionation is confirmed by the expression of H2B and tubulin, respectively.
- Chromatin pellet extract (CPE)/soluble nuclear extract (SNE) ratio of SRA1, Malat1, and Myoparr in C2C12 myotubes on a log scale. n = 3, mean ± SD.
Both full‐length transcripts were determined by rapid amplification of cDNA ends (RACE) analyses. The 5′‐ and 3′‐RACE of the anti‐sense transcript revealed a single exon transcript, expressed from the upstream region (−243 to −1414) of the myogenin gene (Fig EV1A). The transcription start site of myogenin was positioned as +1. On the other hand, the 5′‐ and 3′‐RACE of the sense transcript revealed the presence of multiple 5′‐ and 3′‐ends initiated from 2.5 to 2.8 kb upstream of the myogenin gene (Fig EV1A). Relatively weak sense transcript detected by the strand‐specific RT–PCR would be due to intron‐derived sequences. Although the 3′‐ends of the sense transcripts mainly overlapped with myogenin mRNA, sequences encoding the initiating methionine of myogenin were lost in almost every sense transcript examined.
Figure EV1. Characterization of mouse and human Myoparr .
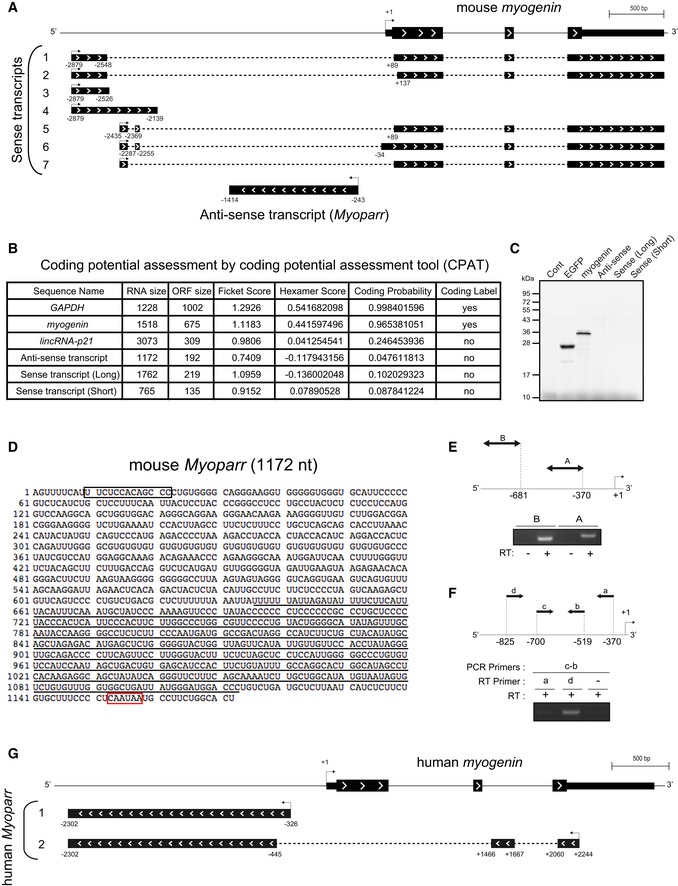
- Schematic diagram of the results of 5′‐ and 3′‐RACE analysis of sense and anti‐sense transcripts. The 3′‐ends of several sense transcripts overlap with myogenin mRNA.
- Coding potential assessment of the indicated RNAs using a coding potential assessment tool (CPAT). Low coding probabilities for anti‐sense transcript and sense transcript 1 (Long) and 4 (Short) as well as lincRNA‐p21 are shown.
- In vitro transcription/translation of pCS2‐Anti‐Sense, pCS2‐Sense (Long), and pCS2‐Sense (Short). The pCS2+ vector was used as a negative control. pCS2‐EGFP and pCS2‐myogenin were used as positive controls.
- The sequence of Myoparr cloned from mouse C2C12 cells. The potential RNA nuclear retention signal and putative polyadenylation signal are enclosed in a black and red box, respectively. The LINE‐1‐like sequence is underlined.
- Schematic representation of the upstream region of human myogenin and regions amplified by RT–PCR (top). RT–PCR for novel transcripts in human primary myotubes (bottom). The presence or absence of reverse transcriptase (RT) is indicated by (+) or (−), respectively.
- The primers used for RT–PCR (top). Strand‐specific RT–PCR for the novel transcripts in the upstream region of human myogenin (bottom).
- Schematic diagram of the results of 5′‐ and 3′‐RACE analysis of human Myoparr.
The nuclear/cytoplasmic expression of both transcripts was quantified by quantitative PCR (qPCR) in differentiating C2C12 cells. As compared to protein‐coding RNAs such as myogenin and GAPDH, both anti‐sense and sense transcripts were concentrated in the nuclei as with Neat1 non‐coding RNA (Fig 1D). In silico analyses of protein‐coding potential predicted that both transcripts are non‐coding RNAs (Fig EV1B). Indeed, no translated proteins from either transcript were detected in vitro, whereas EGFP and myogenin generated corresponding proteins (Fig EV1C). From these results, we concluded that both transcripts are putative non‐coding RNAs. Therefore, we referred to the anti‐sense transcript as a myo genin promoter‐associated myogenic regulatory anti‐sense long non‐coding RNA (Myoparr) and the sense transcript as myogenin‐associated sense long non‐coding RNA.
Full‐length Myoparr (1,172 nt from C2C12 myotubes and 1,167 nt from murine skeletal muscle) was detected and cloned by PCR. Myoparr contains a potential RNA nuclear retention signal 15 at the 5′‐side, a putative polyadenylation signal 15‐nt upstream of the poly(A) tail, and a LINE‐1‐like sequence in the 3′‐half (Fig EV1D). In C2C12 myotubes, Myoparr was more enriched in chromatin pellet extract (CPE) than in soluble nuclear extract (SNE) as with Malat1, which associates with chromatin 16 (Fig 1E), suggesting that the presence of Myoparr as chromatin‐enriched RNA affects the expression of neighboring genes 17. We successfully detected an anti‐sense transcript at the upstream region of myogenin in human primary myotubes (Fig EV1E and F) and determined that the 5′‐ and 3′‐ends of the transcript corresponded to the human counterpart of Myoparr by RACE analyses (Fig EV1G). Genomic localization of both mouse and human Myoparr is shown in Appendix Fig S1A and B and listed in Appendix Table S1. In this study, we further examined the role of Myoparr in myogenic cell proliferation and differentiation through the activation of myogenin expression.
The expression of Myoparr and myogenin is mutually correlated and regulated by MyoD and TGF‐β
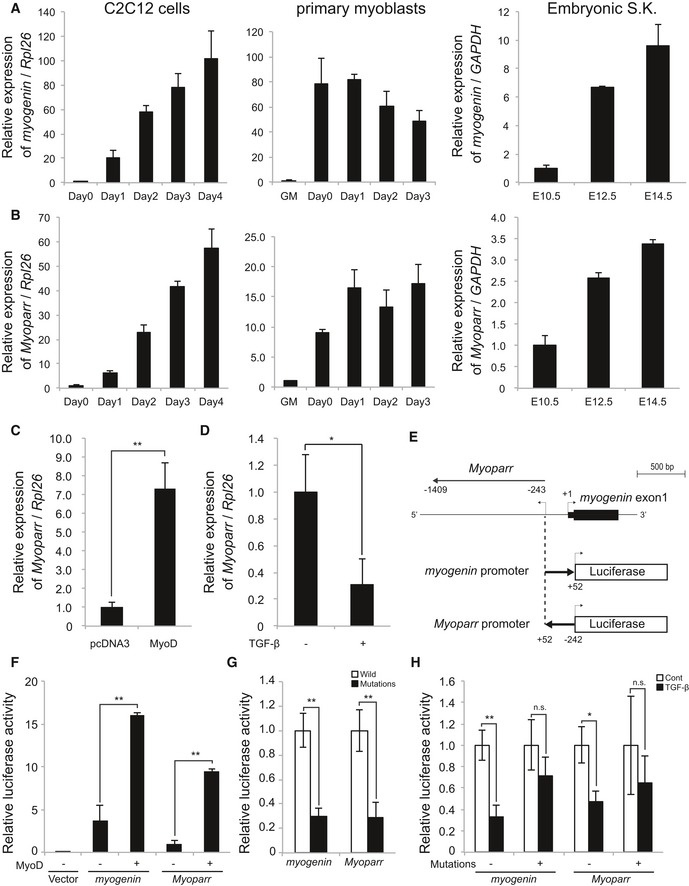
We first examined the expression pattern of Myoparr during skeletal muscle differentiation. Similar to myogenin expression, Myoparr expression gradually increased during in vitro (C2C12 cells and mouse primary myoblasts) and in vivo (mouse embryos) myogenesis (Fig 2A and B). Among embryonic organs, Myoparr expression was enriched in skeletal muscle tissue as with myogenin expression (Fig EV2A). Absolute quantification assays showed that Myoparr is present at 5.0 ± 0.7 copies per cell and myogenin is present at 1,868.7 ± 351.1 copies per cell in differentiating C2C12 cells. Thus, the expression level of Myoparr was low compared with that of myogenin, in accordance with the expression level of other lncRNAs 18. We also found that the expression of human Myoparr and myogenin increased during human myoblast differentiation (Fig EV2B). These results indicated that the expression of Myoparr and myogenin is mutually correlated during skeletal muscle differentiation in both humans and mouse.
Figure 2. Myoparr expression is correlated with myogenin expression and regulated by MyoD and TGF‐β.
-
A, BQuantitative RT–PCR for myogenin (A) and Myoparr (B) during myogenesis of C2C12 cells, primary mouse myoblasts (growth medium, GM), and mouse embryonic skeletal muscle (S.K.). The x‐axis shows days after differentiation induction or embryonic days. n = 3, mean ± SD.
-
CqRT–PCR showing increased Myoparr expression by MyoD in C3H10T1/2 fibroblasts. n = 4, mean ± SD. **P < 0.01 (unpaired two‐tailed Welch's t‐test).
-
DTreatment of recombinant TGF‐β for 24 h decreased Myoparr expression in differentiating C2C12 cells. n = 3, mean ± SD. *P < 0.05 (unpaired two‐tailed Student's t‐test).
-
ESchematic diagram of the constructs used for luciferase assays.
-
FRelative luciferase activities of the indicated promoter in differentiating C2C12 cells by exogenous MyoD. n = 3, mean ± SD. **P < 0.01 (unpaired two‐tailed Student's t‐test).
-
GRelative luciferase activities of the indicated promoter with/without E‐box mutations in differentiating C2C12 cells. n = 3, mean ± SD. **P < 0.01 (unpaired two‐tailed Student's t‐test).
-
HRelative luciferase activities of the indicated promoter with/without E‐box mutations in differentiating C2C12 cells by TGF‐β treatment. n = 3, mean ± SD. *P < 0.05. **P < 0.01. n.s., not significant (unpaired two‐tailed Student's t‐test).
Figure EV2. Expression of mouse and human Myoparr .
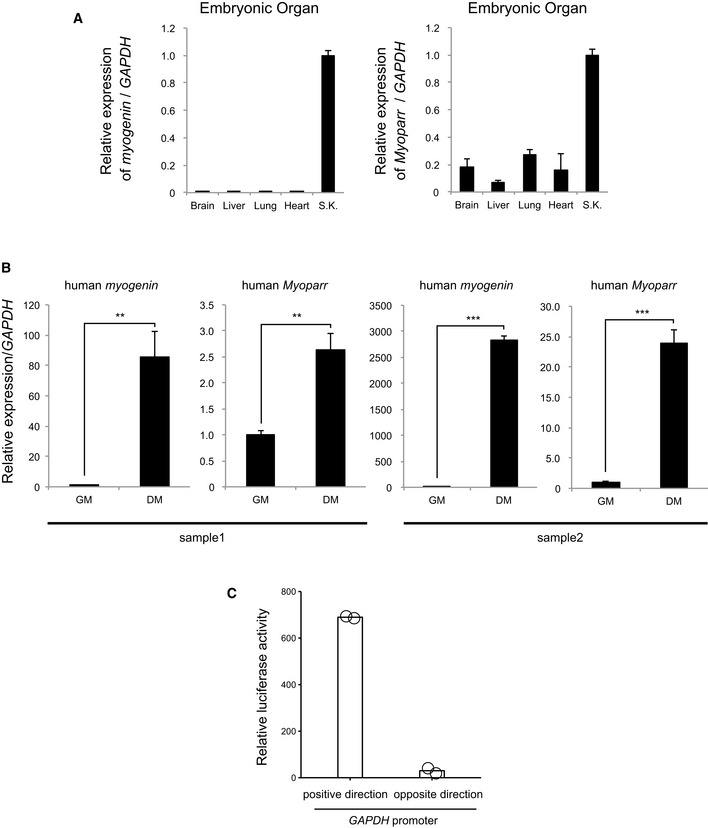
- Quantitative RT–PCR for mouse myogenin and Myoparr in embryonic organs. n = 3, mean ± SD. S.K., skeletal muscle.
- The expression levels of human myogenin and Myoparr in human primary myoblasts (growth medium, GM) and myotubes (differentiation medium, DM) evaluated by qRT–PCR. n = 4, mean ± SD. **P < 0.01. ***P < 0.001 (unpaired two‐tailed Welch's t‐test). Preparations from two independent specimens are shown.
- Relative luciferase activities of the GAPDH promoters (positive and opposite directions) in C2C12 cells. Bars indicate the average of two independent experiments, and open circles represent the values of each experiment.
We next examined whether Myoparr expression is regulated by MyoD and TGF‐β, which control myogenin expression positively and negatively, respectively 13, 19. During the conversion of C3H10T1/2 fibroblasts into myogenic cells by MyoD expression, a significant increase in Myoparr expression was observed (Fig 2C). In contrast, TGF‐β treatment significantly decreased Myoparr expression during C2C12 differentiation (Fig 2D), suggesting a common regulatory mechanism underlying Myoparr and myogenin expression. Since the intergenic region between Myoparr and myogenin is very short (Fig 2E), we hypothesized that Myoparr shares a common promoter with myogenin. Accordingly, the intergenic region was cloned, and its transcriptional activities in both directions were measured by luciferase assay. During C2C12 differentiation, this region showed bidirectional promoter activity (Fig 2F); the Myoparr promoter activity was a quarter of that of the myogenin promoter, whereas the unidirectional GAPDH promoter showed no activity in the opposite direction (Fig EV2C). MyoD expression increased both promoter activities in differentiating C2C12 cells (Fig 2F). Introduction of mutations in the E‐box elements that are important for responsiveness of MyoD and TGF‐β 20 significantly decreased the activation of both promoters (Fig 2G). TGF‐β treatment also decreased both promoter activities (Fig 2H), and mutations in the E‐box elements effectively attenuated TGF‐β‐dependent repression of both promoter activities (Fig 2H). Taken together, these results indicated that common regulatory mechanisms may play a role in the expression of Myoparr and myogenin.
Myoparr is required for myogenic differentiation through the activation of myogenin expression
The strong correlation between Myoparr and myogenin expression suggested a reciprocal regulation of these genes during myogenesis. To examine whether Myoparr is a significant regulator of myogenin or only a transcriptional artifact from the bidirectional promoter, we knocked down Myoparr using two distinct small interfering RNAs (siRNAs) in differentiating C2C12 cells. The expression of myogenin mRNA and protein induced by serum withdrawal was markedly inhibited by Myoparr depletion (Fig 3A and B). The same results were observed by anti‐sense oligonucleotides (ASOs)‐mediated Myoparr KD (Fig EV3A–C). On the contrary, Myoparr expression was increased by myogenin KD (Fig 3C), possibly resulting from genetic compensation and/or feedback regulation. These results suggested that Myoparr is not simply a transcriptional artifact, but rather a significant activator of myogenin during myogenic differentiation.
Figure 3. Myoparr is required for the activation of myogenin and C2C12 differentiation.
-
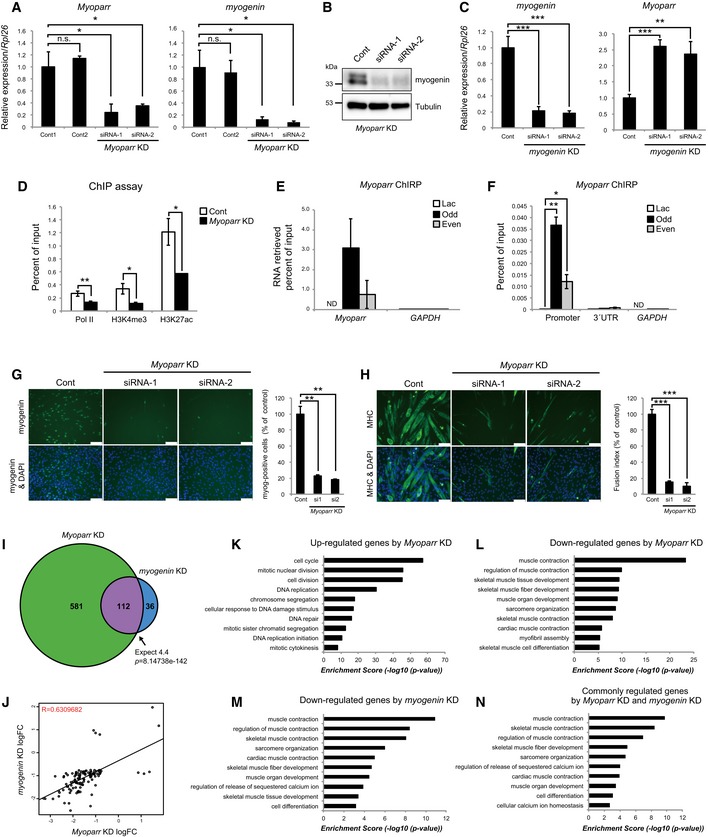
AC2C12 cells were transfected with 50 nM of indicated siRNAs in growth medium. After additional 24‐h incubation in growth medium, cells were transferred to differentiation medium. The levels of Myoparr and myogenin expression were quantified by qRT–PCR 24 h after differentiation induction. n = 3, mean ± SD. *P < 0.05. n.s., not significant. Statistical analyses were performed using unpaired two‐tailed Student's t‐test (Myoparr; Cont1 vs. siRNA‐1, myogenin; Cont1 vs. Cont2). In cases of unequal variances (Myoparr; Cont1 vs. Cont2 and Cont1 vs. siRNA‐2, myogenin; Cont1 vs. siRNA‐1 and Cont1 vs. siRNA‐2), unpaired two‐tailed Welch's t‐test was used.
-
BWestern blot showing decreased expression of myogenin in differentiating C2C12 cells 48 h after Myoparr KD. Tubulin expression served as an internal control.
-
CThe expression levels of myogenin and Myoparr evaluated by qRT–PCR in myogenin‐depleted C2C12 cells. n = 3, mean ± SD. **P < 0.01. ***P < 0.001 (unpaired two‐tailed Student's t‐test).
-
DChIP‐qPCR detection of Pol II occupancy and histone modification status at the myogenin locus in Myoparr‐depleted differentiating C2C12 cells. The data were normalized to input values. n = 3, mean ± SD. *P < 0.05. **P < 0.01 (unpaired two‐tailed Student's t‐test or unpaired two‐tailed Welch's t‐test).
-
ERetrieval rate of Myoparr using Myoparr‐ChIRP probes from C2C12 cells quantified by qPCR is shown as percent of input values. GAPDH was amplified as a negative control. n = 3, mean ± SD. ND, not detected.
-
FChIRP‐qPCR detection of the interaction between endogenous Myoparr and the myogenin promoter. The myogenin 3′UTR and GAPDH promoter were amplified as negative controls. The data were normalized to input values. n = 3, mean ± SD. *P < 0.05. **P < 0.01 (unpaired two‐tailed Welch's t‐test). ND, not detected.
-
G, HImmunocytochemistry for the detection of myogenin at 24 h (G) or MHC at 72 h (H) in Myoparr‐depleted C2C12 cells after differentiation induction. Nuclei were counterstained with DAPI. Scale bars, 100 μm. The percentage of myogenin‐positive cells or fusion index is shown as percent of the control. n = 3, mean ± SD. **P < 0.01 (unpaired two‐tailed Welch's t‐test). ***P < 0.001 (unpaired two‐tailed Student's t‐test).
-
IThe intersection of genes regulated by Myoparr KD and myogenin KD shows a significant (Fisher's exact test) overlap 25.6 times as large as expected by chance alone.
-
JGenes significantly differentially expressed in both Myoparr‐ and myogenin‐depleted cells show correlated expression (R = 0.63, log 2 ratio scale).
-
K–NEnrichment of GO categories in genes up‐regulated by Myoparr KD (K), down‐regulated by Myoparr KD (L), down‐regulated by myogenin KD (M), and commonly regulated by both Myoparr KD and myogenin KD (N).
Figure EV3. Regulation of myogenin expression by Myoparr .
-
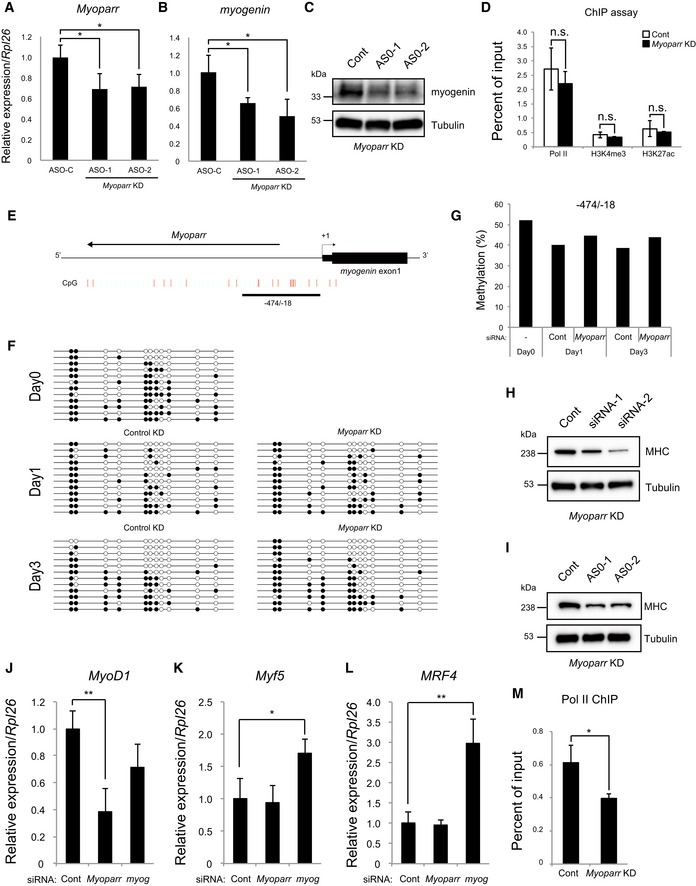
AQuantitative RT–PCR for Myoparr expression in differentiating C2C12 cells transfected with control or Myoparr anti‐sense oligonucleotides (ASOs). Cells were transfected with 50 nM ASOs, and the levels of Myoparr expression were quantified by qRT–PCR 48 h after knockdowns. n = 3, mean ± SD. *P < 0.05 (unpaired two‐tailed Student's t‐test).
-
BqRT–PCR showing decreased myogenin expression in differentiating C2C12 cells transfected with control or Myoparr ASOs. n = 4, mean ± SD. *P < 0.05 (unpaired two‐tailed Student's t‐test).
-
CDecreased myogenin protein expression in differentiating C2C12 cells 48 h after Myoparr knockdown using ASOs. Expression of tubulin served as an internal control.
-
DChIP‐qPCR detection of Pol II occupancy and histone modification status at the GAPDH promoter in Myoparr‐depleted differentiating C2C12 cells. The data were normalized to input values. n = 3, mean ± SD. n.s., not significant. Statistical analyses were performed using an unpaired two‐tailed Student's t‐test (Pol II and H3K4me3). In cases of unequal variances (H3K27ac), an unpaired two‐tailed Welch's t‐test was used.
-
EA schematic diagram of the CpG sites at the myogenin upstream region. Red lines indicate individual CpG sites. The methylation status at the −474/−18 region in Myoparr‐depleted C2C12 cells was examined.
-
FThe methylation status at the −474/−18 region is shown. C2C12 cells were transfected with 50 nM siRNAs. The methylation status was evaluated 1 and 3 days after differentiation induction. The day 0 sample is from non‐transfected cells. The CpG sites are indicated by circles (black and white circles indicate methylated and unmethylated cytosine sites, respectively), and each row represents an individual clone.
-
GThe methylation status of (F) is shown as a methylated/unmethylated ratio.
-
H, IDecreased MHC expression by Myoparr knockdowns using siRNAs (H) or ASOs (I) in C2C12 myotubes. Expression of tubulin served as an internal control.
-
J–LThe expression changes of MyoD1 (J), Myf5 (K), and MRF4 (L) quantified by qRT–PCR either in Myoparr‐ or myogenin‐depleted differentiating C2C12 cells. n = 3, mean ± SD. *P < 0.05. **P < 0.01 (unpaired two‐tailed Student's t‐test).
-
MDecreased Pol II occupancy at the MyoD1 promoter detected by ChIP‐qPCR in Myoparr‐depleted differentiating C2C12 cells. The data were normalized to input values. n = 3, mean ± SD. *P < 0.05 (unpaired two‐tailed Student's t‐test).
To understand the mechanisms involved in Myoparr‐mediated augmentation of myogenin mRNA expression, we assessed the occupancy of Pol II at the myogenin locus. ChIP assays revealed that Myoparr KD resulted in the reduction of Pol II occupancy at the myogenin locus but not at the control GAPDH locus (Figs 3D and EV3D). Moreover, Myoparr depletion led to significant decreases in H3K4me3 and H3K27ac levels, landmarks of active promoters, at the myogenin locus (Fig 3D). Although promoter‐associated lncRNAs were previously shown to alter the DNA methylation status 8, Myoparr depletion had little effect on DNA methylation of the myogenin locus (Fig EV3E–G). To examine whether Myoparr directly binds to the myogenin promoter region, we performed chromatin isolation by RNA purification (ChIRP) assays with Myoparr probes (odd‐ and even‐numbered). We were able to specifically recover endogenous Myoparr from differentiating C2C12 cells with Myoparr probes, compared with GAPDH mRNA as a negative control (Fig 3E). Enrichment of Myoparr was not observed with control LacZ probes. Myoparr probes also enriched the myogenin promoter region but not the myogenin 3′ untranslated region (UTR) and GAPDH promoter in ChIRP assays (Fig 3F), indicating that endogenous Myoparr bound to the myogenin promoter in differentiating C2C12 cells. Thus, these results indicated that Myoparr is required to maintain an active promoter signature around the myogenin locus through binding to target chromatin during C2C12 myogenesis.
Given the known roles of myogenin in skeletal muscle differentiation, we examined the biological role of Myoparr in C2C12 differentiation. At an early phase of myogenic differentiation, Myoparr KD significantly decreased the number of myogenin‐positive cells (Fig 3G). At a later phase, Myoparr KD led to repression of myogenic differentiation as shown by decreased expression of myosin heavy chain (MHC), a late myogenic differentiation marker (Figs 3H and EV3H and I). Moreover, Myoparr depletion significantly reduced MyoD1 expression accompanied with a decline of Pol II occupancy at the MyoD1 locus (Fig EV3J–M), suggesting that Myoparr supports MyoD1 expression in a positive feedback loop.
To investigate the effect of Myoparr depletion more extensively, we compared global gene expression profiles between Myoparr‐ and myogenin‐depleted C2C12 cells using RNA sequencing (RNA‐seq). Statistically significant expression changes were observed in 693 genes (299 up‐regulated and 394 down‐regulated) by Myoparr KD, while the expression levels of 148 genes (23 up‐regulated and 125 down‐regulated) were significantly altered by myogenin KD (Table EV1). The intersection of genes showing significantly different expression in both Myoparr and myogenin depletion was 25.6‐fold greater than that expected by chance (P = 8.14738 × 10−142; Fig 3I and Table EV1), with a positive correlation (R = 0.63; Fig 3J). However, the expression of a large number of genes regulated by Myoparr was not significantly altered by myogenin KD, suggesting that Myoparr may also act in a myogenin‐independent manner. In agreement with this finding, genes up‐regulated by Myoparr KD were preferentially classified as cell cycle and cell division categories based on Gene Ontology (GO), whereas genes whose expression was down‐regulated by Myoparr KD or myogenin KD were enriched in muscle contraction and muscle development categories (Fig 3K–M and Table EV1). Genes commonly regulated by both Myoparr KD and myogenin KD (112 genes) were also preferentially classified as muscle contraction and muscle development categories (Fig 3N). Of note, genes up‐regulated by myogenin KD were not classified. The results of RNA‐seq were verified by qPCR of representative genes in each GO category using two independent siRNAs (Appendix Fig S2A–H). From these results, we concluded that Myoparr is essential for specification of myoblasts to differentiation lineage through the Myoparr (upstream) and myogenin (downstream) pathway and that Myoparr also likely regulates the cell cycle and cell division pathway in a myogenin‐independent manner.
Myoparr interacts with DEAD box protein Ddx17 and regulates the protein–protein interaction between Ddx17 and histone acetyltransferase PCAF
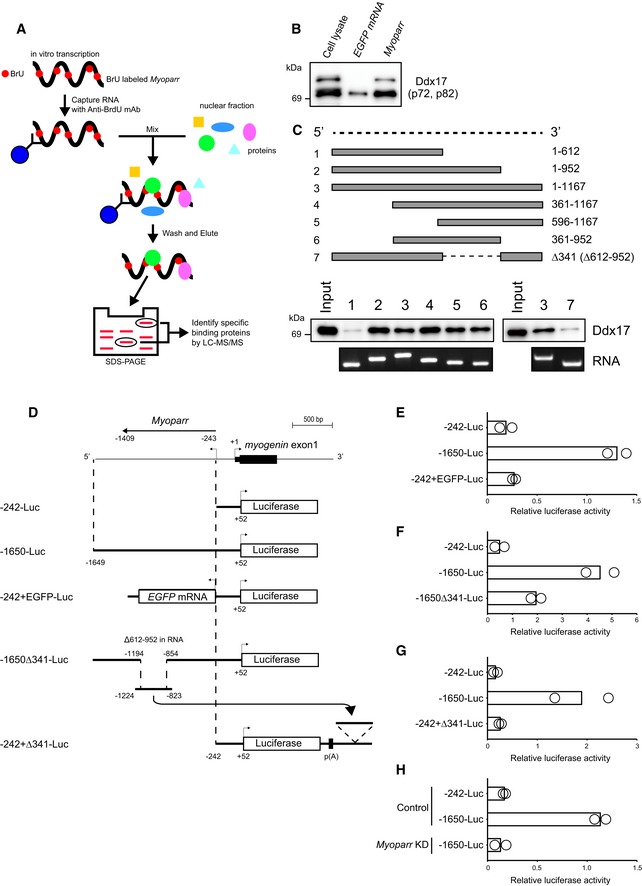
The lncRNA–protein interactions influence the expression of neighboring genes 21; therefore, identifying proteins associated with Myoparr is crucial to determine the mechanisms underlying Myoparr‐mediated transcriptional activation. Myoparr labeled with 5‐bromouridine (BrU) was mixed with nuclear lysates extracted from C2C12 myotubes. Following immunoprecipitation of Myoparr with a BrdU antibody, RNA–protein complexes were competitively eluted with free 5‐bromo‐2′‐deoxyuridine (BrdU). After electrophoresis, protein bands specifically enriched in the Myoparr immunoprecipitant compared with the control sample were excised. Myoparr‐interacting proteins were then analyzed by LC‐MS/MS (Fig 4A). We identified Ddx17 (both p72 and p82 isoforms), hnRNPK, and Tial1/TIAR as Myoparr‐associated proteins (Appendix Fig S3A). Among these proteins, the association of DEAD box RNA helicase Ddx17 with Myoparr was of interest, because Ddx17 was shown to be required for myogenesis 22, 23. We thus investigated the role of Ddx17 in Myoparr‐mediated transcriptional activation. Specific association of Myoparr with endogenous Ddx17 was confirmed by Myoparr immunoprecipitation followed by immunoblotting with a Ddx17‐specific antibody (Fig 4B). In addition, the 341‐nt region of Myoparr was shown to be required for binding with Ddx17 by RNA pull‐down experiments (Fig 4C). Furthermore, intracellular binding between endogenous Myoparr and Ddx17 was confirmed by RNA immunoprecipitation using a Ddx17‐specific antibody and qRT–PCR (Appendix Fig S3B). These results indicated a direct interaction between Myoparr and Ddx17 and suggested the involvement of this interaction in Myoparr‐mediated transcriptional activation.
Figure 4. Myoparr interacts with DEAD box protein Ddx17.
-
AScheme of the identification of Myoparr‐interacting proteins using RiboTrap and differential proteomics analysis.
-
BFollowing immunoprecipitation, the interaction between Myoparr and endogenous Ddx17 was confirmed by immunoblotting using a Ddx17‐specific antibody. Two different Ddx17 isoforms (p72 and p82) were observed.
-
CDetermination of the Ddx17‐binding region of Myoparr by RNA pull‐down analyses. Schematic diagram of full‐length or truncated Myoparr used for RNA pull‐down (top). In vitro‐transcribed/in vitro‐translated Ddx17 protein was pulled down by indicated Myoparr and then detected by Western blot using a Ddx17 antibody (bottom).
-
DSchematic diagram of the constructs used for luciferase assays. The details of all constructs are described in Materials and Methods. p(A) indicates poly(A) site.
-
E–GRelative luciferase activities of indicated constructs in differentiating C2C12 cells.
-
HRelative luciferase activities of indicated constructs in differentiating C2C12 cells transfected with control or Myoparr shRNA (Myoparr KD).
The process of lncRNA transcription rather than lncRNA transcripts may contribute to neighboring gene regulation 24. We then determined whether Myoparr transcription or Myoparr transcript is required for the activation of myogenin. We showed that Myoparr depletion altered histone modifications at the myogenin locus (Fig 3D). Therefore, we cloned the upstream region of myogenin (−1649 to +52; containing myogenin promoter region and Myoparr, Fig 4D) into an episomal luciferase vector, which forms a proper chromatin structure 25, to create the −1650‐Luc. In comparison with the −242‐Luc (−242 to +52; containing myogenin promoter region but not Myoparr), the −1650‐Luc showed 6.5‐fold higher promoter activity, whereas insertion of EGFP instead of Myoparr (−242+EGFP‐Luc) showed no increased activity in differentiating C2C12 cells (Fig 4E and Appendix Fig S3C). Deletion of the upstream region of myogenin (−1194 to −854), which corresponds to the Ddx17‐binding region of Myoparr (612–952 in RNA), from the −1650‐Luc greatly reduced the activity of the −1650‐Luc (Fig 4F). The deleted region had no classical enhancer activity (Fig 4G), indicating the importance of the Ddx17‐binding region of Myoparr for the activation of myogenin promoter. In accordance with these findings, elevated activity of the −1650‐Luc was completely abolished by Myoparr KD in differentiating C2C12 cells (Fig 4H and Appendix Fig S3D). Thus, these results indicated that Myoparr transcript containing the Ddx17‐binding region is crucial for myogenin activation.
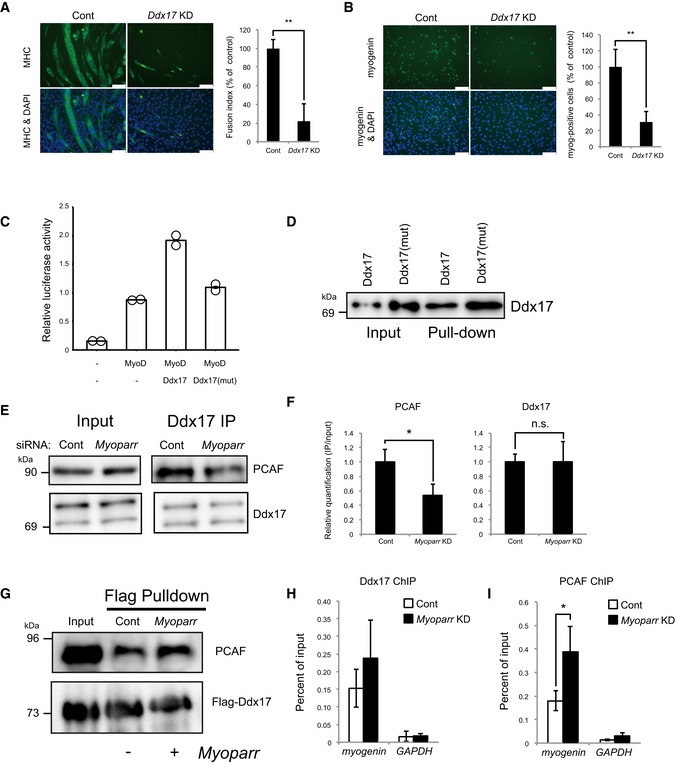
Simultaneous depletion of Ddx17 and highly related Ddx5 inhibited C2C12 differentiation and the activation of myogenic genes including myogenin 22. We found that depletion of Ddx17 alone was sufficient to inhibit myogenic differentiation as shown by decreased MHC expression (Fig 5A and Appendix Fig S4A). Additionally, the expression of myogenin and Myoparr was significantly decreased in Ddx17‐depleted cells (Fig 5B and Appendix Fig S4B and C). On the contrary, Ddx17 expression was increased by a small amount by either Myoparr or myogenin KD (Appendix Fig S4D). We showed that exogenous overexpression of Ddx17 with MyoD increased the activity of the −1650‐Luc in C2C12 cells (Fig 5C). This synergistic activation was not observed in a Ddx17 mutant (K142R), which retains the Myoparr‐binding activity but lacks the RNA helicase activity 26 (Fig 5D), suggesting that the helicase activity of Ddx17 could be indispensable for the activation of myogenin expression.
Figure 5. Myoparr promotes the protein–protein interaction between Ddx17 and PCAF .
-
ASignificantly decreased MHC expression in Ddx17‐depleted C2C12 cells is shown by immunocytochemistry. Nuclei were counterstained with DAPI. Scale bar, 100 μm. Fusion index is shown as percent of the control. n = 3, mean ± SD. **P < 0.01 (unpaired two‐tailed Student's t‐test).
-
BImmunocytochemistry for myogenin in Ddx17‐depleted C2C12 cells. Scale bar, 100 μm. Myogenin‐positive cells are shown as percent of the control. n = 4, mean ± SD. **P < 0.01 (unpaired two‐tailed Student's t‐test).
-
CRelative luciferase activities of the ‐1650‐Luc by the combination of MyoD and Ddx17 or Ddx17 mutant (K142R). Bars indicate the average of two independent experiments, and open circles represent the values of each experiment.
-
DDdx17 or Ddx17 mutant (K142R) was pulled down by full‐length Myoparr and then detected by Western blot.
-
EReduced interaction between endogenous Ddx17 and PCAF in Myoparr‐depleted C2C12 cells. After Myoparr KD, the cell lysates were subjected to immunoprecipitation (IP) with a Ddx17‐specific antibody 36 h after differentiation induction (right panel). Each lysate was loaded as an input (left panel).
-
FRelative quantification of (E) is shown as IP/input ratio. n = 3, mean ± SD. *P < 0.05. n.s., not significant (unpaired two‐tailed Student's t‐test).
-
GIncreased interaction between Ddx17 and PCAF by Myoparr. PCAF protein was pulled down by 3xFlag‐Ddx17 in the presence or absence of Myoparr using a Flag antibody and then detected by Western blot.
-
H, IChIP‐qPCR detection of Ddx17 (H) and PCAF (I) occupancies at the myogenin locus in Myoparr‐depleted differentiating C2C12 cells. The data were normalized to input values. n = 3, mean ± SD. *P < 0.05 (unpaired two‐tailed Student's t‐test).
Ddx17 interacts with transcriptional regulators in C2C12 cells 22. To reveal the mechanism by which Myoparr regulates the transcriptional activity of Ddx17 during myogenesis, we examined the effect of Myoparr depletion on these interactions by coimmunoprecipitation assays. Among these interactions, Myoparr depletion significantly decreased the interaction between Ddx17 and histone acetyltransferase PCAF in differentiating C2C12 cells (Fig 5E and F), indicating that Myoparr was required for the protein–protein interaction between Ddx17 and PCAF. Moreover, in vitro pull‐down assay using 3xFlag‐Ddx17 showed that the protein–protein interaction between Ddx17 and PCAF was augmented in the presence of Myoparr (Fig 5G). Although Ddx17 and PCAF directly bound to myogenin promoter, Myoparr was dispensable for these bindings (Fig 5H and I). Thus, these results suggested that Myoparr activates myogenin expression by promoting formation of the Ddx17‐PCAF complex on the myogenin locus in differentiating myoblasts.
Myoparr and Ddx17 are required for myoblast cell cycle withdrawal in a myogenin‐independent manner
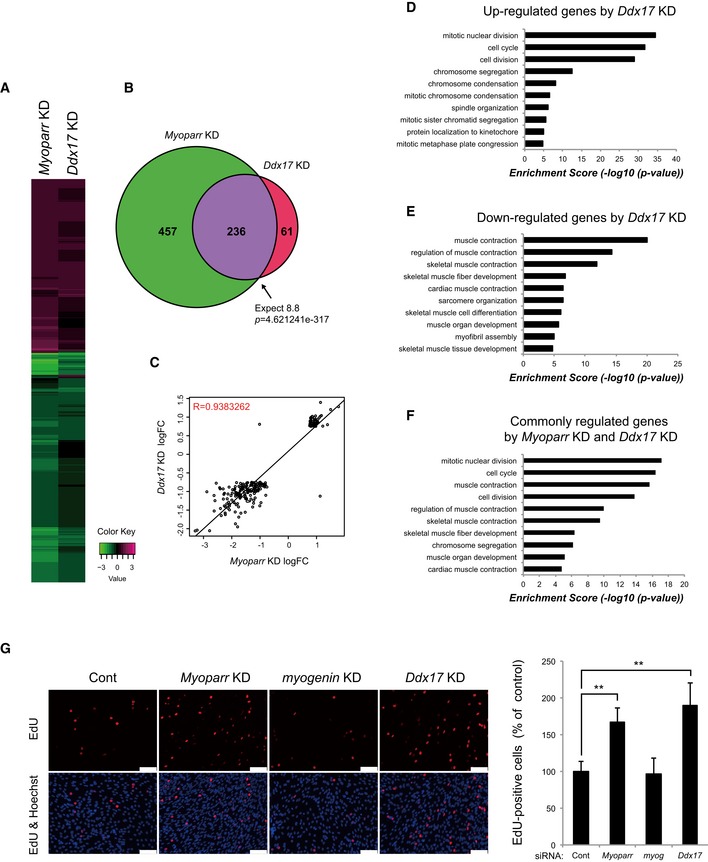
To determine whether Ddx17 mediates the function of Myoparr in the cell cycle and cell division pathway, we compared the genes regulated by Ddx17 KD and Myoparr KD by RNA‐seq. Depletion of Ddx17 increased expression of 93 genes and decreased expression of 204 genes in a statistically significant manner (Table EV1). Eighty percent of genes altered by Ddx17 KD overlapped with genes regulated by Myoparr KD, and the intersection of these genes was 26.9‐fold greater than that expected by chance (P = 4.621241 × 10−317; Fig 6A and B, and Table EV1), with a high correlation coefficient (R = 0.94; Fig 6C). Intriguingly, although genes down‐regulated by Ddx17 KD were enriched in muscle contraction and muscle development categories in GO terms, genes whose expression was up‐regulated by Ddx17 KD were preferentially classified as cell cycle and cell division categories, consistent with Myoparr KD (Figs 3K and 6D and E, Table EV1). Consequently, genes commonly regulated by both Myoparr KD and Ddx17 KD (236 genes) were also enriched in the same categories (Fig 6F and Table EV1), suggesting that Myoparr and Ddx17 control the cell cycle withdrawal of proliferating myoblasts. Indeed, we observed a significant increase in 5‐ethynyl‐2′‐deoxyuridine (EdU) incorporation in Myoparr‐ and Ddx17‐depleted cells but not in myogenin‐depleted cells (Fig 6G). These results indicated that Myoparr and Ddx17 regulate myoblast cell cycle withdrawal in a myogenin‐independent manner.
Figure 6. Myoparr and Ddx17 regulate myoblast cell cycle withdrawal in a myogenin‐independent manner.
-
AHeatmap displaying expression changes of 754 genes significantly altered either in Myoparr‐ or Ddx17‐depleted cells (log 2 ratio scale).
-
BThe intersection of genes regulated by Myoparr KD and Ddx17 KD shows a significant (Fisher's exact test) overlap 26.9 times as large as that expected by chance alone.
-
CGenes significantly differentially expressed in both Myoparr‐ and Ddx17‐depleted cells show correlated expression (R = 0.94, log 2 ratio scale).
-
D–FEnrichment analysis of GO categories in genes up‐regulated by Ddx17 KD (D), down‐regulated by Ddx17 KD (E), and commonly regulated by both Myoparr KD and Ddx17 KD (F).
-
GMyoparr and Ddx17 are required for C2C12 cell cycle withdrawal. C2C12 cells transfected with each siRNA were cultured in growth medium for 24 h. After differentiation induction, cells were maintained in differentiation medium for 40 h and then treated with EdU for 6 h. EdU‐positive cells are shown as percent of the control. Nuclei were counterstained with Hoechst 33342. n = 3, mean ± SD. **P < 0.01 (unpaired two‐tailed Student's t‐test). Scale bar, 100 μm.
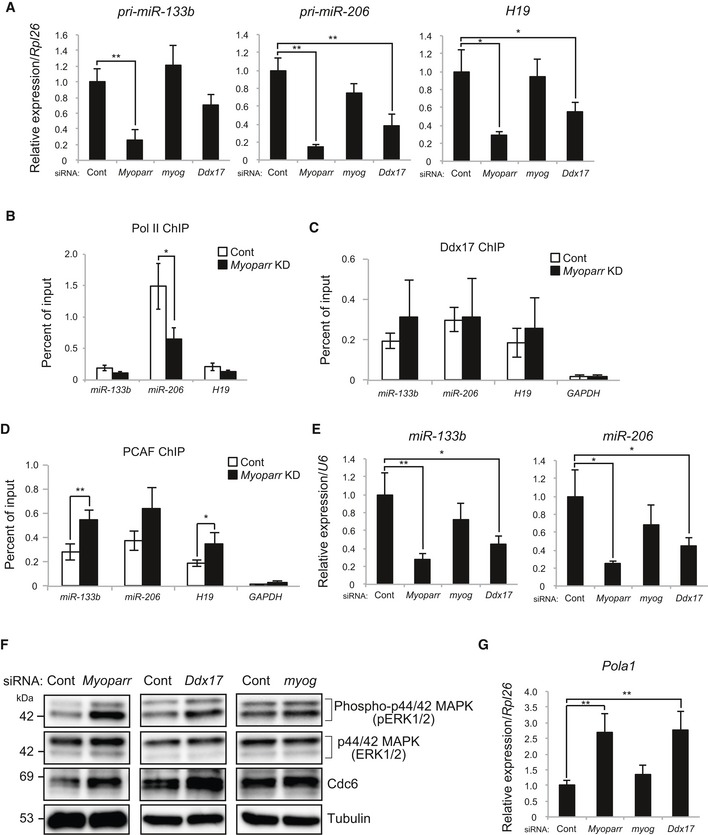
To examine the mechanism by which Myoparr and Ddx17 regulate myoblast cell cycle withdrawal, we assessed the expression changes of genes categorized in GO terms: mitotic nuclear division, cell cycle, and cell division. Expression of Rb1, a negative regulator of cell cycle‐promoting genes, was significantly decreased either by Myoparr, Ddx17, or myogenin depletion (Appendix Fig S5A). Nevertheless, the expression of many other cell cycle‐promoting genes was maintained at a high level in Myoparr‐ and Ddx17‐depleted cells but not in myogenin‐depleted cells (Table EV1). Accordingly, we hypothesized that Myoparr KD or Ddx17 KD might inhibit cell cycle withdrawal in an Rb1‐independent manner. To test this hypothesis, we further analyzed the RNA‐seq data and found that expression of the miR‐133b primary transcript (pri‐miR‐133b) and H19 was largely decreased either by Myoparr or Ddx17 depletion but not by myogenin depletion (Fig 7A and Table EV1). In addition, the expression of pri‐miR‐206, located in the same cluster as pri‐miR‐133b, was specifically decreased by Myoparr or Ddx17 KD (Fig 7A). To determine whether Myoparr regulates the expression of these miRNAs at the transcriptional level, we assessed the Pol II occupancy at these promoters by ChIP assays in Myoparr‐depleted cells. As a result, Myoparr was required for the high level of Pol II occupancy at these promoters in differentiating C2C12 cells (Fig 7B). Regarding Ddx17 and PCAF, direct binding of Ddx17 and PCAF to these promoters was observed by ChIP assays, with the GAPDH locus as a negative control (Fig 7C and D). Intriguingly, Myoparr was dispensable for the binding of Ddx17 to these loci, and Myoparr KD increased PCAF occupancy at these promoters, suggesting that occupancies of both Ddx17 and PCAF are not sufficient for maximum Pol II recruitment to target loci.
Figure 7. Myoparr regulates myoblast cell cycle withdrawal through the activation of miR‐133b, miR‐206, and H19 expression.
-
AqRT–PCR for pri‐miR‐133b, pri‐miR‐206, and H19 expression in differentiating C2C12 cells transfected with indicated siRNAs. n = 3, mean ± SD. *P < 0.05. **P < 0.01.
-
BChIP‐qPCR detection of Pol II occupancy at the indicated promoters in Myoparr‐depleted C2C12 cells. The data were normalized to input values. n = 3, mean ± SD. *P < 0.05. Myoparr KD decreased Pol II occupancy at the miR‐133b promoter with a marginal trend toward significance (P = 0.052).
-
C, DChIP‐qPCR detection of Ddx17 (C) and PCAF (D) occupancies at the indicated promoters in Myoparr‐depleted C2C12 cells. n = 3, mean ± SD. *P < 0.05. **P < 0.01.
-
EqRT–PCR showing decreased expression of miR‐133b and miR‐206 in both Myoparr‐ and Ddx17‐depleted C2C12 cells. n = 3, mean ± SD. *P < 0.05. **P < 0.01.
-
FWestern blots showing increased ERK1/2 activity (pERK1/2) and Cdc6 expression in differentiating C2C12 cells 48 h after Myoparr and Ddx17 KD. Tubulin expression served as an internal control.
-
GIncreased Pola1 expression detected by qRT–PCR. n = 3, mean ± SD. **P < 0.01.
During C2C12 myogenesis, miR‐133b down‐regulates the phosphorylation of ERK1/2 to inhibit myoblast proliferation 27. Inhibition of DNA synthesis through the down‐regulation of DNA pol α (Pola1) at the mRNA level by miR‐206 facilitates myoblast cell cycle withdrawal 28. H19 inhibits the expression of cell cycle‐related genes by targeting Cdc6, a member of the DNA replication initiation complex 29. We observed significant decreases in the mature miR‐133b and miR‐206 products in both Myoparr‐ and Ddx17‐depleted cells (Fig 7E). Levels of mature H19‐derived miRNAs, miR‐675‐5p and miR‐675‐3p, also tended to decrease (Appendix Fig S5B and C). On the other hand, miR‐1, one of the myogenic miRNAs, tended to decrease in all three KD samples (Appendix Fig S5D and E). We specifically observed increased ERK1/2 phosphorylation (pERK1/2) and Cdc6 expression in both Myoparr‐ and Ddx17‐depleted cells (Fig 7F). The expression level of Pola1 was also increased either by Myoparr or Ddx17 depletion but not by myogenin depletion (Fig 7G). These results indicated that Myoparr and Ddx17 are required for myoblast cell cycle withdrawal through the activation of myogenic miRNA expression.
Myoparr is required for myogenin expression during denervation‐induced skeletal muscle atrophy in vivo
Endogenous myogenin expression is repressed during skeletal muscle maturation by innervation 30; however, myogenin expression is reactivated by denervation, leading to skeletal muscle atrophy 31. To test the possibility that Myoparr is required for myogenin expression in vivo, we examined the role of Myoparr during denervation‐induced muscle atrophy in adult mouse. Sciatic nerve transection significantly reduced tibialis anterior (TA) muscle mass (Figs 8A and EV4A), with increased Myoparr as well as myogenin expression (Figs 8B and C, and EV4B and C). For in vivo KD, Myoparr‐specific shRNA sequences were examined in NIH3T3 cells (Fig EV4D). Electroporation‐mediated transfer of Myoparr shRNA3 into the innervated TA muscles effectively knocked down endogenous Myoparr expression and significantly decreased myogenin expression (Fig EV4E). Remarkably, Myoparr KD substantially repressed the myogenin expression induced by denervation in TA muscles (Fig 8D), indicating that Myoparr is required for the activation of myogenin expression in vivo.
Figure 8. Knockdown of Myoparr blocks skeletal muscle atrophy caused by denervation in mice.
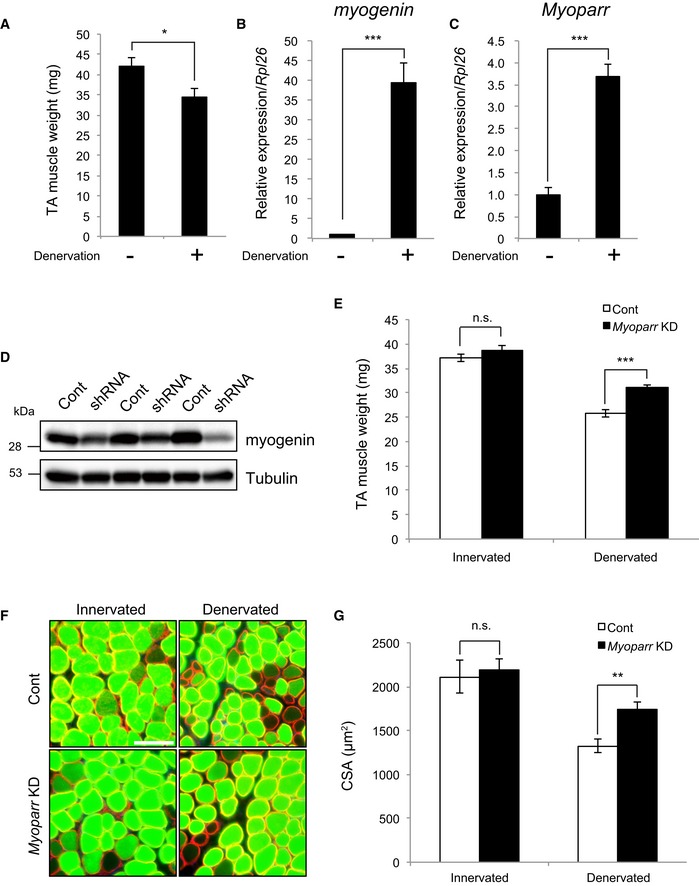
- Seven days after denervation, weights of innervated (−) and denervated (+) tibialis anterior (TA) muscles were measured. n = 4, mean ± SEM. *P < 0.05 (unpaired two‐tailed Student's t‐test).
- Expression of myogenin in innervated and denervated TA muscles detected by qRT–PCR 7 days after denervation. n = 4, mean ± SD. ***P < 0.001 (unpaired two‐tailed Welch's t‐test).
- qRT–PCR showing increased Myoparr expression in denervated TA muscles 7 days after denervation. n = 3, mean ± SD. ***P < 0.001 (unpaired two‐tailed Student's t‐test).
- Immunoblot showing decreased expression of myogenin by Myoparr depletion in denervated TA muscles 7 days after denervation. Expression of tubulin served as an internal control.
- Weights of innervated and denervated TA muscles electroporated either with control or Myoparr shRNA. Muscle weights were measured 7 days after denervation. n = 5 for each group, mean ± SEM. ***P < 0.001. n.s., not significant (unpaired two‐tailed Student's t‐test).
- Representative immunostaining images for laminin (red) and EmGFP (green) of innervated or denervated TA muscles electroporated with control or Myoparr shRNA, both containing EmGFP. Scale bar, 100 μm.
- Cross‐sectional area (CSA) of electroporated EmGFP‐positive myofibers (250 fibers per sample) was analyzed 7 days after denervation. n = 5 for each group, mean ± SEM. **P < 0.01. n.s., not significant (unpaired two‐tailed Student's t‐test).
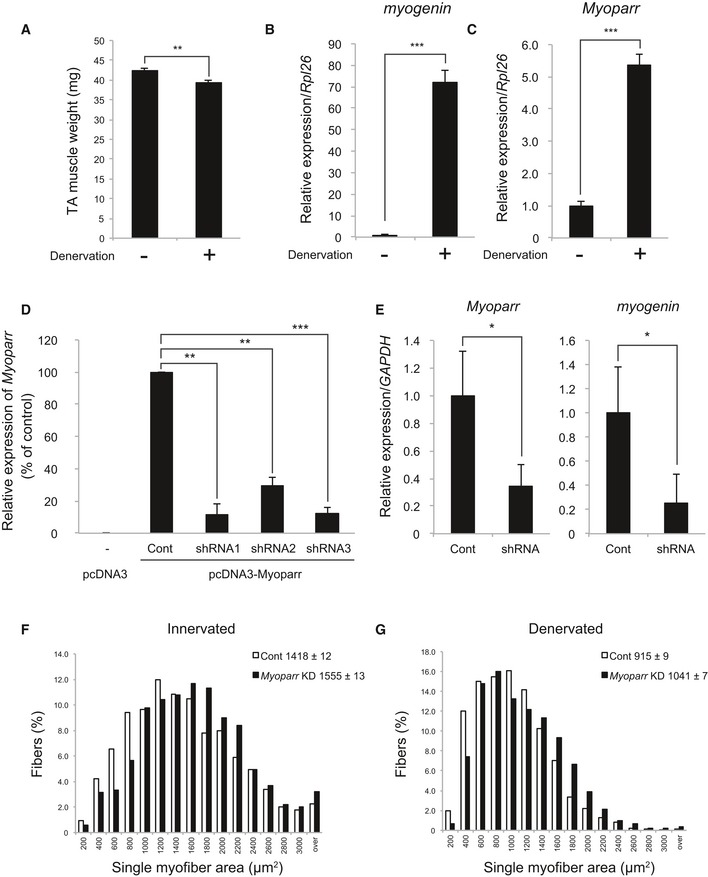
Figure EV4. Myoparr depletion prevents skeletal muscle atrophy.
-
AThree days after denervation, weights of innervated (−) and denervated (+) tibialis anterior (TA) muscles were measured. n = 4, mean ± SEM. **P < 0.01 (unpaired two‐tailed Student's t‐test).
-
BExpression of myogenin in innervated and denervated TA muscles detected by qRT–PCR 3 days after denervation. n = 4, mean ± SD. ***P < 0.001 (unpaired two‐tailed Welch's t‐test).
-
CQuantitative RT–PCR showing increased Myoparr expression in denervated TA muscles 3 days after denervation. n = 4, mean ± SD. ***P < 0.001 (unpaired two‐tailed Student's t‐test).
-
DEvaluation of the inhibitory effect of Myoparr expression by Myoparr shRNAs in NIH3T3 cells. n = 3, mean ± SD. **P < 0.01. ***P < 0.001 (unpaired two‐tailed Welch's t‐test). The results were normalized to Rpl26 expression. Data are shown as percent of the control.
-
EIn vivo inhibitory effect of Myoparr shRNA against the expression of Myoparr and myogenin in innervated TA muscles. n = 4, mean ± SD. *P < 0.05 (unpaired two‐tailed Student's t‐test).
-
F, GDistributions of single myofiber areas in innervated (F) and denervated (G) TA muscles in the presence of control or Myoparr shRNA. All EmGFP‐positive myofibers (innervated control shRNA; n = 3,326, innervated Myoparr shRNA; n = 3,035, denervated control shRNA; n = 3,141, denervated Myoparr shRNA; n = 5,417) were counted. The percentage of myofibers with indicated areas per total fibers were plotted. A Mann–Whitney nonparametric test was used for comparisons between each group (innervated control shRNA vs. innervated Myoparr shRNA, P < 0.001; denervated control shRNA vs. denervated Myoparr shRNA, P < 0.001). Data are shown as mean ± SEM.
We finally examined whether Myoparr depletion prevents neurogenic atrophy in mice. Analyses of the innervated and denervated TA muscles transfected with Myoparr shRNA3 showed that Myoparr KD increased the denervated TA muscle weight by 20% compared with that of muscles transfected with control vector (25.8 ± 0.82 mg vs. 31.0 ± 0.71 mg, P < 0.001; Fig 8E) but not innervated TA muscle weight (37.2 ± 0.82 mg vs. 38.8 ± 0.96 mg, P = 0.195). Cross‐sectional area (CSA) analysis of emerald green fluorescent protein (EmGFP)‐positive Myoparr shRNA3‐transfected myofibers demonstrated that Myoparr KD significantly increased the myofiber size of denervated TA muscles compared with that of muscles transfected with control vector (1,324.3 ± 81.4 μm2 vs. 1,743.5 ± 85.4 μm2, P < 0.01) (Fig 8F and G), whereas no significant difference was observed in the myofiber size of innervated TA muscles (2,112.9 ± 184.7 μm2 vs. 2,188.2 ± 122.1 μm2, P = 0.714), indicating that Myoparr‐depleted myofibers showed resistance to denervation‐induced muscle atrophy. Quantification of the fiber areas of individual transfected myofibers is shown in Fig EV4F and G. Thus, Myoparr may be a promising therapeutic target for skeletal muscle atrophy caused by denervation.
Discussion
Spatiotemporal expression of myogenin is controlled by multiple regulatory factors via the evolutionally conserved proximal promoter region 13. In this study, we provide new insight into the regulatory mechanism underlying myogenin expression by identification and characterization of a novel promoter‐associated lncRNA, Myoparr. During skeletal muscle differentiation, Myoparr is expressed from the upstream region of myogenin, corresponding to the sequences required for high‐level myogenin expression in mice 14. Our findings demonstrated that Myoparr is essential for the activation of myogenin expression by regulating the Pol II occupancy and histone modifications at the myogenin locus through binding to chromatin. Myogenin promotes the entry of myoblasts into the myogenic differentiation lineage 11. Thus, Myoparr is required for the specification of myoblast lineage into myogenic differentiation through the Myoparr (upstream) and myogenin (downstream) pathway. In addition, we detected decreased expression of miR‐133b, miR‐206, and H19, regulators of myoblast proliferation 27, 28, 29, in Myoparr‐depleted cells but not in myogenin‐depleted cells. Myoparr was required for Pol II recruitment to these promoters. Consequently, Myoparr depletion prevented myoblast cell cycle arrest by increasing ERK1/2 activity and Cdc6 and Pola1 expression. Taken together, our study revealed the roles of promoter‐associated lncRNA Myoparr; one role is specification of myoblasts to differentiation lineage by activating neighboring myogenin expression, and the other role is myoblast cell cycle withdrawal by activating the expression of myogenic regulatory miRNAs in a myogenin‐independent manner.
The DEAD box protein Ddx17 plays key roles in transcription, miRNA processing, alternative splicing, and myogenic differentiation 22, 23, 32. In the present study, we discovered a new feature of Ddx17 as a Myoparr‐interacting protein. Both Ddx17 and Myoparr were essential for myogenin expression. Deletion of the 341‐nt DNA sequence, which corresponds to the Ddx17‐binding region of Myoparr, from the myogenin upstream region largely reduced the promoter activity of myogenin. In differentiating myoblasts, Ddx17 functions as a transcriptional coactivator of MyoD through association with histone acetyltransferases CBP, p300, and PCAF 22. PCAF also promotes transcriptional activities of Ddx17 and MyoD 33, 34, 35. Although Myoparr was dispensable for the binding of Ddx17 and PCAF to the myogenin locus in our ChIP experiments, we showed that Myoparr is required to augment the interaction between Ddx17 and PCAF proteins. In addition, Myoparr was required for maximum Pol II recruitment to the myogenin promoter. Taken together, we proposed a model of Myoparr function during myogenesis (Fig 9).
Figure 9. Proposed model of Myoparr function during myogenesis.
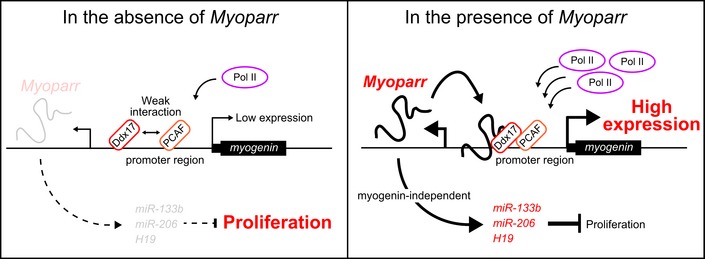
Although Ddx17 and PCAF bind to the myogenin promoter, the interaction between Ddx17 and PCAF is weak in the absence of Myoparr. Thus, occupancies of both Ddx17 and PCAF on the myogenin promoter are not sufficient for maximum Pol II recruitment to the myogenin promoter. After binding to the myogenin promoter, Myoparr interacts with Ddx17 to promote the Ddx17‐PCAF interaction. Enhanced Ddx17‐PCAF interaction by Myoparr may be sufficient for maximum Pol II recruitment to the myogenin promoter. Thus, Myoparr is required for specification of myoblast lineage into myogenic differentiation through the Myoparr (upstream) and myogenin (downstream) pathway. In addition, Myoparr is involved in the regulation of myoblast cell cycle withdrawal by activating the expression of myogenic regulatory miRNAs in a myogenin‐independent manner.
Besides myogenin expression, our comprehensive RNA‐seq analyses revealed that Myoparr regulates the expression of myogenic miRNAs in a myogenin‐independent manner during C2C12 differentiation. Although not all the genes regulated by Myoparr KD completely overlapped with the genes regulated by Ddx17 KD, our findings suggested that the myogenin‐independent role of Myoparr in myoblast cell cycle withdrawal is largely mediated by Ddx17. PCAF is also essential for myoblast cell cycle arrest 36. It is of note that Myoparr was indispensable for maximum Pol II recruitment to myogenic miRNA promoters but was dispensable for Ddx17 and PCAF recruitment, suggesting that Myoparr‐mediated Ddx17‐PCAF interaction is necessary for the expression of myogenic miRNAs. However, the mechanism by which low‐copy‐number Myoparr regulates the expression of downstream genes at distal loci remains to be determined. Considering that RNAs can exert a chaperone‐like effect on their binding proteins 37, 38, it is possible that Myoparr, by acting as a molecular chaperone, is required for the spatiotemporal timing of Ddx17 interaction with PCAF at the myogenin locus but not required for the maintenance of the complex thereof. In fact, our immunoprecipitation experiments showed that Myoparr KD resulted in decreased amounts of Ddx17‐PCAF complex, suggesting that Myoparr KD affected the amount of Ddx17‐PCAF complex at the whole‐cell level. Thus, Myoparr may regulate the expression of downstream genes by controlling the amount of Ddx17‐PCAF complex at distal loci.
Two E‐box elements in the myogenin promoter are important for the responsiveness of MyoD and TGF‐β 20. In this study, we found that Myoparr shares its promoter region with myogenin and that the introduction of mutations into the E‐box elements in this region abolished activation of both promoters, possibly induced by endogenous MyoD. In addition, TGF‐β‐dependent repression of both promoter activities was attenuated by E‐box mutations. Therefore, because multiple factors can be involved in myogenin regulation 13, common and intrinsic regulatory mechanisms may play a role in the expression of Myoparr and myogenin. Interestingly, myogenin KD increased Myoparr expression along with that of Myf5 and MRF4, coding MyoD family MRFs. Up‐regulated Myf5 and MRF4 expression was also reported in differentiating myoblasts derived from myogenin conditional knockout mice 39, suggesting that compensatory mechanisms induced by myogenin KD, i.e., increased expression of MyoD family MRFs, may increase Myoparr expression through the myogenin/Myoparr promoter.
After birth, innervation by motor neurons maintains the repressed status of myogenin expression in skeletal muscle 40. When nerve supply to muscle is lost, myogenin expression is re‐induced to promote proteolysis and atrophy in skeletal muscle 31. In this study, we showed that Myoparr depletion led to down‐regulation of myogenin expression re‐induced by denervation and attenuated denervation‐dependent reduction in skeletal muscle mass. Furthermore, we identified the human Myoparr counterpart and showed highly correlated expression of myogenin and Myoparr during human skeletal muscle differentiation. Besides denervation, re‐induced myogenin expression has been reported in neurogenic atrophy, amyotrophic lateral sclerosis (ALS), Huntington's disease, and spinal muscular atrophy (SMA) 41, 42, 43. Thus, our findings suggested that Myoparr inhibition may be a useful therapeutic strategy for neurogenic atrophy in humans.
In conclusion, we identified a novel promoter‐associated lncRNA, Myoparr, and revealed its roles during myogenesis through the regulation of neighboring myogenin expression by promoting the protein–protein interaction between transcriptional activators. In addition, Myoparr was required for the expression of myogenic regulatory miRNAs in a myogenin‐independent manner. Thus, our findings indicated that the promoter‐associated lncRNA does not merely regulate neighboring gene expression but may also affect gene expression at distal loci in a neighboring gene‐independent manner. However, we did not exclude the possibility that Myoparr may function independently through interaction of myogenin and Ddx17/PCAF proteins in myogenesis, because the genes affected by Myoparr KD did not completely overlap with those affected by myogenin or Ddx17 KD. Besides Ddx17, we identified hnRNPK and Tial1, key interactors of lncRNA regulating the p53 pathway 44, 45, as Myoparr‐interacting proteins. Collectively, future studies using comprehensive analysis of Myoparr‐interacting proteins will further define the roles of Myoparr in skeletal muscle formation and disorders affecting muscles.
Materials and Methods
Mouse model
The C57BL/6J mice used in this study were purchased from the Japan SLC and housed in cages with a constant temperature (24°C) and a 12:12‐h light–dark cycle. All animal experiments were conducted under protocols approved by the Institutional Animal Care and Use Committee of Fujita Health University.
Cell lines and primary cultures
Mouse myoblast cell line, C2C12, was purchased from Marinpharm. NIH3T3 and C3H10T1/2 cells were purchased from the American Type Culture Collection (ATCC). C2C12 and NIH3T3 cells were maintained in Dulbecco's modified Eagle's medium (DMEM) supplemented with 10% fetal bovine serum at 37°C and 5% CO2. Mouse embryonic fibroblast C3H10T1/2 cells were maintained in Eagle's minimum essential medium, alpha modification (α‐MEM) supplemented with 10% fetal bovine serum and 2 mM l‐glutamine at 37°C and 5% CO2. Myogenic differentiation was induced by replacing the medium with DMEM supplemented with 2% horse serum. For TGF‐β treatment, C2C12 cells were cultured with 5 ng/ml recombinant TGF‐β1 (R&D Systems) in DMEM supplemented with 2% horse serum for 24 h.
Mouse primary myoblasts were freshly prepared by FACS and cultured as previously described 46. Myogenic differentiation of primary myoblasts was induced by replacing the medium with DMEM supplemented with 5% horse serum.
Experiments using human samples were approved by the Ethical Review Board for Clinical Studies at Fujita Health University. Gluteus medius muscles of patients undergoing total hip arthroplasty were used for cell preparation. Cells were sorted by FACS and cultured as previously described 47. Human skeletal muscle myoblasts (HSMM) used for RACE analyses were purchased from Lonza and similarly isolated using FACS.
Plasmid DNA construction
The intergenic region between Myoparr and myogenin (−242/+51), including the minimal myogenin promoter region 14, was PCR‐amplified and cloned into the pGL4.20 vector (Promega) in the positive or opposite direction to generate the pGL4‐Myog‐Luc (myogenin promoter) and pGL4‐Myoparr‐Luc (Myoparr promoter) constructs, respectively. Identified E‐box elements in the intergenic region between Myoparr and myogenin 14 were mutated (CACATG to tgCAca and CAGTTG to tgGTca). The promoter region of mouse GAPDH (−560/+28) was PCR‐amplified and cloned into the pGL4.20 vector in the positive or opposite direction to generate the GAPDH promoter constructs.
The upstream regions of the myogenin gene, −242/+51 and −1650/+51, were amplified by PCR and subcloned into the episomal luciferase vector, pREP4‐luc, to generate the −242‐Luc and −1650‐Luc constructs, respectively. The coding region of EGFP was PCR‐amplified and cloned into −242‐Luc to generate the −242+EGFP‐Luc construct. To create the −1650∆341‐Luc construct, the upstream region (−1194/−854) of the myogenin gene was removed from the −1650‐Luc construct. The upstream region (−1224/−823) of the myogenin gene was PCR‐amplified and inserted downstream of the poly(A) site in the −242‐Luc construct to generate the −242+∆341‐Luc construct. To create the pNL1.1‐3xpA construct, the PGK promoter was removed from the pNL1.1.PGK vector (Promega) and the 3×poly(A) site amplified from the pRosa26‐DEST vector was inserted upstream of Nluc.
The coding region of mouse Ddx17 was PCR‐amplified and subcloned into the pCS2+ and pCS2‐3xFlag vectors. Mutant Ddx17 (K142R) was generated by PCR. The coding regions of myogenin, PCAF, and EGFP were PCR‐amplified and subcloned into the pCS2+ vector. Full‐length Myoparr and myogenin‐associated sense long non‐coding RNAs (short and long forms) were subcloned into the pCS2+ vector. Full‐length and several indicated regions of Myoparr were PCR‐amplified and cloned into the pGEM‐T easy vector (Promega). The shRNA sequences against Myoparr, listed in Appendix Table S2, were subcloned into the pcDNA6.2‐GW/EmGFP‐miR vector (Thermo Fisher Scientific) according to the manufacturer's protocol. The pcDNA6.2‐GW/EmGFP‐miR containing the shRNA against LacZ (Thermo Fisher Scientific) was used as a negative control. The pcDNA3‐MyoD construct has been previously described 48. The pREP4‐luc and pREP7‐Rluc vectors were gifts from Dr. K. Zhao 25. The pRosa26‐DEST vector was a gift from Drs. N. Hastie and P. Hohenstein (Addgene plasmid # 21189) 49.
RNA and genomic DNA isolation, reverse transcription reaction, and PCR
Total RNA was prepared as previously described 48. In brief, total RNA from tissues and cells was extracted and purified using the miRNeasy Mini Kit (QIAGEN) and ISOGEN II reagent (Nippon Gene, Japan) according to the manufacturer's protocol. To prepare total RNA from embryonic skeletal muscle, the trunk region of mouse embryos was surgically isolated at E10.5, E12.5, and E14.5. Embryonic organs were isolated at E14.5. Poly(A)+ RNAs were isolated from total RNA using the Poly(A)+ Isolation Kit (Nippon Gene) following the manufacturer's protocol. Nuclear and cytoplasmic RNA fractions were purified from C2C12 cells using the PARIS Kit (Thermo Fisher Scientific) according to the manufacturer's protocol. Nuclear fractionation (SNE and CPE) of C2C12 cells was performed as previously described 17. Extraction of genomic DNA from C2C12 cells was performed using the PureLink Genomic DNA Kit (Thermo Fisher Scientific).
After treatment with DNase I (Thermo Fisher Scientific), the reverse transcription reaction was performed using the SuperScript III First‐Strand Synthesis System with random or oligo (dT) primers (Thermo Fisher Scientific). A strand‐specific reverse transcription reaction was performed as previously described 50 using the SuperScript III First‐Strand Synthesis System with the indicated primers. For the analyses of miRNAs, cDNA was synthesized using the miScript Reverse Transcription Kit (QIAGEN). Semi‐quantitative PCR analyses were conducted using Ex Taq (Takara) following the manufacturer's protocol. The quantitative real‐time PCR was conducted using SYBR Premix Ex Taq (Takara) and the miScript SYBR Green PCR Kit (QIAGEN). Data were normalized to Rpl26, GAPDH, or U6 expression as indicated. The primers used are listed in Appendix Table S3.
For semi‐quantitative analyses, reverse transcription was performed on 1,000 ng RNA in a 20 μl reaction, and 1 μl cDNA was used for PCR in a 25 μl reaction volume for oligo (dT) priming as described above. When the reverse transcription was performed with strand‐specific primers, 500 ng RNA was used in a 20 μl reaction, and 2 μl cDNA was used for PCR in a 25 μl reaction volume. PCR amplification was performed in 34 cycles using Ex Taq. We verified the PCR products by sequencing.
RNA‐seq library construction, sequencing, and data analysis
Poly(A)+ RNAs were purified from 1 μg total RNA using the NEBNext Poly(A) mRNA Magnetic Isolation Module (New England Biolabs). RNA‐seq libraries were constructed using the NEBNext Ultra RNA Library Prep Kit for Illumina (New England Biolabs) according to the manufacturer's protocol.
The libraries were sequenced with 100‐bp single‐end reads for each sample and two biological replicates per sample using an Illumina HiSeq 1500 at the Genome and Transcriptome Analysis Center of Fujita Health University. For basecalling, the bcl2fastq 1.8.4 software was used. Quality trimming of row sequence was performed using FastQC ver. 0.11.3 software (https://www.bioinformatics.babraham.ac.uk/projects/fastqc/) following the command “‐Q 33 ‐t 20 ‐l 30”. Trimmed reads were aligned to the mouse reference genome (mm10) using Hisat2 ver. 2.0.5 51 with default parameters. The number of aligned reads was approximately 95% of the original reads. Aligned reads were converted and sorted to Bam files using SAMtools ver. 1.3.1 software 52 and counted with HTSeq ver. 0.6.0 software 53 using the Mus_musculus_UCSC_mm10.gtf file following the optional command “–stranded = no –format = bam”. Statistical analysis of differentially expressed genes was performed using DESeq2 ver. 1.12.4 software 54 with a Wald test (cut‐offs: false discovery rate (adjusted P‐value, padj) < 0.05 and log 2 fold change > 0.75 or < −0.75). GO analysis was performed with DAVID ver. 6.8 (https://david.ncifcrf.gov/), and P < 0.005 was considered statistically significant.
Absolute quantification of the copy numbers of Myoparr and myogenin RNA
The RNA copy numbers were quantified as previously described 55. In brief, Myoparr and myogenin RNA (109 copies) was transcribed in vitro using the RiboMAX Large Scale RNA Production System (Promega) and was treated with DNase I then subjected to reverse transcription using the SuperScript III First‐Strand Synthesis System with random primers. Synthesized cDNAs from Myoparr and myogenin RNA were serially diluted to be used as standards. Thirty‐six hours after differentiation induction, total RNA was isolated from 5.45 × 10⁵ C2C12 cells using the ISOGEN II reagent. One microgram of total RNA was treated with DNase I and subjected to reverse transcription. The copy numbers of endogenous Myoparr and myogenin RNA were quantified by qPCR, considering both the recovery rate of RNA and the ratio of myogenin‐positive cells. The recovery rate of RNA during the RNA purification step was determined using in vitro‐transcribed EGFP RNA (1012 copies) as a spike‐in control. The ratio of myogenin‐positive cells was determined by immunofluorescence analyses.
In vivo electroporation
For electroporation, the TA muscles of 8‐week‐old mice were injected with 30 μg endotoxin‐free plasmid DNA in a saline solution using a 34‐gauge needle under anesthesia. Electric pulses were applied with a tweezer‐type electrode (150 V/cm, 6 pulses, 50 ms pulses of 1‐Hz frequency) using a CUY21EDIT (Bex Co. LTD., Japan). Following electroporation, a 3‐mm segment of the sciatic nerve was excised for denervation. Seven days after electroporation, mice were sacrificed and the TA muscles were fixed and immunostained as previously described 48. Measurements of the CSA of the electroporated myofibers (EmGFP positive) were conducted with ImageJ software ver. 1.49.
siRNA treatment and immunofluorescence assay
C2C12 cells were transfected with 50 nM of Stealth RNAi (Thermo Fisher Scientific) or ASO (Takara) using Lipofectamine 3000 (Thermo Fisher Scientific) according to the manufacturer's protocol. The siRNAs used were as follows: Stealth RNAi siRNA negative controls (Med GC and Med GC Duplex #3) and siRNAs specific for myogenin (MSS275910 and MSS275912). The target sequences of the Stealth RNAi for Myoparr are as follows: 5′‐GATGGACCCTGTCTGATGCTCTTAA‐3′ and 5′‐CCCTAAAGACCTACCACTACCACAT‐3′. The Stealth RNAi for Ddx17 was reported previously 22. The target sequences of the ASO for Myoparr are as follows: 5′‐CCATACTATGTCAGTC‐3′ and 5′‐TCTCTTCTGTGCTTTC‐3′. The target sequences for the siRNA and shRNA used are listed in Appendix Table S2. Twenty‐four hours after transfection, cells were induced for myogenic differentiation. Twenty‐four hours or 72 h after differentiation induction, cells were collected for the analyses of RNAs and proteins.
Immunofluorescence analyses of C2C12 cells were performed as previously described 48. Cells were fixed and stained with an anti‐myogenin antibody (F5D, Developmental Studies Hybridoma Bank) on day 1, or with an anti‐myosin heavy‐chain antibody (MF20, Developmental Studies Hybridoma Bank) on day 3. EdU incorporation was assayed using the Click‐iT Plus EdU Alexa Fluor 594 Imaging Kit (Thermo Fisher Scientific) according to the manufacturer's protocol. Nuclei were counterstained with DAPI or Hoechst 33342. Cells were visualized using a DMI4000B microscope (Leica) with a DFC350FX CCD camera (Leica) and then analyzed by ImageJ software ver. 1.49. The definition of the fusion index is the average number of nuclei in MHC‐positive cells (at least three nuclei) per total nuclei number.
5′ and 3′ rapid amplification of cDNA ends (RACE)
RACE was performed using the GeneRacer Kit with the SuperScript III RT and TOPO TA Cloning Kit for Sequencing (Thermo Fisher Scientific) according to the instruction of the manufacturer. Poly(A)+ RNAs were used for the RACE reaction. Ex Taq and LA Taq with GC Buffer (Takara) were used for PCR amplification following the manufacturer's protocol. PCR products were gel purified with QIAquick (QIAGEN) and cloned into the pGEM‐T easy vector then sequenced. The coding potential assessment was performed with a coding potential assessment tool (http://lilab.research.bcm.edu/cpat/) 56.
In vitro transcription and translation
In vitro transcription and translation were performed using the TnT SP6 High Yield Wheat Germ Protein Expression System (Promega) or TnT T7 Quick Coupled Transcription/Translation System (Promega) following the manufacturer's protocol. Ddx17 and 3xFlag‐Ddx17 proteins were transcribed and translated using the TnT SP6 High Yield Wheat Germ Protein Expression System and then incubated in the TnT T7 Quick Coupled Transcription/Translation System with 45 mM ethylenediaminetetraacetic acid (EDTA). Proteins labeled with the FluoroTect GreenLys in vitro Translation Labeling System (Promega) were separated by SDS–PAGE and visualized with a Typhoon 9400 scanner (GE Healthcare).
Identification of Myoparr‐binding proteins and the RNA pull‐down assay
Myoparr‐binding proteins were purified with the RiboTrap Kit (Medical & Biological Laboratories (MBL), Japan) according to the manufacturer's protocol. Briefly, 7 × 10⁷ C2C12 cells were harvested 24 h after myogenic induction and lysed in 1,200 μl CE Buffer containing 60 μl Detergent Solution. After centrifugation at 3,000 g for 3 min at 4°C, nuclei were washed three times with 1 ml CE Buffer and collected by centrifugation at 12,000 g for 3 min at 4°C. The nuclei were resuspended in 500 μl NE Buffer with sonication for 10 s. The nuclear lysate was diluted with 700 μl Dilution Buffer and centrifuged at 16,000 g for 10 min at 4°C. The supernatant was used for immunoprecipitation as the nuclear extract. The BrU‐labeled Myoparr and EGFP RNA were prepared by the Riboprobe System (Promega). The BrU‐labeled RNA (50 pmol) was bound to Protein G Plus Agarose (Thermo Fisher Scientific) conjugated to an anti‐BrdU antibody and then mixed with the nuclear extract for 2 h at 4°C. RNA–protein complexes were washed four times with Wash Buffer I and then competitively eluted with 50 μl elution buffer containing free BrdU. Proteins were separated by SDS–PAGE, stained with SYPRO Ruby Protein Gel Stain (Thermo Fisher Scientific), and visualized with a Typhoon 9400 scanner. Representative bands specifically detected on the Myoparr sample were excised and in‐gel digested with trypsin for analysis by mass spectrometry as previously described 57. The peptide sequences obtained from the mass spectrometry analysis were searched against the protein database (Mass Spectrometry Sequence Database) using MASCOT software (Matrix Science).
An RNA pull‐down assay was performed with the RiboTrap Kit and in vitro‐transcribed/in vitro‐translated Ddx17 protein. Various lengths of BrU‐labeled Myoparr (10 pmol each) were bound to Protein G Plus Agarose conjugated to an anti‐BrdU antibody and mixed with Ddx17 protein. After washing the RNA–protein complexes with Wash Buffer I, the Ddx17 protein was eluted and analyzed by Western blot.
RNA immunoprecipitation
Immunoprecipitation of endogenous RNAs was performed using the RIP‐Assay Kit (MBL). In brief, 2 × 10⁷ C2C12 cells were harvested 48 h after myogenic induction and lysed in 500 μl CE Buffer with 25 μl Detergent Solution. After centrifugation at 3,000 g for 3 min at 4°C, nuclei were washed three times with 400 μl CE Buffer and collected by centrifugation at 12,000 g for 3 min at 4°C. The nuclei were dissolved in 200 μl NE Buffer by Dounce homogenization (20 strokes) and then diluted with 300 μl Dilution Buffer. After centrifugation at 16,000 g for 10 min at 4°C, the supernatant was collected and mixed with Protein G Plus Agarose conjugated to the following antibodies: normal rabbit IgG (#2729S, Cell Signaling Technology (CST)) or Ddx17 antibody (N‐13) (sc‐86408, Santa Cruz Biotechnology (SCB)). After incubation with rotation for 3 h at 4°C, the beads were washed four times with Wash Buffer and the RNAs were eluted according to the manufacturer's protocol. Eluted RNAs were treated with DNase I, and the reverse transcription reaction was performed as described above. The precipitation percentage (precipitated RNA vs. input RNA) was calculated by qRT–PCR using the primers listed in Appendix Table S3.
Coimmunoprecipitation assay, protein pull‐down assay, and Western blot analysis
For the coimmunoprecipitation assay, siRNA‐treated C2C12 cells were maintained in DMEM supplemented with 2% horse serum. Cells were harvested 36 h after differentiation induction. Immunoprecipitation was performed by the two‐step lysis method 58 using a Ddx17 antibody (S‐17) (sc‐86409, SCB).
An in vitro pull‐down assay between 3xFlag‐Ddx17 and PCAF protein was performed with the RiboTrap Kit with in vitro‐transcribed/in vitro‐translated proteins. The 3xFlag‐Ddx17 protein was incubated with Myoparr or EGFP RNA (10 pmol each) then mixed with PCAF protein. Protein–RNA complexes were pulled down with an anti‐Flag M2 Affinity Gel (A2220, Sigma‐Aldrich) and analyzed by Western blot.
Western blot analyses were performed as previously described 48 with a minor modification. In brief, the samples were lysed in RIPA buffer (50 mM Tris–HCl (pH 8.0), 150 mM NaCl, 0.1% SDS, 1% Triton X‐100, 0.5% sodium deoxycholate) containing protease inhibitors (1 mM phenylmethylsulfonyl fluoride, 1 μg/ml aprotinin, 4 μg/ml leupeptin) and phosphatase inhibitors (5 mM NaF, 5 mM β‐glycerophosphate, 1 mM Na3VO4). Protein concentration was measured by the Pierce BCA Protein Assay Kit (Thermo Fischer Scientific), and equal amounts of protein were used for the Western blot analyses. The primary antibodies used for the Western blots are as follows: myogenin antibody (F5D) (sc‐12732, SCB), MHC antibody (MF20, Developmental Studies Hybridoma Bank), Ddx17 antibody (N‐13) (sc‐86408, SCB), histone H2B antibody (07‐371, Merck Millipore), p44/42 MAPK (ERK1/2) antibody (#9102, CST), phospho‐p44/42 MAPK (pERK1/2) antibody (#4370, CST), Cdc6 (180.2) antibody (sc‐9964, SCB), PCAF antibody (E‐8) (sc‐13124, SCB), α‐tubulin antibody (#2144, CST), and Flag M2 antibody (F1804, Sigma‐Aldrich). The HRP‐linked secondary antibodies are as follows: anti‐mouse IgG (#7076, CST), anti‐rabbit IgG (#7074, CST), and Protein A‐HRP (101023, Thermo Fisher Scientific). For the detection of PCAF, the PCAF antibody (E‐8) was peroxidase‐labeled by the Ab‐10 Rapid Peroxidase Labeling Kit (Dojindo, Japan). Can Get Signal Immunoreaction Enhancer Solution (Toyobo, Japan) was used when necessary. All experiments were repeated at least twice.
Luciferase reporter assay
Subconfluent C2C12 cells were transfected with the indicated plasmids using Lipofectamine 2000 (Thermo Fisher Scientific). The total amount of DNA was kept constant by the addition of empty vectors when needed. As an internal control, pGL4.74 (Promega), pNL1.1.PGK, pREB7‐Rluc, or pNL1.1‐3xpA was used. Twenty‐four hours later, myogenic induction was conducted as described above. Recombinant TGF‐β1 was added if needed. Twenty‐four hours after myogenic induction, cells were dissolved in Passive Lysis Buffer (Promega) to measure the indicated promoter‐driven luciferase activities using a Lumat LB 9507 luminometer (Berthold Technologies) with the Dual‐Luciferase Reporter Assay System (Promega) or Nano‐Glo Dual‐Luciferase Reporter Assay (Promega) according to the manufacturer's protocol. The promoter activity is presented as firefly to Renilla luciferase ratio or firefly to Nano luciferase ratio. The experiments were performed at least three times in duplicate or triplicate for each assay. Representative data are shown.
DNA methylation analysis
Genomic DNA (200 ng) was bisulfite treated using the Cells‐to‐CpG Bisulfite Conversion Kit (Thermo Fisher Scientific) according to the manufacturer's protocol. The PCR was performed with EpiTaq HS (Takara) under the following conditions: denaturation at 94°C for 60 s and 35 cycles of 94°C for 30 s, 55°C for 30 s, and 72°C for 60 s. A second nested PCR was performed using the following conditions: denaturation at 94°C for 60 s and 25 cycles of 94°C for 30 s, 55°C for 30 s, and 72°C for 60 s. The primers used are listed in Appendix Table S3. The PCR products were subcloned into the pGEM‐T easy vector, and clones derived from each independent subject (n = 3) were sequenced. The methylation status of the region (higher than 97% sequence identity) was determined and analyzed with QUMA (http://quma.cdb.riken.jp/top/quma_main_j.html).
Chromatin immunoprecipitation (ChIP) assay
For the ChIP assay, siRNA‐treated C2C12 cells were maintained in DMEM supplemented with 2% horse serum. Thirty‐six hours after differentiation induction, the cells were crosslinked with an N‐hydroxysuccinimide‐ester mixture (2 mM each of disuccinimidyl glutarate, disuccinimidyl suberate, and ethylene glycol‐bis(succinic acid N‐hydroxysuccinimide ester) in PBS) for 40 min at room temperature. After washing three times with PBS, cells were fixed with 1% formaldehyde for 15 min at room temperature and dissolved in ChIP lysis buffer (10 mM Tris–HCl (pH 8.0), 200 mM NaCl, 1 mM CaCl2, 0.5% NP‐40) containing protease inhibitors. Genomic DNA was sheared with Micrococcal Nuclease (1 unit/μl, Worthington Biochemical Corp.) for 10 min at 37°C. The shearing reaction was terminated by adding 2× SDS ChIP buffer (100 mM Tris–HCl (pH 8.0), 20 mM EDTA, 2% SDS, and protease inhibitors). The chromatin, containing approximately 10 μg DNA, was diluted (1:10) with ChIP dilution buffer (16.7 mM Tris–HCl (pH 8.0), 167 mM NaCl, 0.01% SDS, 1.1% Triton X‐100, 1.2 mM EDTA) containing protease inhibitors then added to the ChIP reaction. Dynabeads M‐280 sheep anti‐rabbit IgG (Veritas) conjugated either with 2 μg Pol II antibody (39097, Active Motif), histone H3K4me3 antibody (39915, Active Motif), or histone H3K27ac antibody (39133, Active Motif) was used for the purification of the immunoprecipitated complex. If needed, 2 μg of the bridging antibody for mouse IgG (53017, Active Motif) was used.
For the Ddx17 and PCAF ChIP assays, siRNA‐treated C2C12 cells were harvested 36 h after differentiation induction and crosslinked with 1% formaldehyde for 10 min at room temperature. After the reaction was quenched by glycine, cells were dissolved in NP‐40 lysis buffer (10 mM Tris–HCl (pH 8.0), 200 mM NaCl, 1 mM CaCl2, 0.5% NP‐40, and protease inhibitors) and incubated on ice. After centrifugation at 7,300 g for 2 min at 4°C, nuclei were dissolved in SDS lysis buffer (50 mM Tris–HCl (pH 8.0), 10 mM EDTA (pH 8.0), 1% SDS, and protease inhibitors) and incubated on ice. To shear the genomic DNA, nuclear lysate diluted with Triton buffer (150 mM NaCl, 15 mM Tris–HCl (pH 8.0), 1 mM EDTA (pH 8.0), 1% Triton X‐100, and protease inhibitors) was sonicated with a Bioruptor UCD‐250 (Cosmo Bio, Japan) at the highest setting with 30‐s ON, 30‐s OFF pulse intervals for 30 cycles at 4°C. After confirming the fragmentation (100–500 bp in length), the lysate was centrifuged at 20,400 g for 10 min at 4°C, and the supernatant was used in the ChIP reaction. Dynabeads M‐280 sheep anti‐rabbit IgG conjugated to either 4 μg Ddx17 antibody (19910‐1‐AP, Proteintech) or PCAF antibody (E‐8) was used to purify the immunoprecipitated complexes. If needed, 2 μg of the bridging antibody for mouse IgG was used.
Precipitates were sequentially washed in low‐salt buffer (20 mM Tris–HCl (pH 8.0), 150 mM NaCl, 0.1% SDS, 1% Triton X‐100, 2 mM EDTA), high‐salt buffer (20 mM Tris–HCl (pH 8.0), 500 mM NaCl, 0.1% SDS, 1% Triton X‐100, 2 mM EDTA), LiCl buffer (10 mM Tris–HCl (pH 8.0), 0.25 M LiCl, 1% NP‐40, 1% sodium deoxycholate, 1 mM EDTA), and twice in TE buffer (10 mM Tris–HCl (pH 8.0), 1 mM EDTA). The immunoprecipitated complexes were extracted and de‐crosslinked in ChIP direct elution buffer (10 mM Tris–HCl (pH 8.0), 300 mM NaCl, 0.5% SDS, 5 mM EDTA) at 65°C for 6–16 h. After sequential treatment with Ribonuclease (DNase free) Solution (Nippon Gene) at 37°C for 30 min and proteinase K (Takara) at 55°C for 1 h, DNA fragments were purified by NucleoSpin (Takara). The precipitation percentage (precipitated DNA vs. input DNA) was calculated by qPCR using the primers listed in Appendix Table S3.
Chromatin isolation by RNA purification assay
Chromatin isolation by RNA purification assays were performed following the protocol described by Chu et al 59. In brief, C2C12 cells (3 × 10⁷) harvested 36 h after differentiation induction were crosslinked with fresh 1% glutaraldehyde for 10 min at room temperature on an end‐to‐end rotator. The reaction was quenched by 0.1 volume of 1.25 M glycine at room temperature for 5 min. After washing with ice‐cold PBS, the cells were lysed in lysis buffer (50 mM Tris–HCl (pH 7.0), 10 mM EDTA, 1% SDS, protease inhibitors, and SUPERase In RNase Inhibitor (1/200 volume, Thermo Fisher Scientific)) and sonicated with a Bioruptor UCD‐250 at the highest setting with 30‐s ON, 45‐s OFF pulse intervals for 80 cycles at 4°C. After confirming the fragmentation (100–500 bp in length), the supernatant was hybridized with 100 pmol BiotinTEG‐labeled tiling probes against Myoparr (Appendix Table S4) or LacZ (Magna ChIRP Negative Control Probe Set, Merck Millipore) at 37°C for 4 h and then mixed with Dynabeads MyOne Streptavidin C1 (Veritas) at 37°C for 30 min. The beads were washed five times with Wash Buffer (0.5% SDS in 2× SSC) at 37°C for 5 min. The retrieved beads were used for following purifications (1/10 volume for RNA and 9/10 volume for DNA). The precipitation percentage (precipitated RNA or DNA vs. input RNA or DNA, respectively) was calculated by qPCR using the primers listed in Appendix Table S3.
Mapping of ChIP‐seq data
Mapping of Pol II occupancy around the myogenin locus was performed using published ChIP‐seq data. The data were downloaded from the Gene Expression Omnibus and converted into BigWig‐formatted files using SraTailor software ver. 1.0.5 60 on the mouse reference genome (mm9). The GEO accession code used for the analysis was GSE25549 61.
Statistical analysis
Error bars represent SD unless otherwise indicated. Statistical analyses were performed using unpaired two‐tailed Student's t‐tests or unpaired two‐tailed Welch's t‐tests in cases of unequal variances. Statistical significance is reported in the Figures and Figure legends. P < 0.05 was considered statistically significant.
Author contributions
KH, MN, AT, YO, AU, HA, HI, and HK conducted the experiments. KH and KT designed the experiments and wrote the paper. All authors revised, edited, and read the manuscript and approved the final manuscript.
Conflict of interest
The authors declare that they have no conflict of interest.
Supporting information
Appendix
Expanded View Figures PDF
Table EV1
Review Process File
Acknowledgments
We thank Dr. H. Danno for technical advice. This work was supported in part by JSPS KAKENHI (25860151, 16K08599, and 17K08646), Intramural Research Grants (26‐8 and 29‐4) for Neurological and Psychiatric Disorders of NCNP, and a Grant‐in‐Aid from the NAKATOMI Foundation.
EMBO Reports (2019) 20: e47468
Data availability
The RNA‐seq raw data for each sample reported in this paper were deposited into the DDBJ Sequence Read Archive under the accession No. DRA005527. The gene sequences reported in this paper were submitted to the DDBJ database. The accession numbers are as follows: AB921551 (Myoparr from the skeletal muscle of C57BL/6J), AB921552 (Myoparr from C2C12 cells), AB921553 (myogenin‐associated sense long non‐coding RNA isoform‐1), AB921554 (myogenin‐associated sense long non‐coding RNA isoform‐2), AB921556 (myogenin‐associated sense long non‐coding RNA isoform‐3), AB921557 (myogenin‐associated sense long non‐coding RNA isoform‐4), AB921555 (myogenin‐associated sense long non‐coding RNA isoform‐5), LC388421 (myogenin‐associated sense long non‐coding RNA isoform‐6), LC388422 (myogenin‐associated sense long non‐coding RNA isoform‐7), LC366983 (human Myoparr isoform‐1), and LC366984 (human Myoparr isoform‐2).
References
- 1. Hon C‐C, Ramilowski JA, Harshbarger J, Bertin N, Rackham OJL, Gough J, Denisenko E, Schmeier S, Poulsen TM, Severin J et al (2017) An atlas of human long non‐coding RNAs with accurate 5’ ends. Nature 543: 199–204 [DOI] [PMC free article] [PubMed] [Google Scholar]
- 2. Andersson R, Gebhard C, Miguel‐Escalada I, Hoof I, Bornholdt J, Boyd M, Chen Y, Zhao X, Schmidl C, Suzuki T et al (2014) An atlas of active enhancers across human cell types and tissues. Nature 507: 455–461 [DOI] [PMC free article] [PubMed] [Google Scholar]
- 3. Luo S, Lu JY, Liu L, Yin Y, Chen C, Han X, Wu B, Xu R, Liu W, Yan P et al (2016) Divergent lncRNAs regulate gene expression and lineage differentiation in pluripotent cells. Cell Stem Cell 18: 637–652 [DOI] [PubMed] [Google Scholar]
- 4. Preker P, Nielsen J, Kammler S, Lykke‐Andersen S, Christensen MS, Mapendano CK, Schierup MH, Jensen TH (2008) RNA exosome depletion reveals transcription upstream of active human promoters. Science 322: 1851–1854 [DOI] [PubMed] [Google Scholar]
- 5. Preker P, Almvig K, Christensen MS, Valen E, Mapendano CK, Sandelin A, Jensen TH (2011) PROMoter uPstream Transcripts share characteristics with mRNAs and are produced upstream of all three major types of mammalian promoters. Nucleic Acids Res 39: 7179–7193 [DOI] [PMC free article] [PubMed] [Google Scholar]
- 6. Lepoivre C, Belhocine M, Bergon A, Griffon A, Yammine M, Vanhille L, Zacarias‐Cabeza J, Garibal M‐A, Koch F, Maqbool MA et al (2013) Divergent transcription is associated with promoters of transcriptional regulators. BMC Genom 14: 914 [DOI] [PMC free article] [PubMed] [Google Scholar]
- 7. Sigova AA, Mullen AC, Molinie B, Gupta S, Orlando DA, Guenther MG, Almada AE, Lin C, Sharp PA, Giallourakis CC et al (2013) Divergent transcription of long noncoding RNA/mRNA gene pairs in embryonic stem cells. Proc Natl Acad Sci USA 110: 2876–2881 [DOI] [PMC free article] [PubMed] [Google Scholar]
- 8. Hamazaki N, Uesaka M, Nakashima K, Agata K, Imamura T (2015) Gene activation‐associated long noncoding RNAs function in mouse preimplantation development. Development 142: 910–920 [DOI] [PMC free article] [PubMed] [Google Scholar]
- 9. Ruijtenberg S, van den Heuvel S (2016) Coordinating cell proliferation and differentiation: antagonism between cell cycle regulators and cell type‐specific gene expression. Cell Cycle 15: 196–212 [DOI] [PMC free article] [PubMed] [Google Scholar]
- 10. Tapscott SJ (2005) The circuitry of a master switch: myod and the regulation of skeletal muscle gene transcription. Development 132: 2685–2695 [DOI] [PubMed] [Google Scholar]
- 11. Cao Y, Kumar RM, Penn BH, Berkes CA, Kooperberg C, Boyer LA, Young RA, Tapscott SJ (2006) Global and gene‐specific analyses show distinct roles for Myod and Myog at a common set of promoters. EMBO J 25: 502–511 [DOI] [PMC free article] [PubMed] [Google Scholar]
- 12. Horak M, Novak J, Bienertova‐Vasku J (2016) Muscle‐specific microRNAs in skeletal muscle development. Dev Biol 410: 1–13 [DOI] [PubMed] [Google Scholar]
- 13. Faralli H, Dilworth FJ (2012) Turning on myogenin in muscle: a paradigm for understanding mechanisms of tissue‐specific gene expression. Comp Funct Genomics 2012: 836374 [DOI] [PMC free article] [PubMed] [Google Scholar]
- 14. Yee SP, Rigby PW (1993) The regulation of myogenin gene expression during the embryonic development of the mouse. Genes Dev 7: 1277–1289 [DOI] [PubMed] [Google Scholar]
- 15. Zhang B, Gunawardane L, Niazi F, Jahanbani F, Chen X, Valadkhan S (2014) A novel RNA motif mediates the strict nuclear localization of a long noncoding RNA. Mol Cell Biol 34: 2318–2329 [DOI] [PMC free article] [PubMed] [Google Scholar]
- 16. Anderson KM, Anderson DM, McAnally JR, Shelton JM, Bassel‐Duby R, Olson EN (2016) Transcription of the non‐coding RNA upperhand controls Hand2 expression and heart development. Nature 539: 433–436 [DOI] [PMC free article] [PubMed] [Google Scholar]
- 17. Werner MS, Ruthenburg AJ (2015) Nuclear fractionation reveals thousands of chromatin‐tethered noncoding RNAs adjacent to active genes. Cell Rep 12: 1089–1098 [DOI] [PMC free article] [PubMed] [Google Scholar]
- 18. Dimitrova N, Zamudio JR, Jong RM, Soukup D, Resnick R, Sarma K, Ward AJ, Raj A, Lee JT, Sharp PA et al (2014) LincRNA‐p21 activates p21 in cis to promote Polycomb target gene expression and to enforce the G1/S checkpoint. Mol Cell 54: 777–790 [DOI] [PMC free article] [PubMed] [Google Scholar]
- 19. Liu D, Kang JS, Derynck R (2004) TGF‐beta‐activated Smad3 represses MEF2‐dependent transcription in myogenic differentiation. EMBO J 23: 1557–1566 [DOI] [PMC free article] [PubMed] [Google Scholar]
- 20. Liu D, Black BL, Derynck R (2001) TGF‐beta inhibits muscle differentiation through functional repression of myogenic transcription factors by Smad3. Genes Dev 15: 2950–2966 [DOI] [PMC free article] [PubMed] [Google Scholar]
- 21. Fatica A, Bozzoni I (2014) Long non‐coding RNAs: new players in cell differentiation and development. Nat Rev Genet 15: 7–21 [DOI] [PubMed] [Google Scholar]
- 22. Caretti G, Schiltz RL, Dilworth FJ, Di Padova M, Zhao P, Ogryzko V, Fuller‐Pace FV, Hoffman EP, Tapscott SJ, Sartorelli V (2006) The RNA helicases p68/p72 and the noncoding RNA SRA are coregulators of MyoD and skeletal muscle differentiation. Dev Cell 11: 547–560 [DOI] [PubMed] [Google Scholar]
- 23. Dardenne E, Polay Espinoza M, Fattet L, Germann S, Lambert M‐P, Neil H, Zonta E, Mortada H, Gratadou L, Deygas M et al (2014) RNA helicases DDX5 and DDX17 dynamically orchestrate transcription, miRNA, and splicing programs in cell differentiation. Cell Rep 7: 1900–1913 [DOI] [PubMed] [Google Scholar]
- 24. Engreitz JM, Haines JE, Perez EM, Munson G, Chen J, Kane M, McDonel PE, Guttman M, Lander ES (2016) Local regulation of gene expression by lncRNA promoters, transcription and splicing. Nature 539: 452–455 [DOI] [PMC free article] [PubMed] [Google Scholar]
- 25. Liu R, Liu H, Chen X, Kirby M, Brown PO, Zhao K (2001) Regulation of CSF1 promoter by the SWI/SNF‐like BAF complex. Cell 106: 309–318 [DOI] [PubMed] [Google Scholar]
- 26. Hönig A, Auboeuf D, Parker MM, O'Malley BW, Berget SM (2002) Regulation of alternative splicing by the ATP‐dependent DEAD‐box RNA helicase p72. Mol Cell Biol 22: 5698–5707 [DOI] [PMC free article] [PubMed] [Google Scholar]
- 27. Feng Y, Niu L‐L, Wei W, Zhang W‐Y, Li X‐Y, Cao J‐H, Zhao S‐H (2013) A feedback circuit between miR‐133 and the ERK1/2 pathway involving an exquisite mechanism for regulating myoblast proliferation and differentiation. Cell Death Dis 4: e934 [DOI] [PMC free article] [PubMed] [Google Scholar]
- 28. Kim HK, Lee YS, Sivaprasad U, Malhotra A, Dutta A (2006) Muscle‐specific microRNA miR‐206 promotes muscle differentiation. J Cell Biol 174: 677–687 [DOI] [PMC free article] [PubMed] [Google Scholar]
- 29. Dey BK, Pfeifer K, Dutta A (2014) The H19 long noncoding RNA gives rise to microRNAs miR‐675‐3p and miR‐675‐5p to promote skeletal muscle differentiation and regeneration. Genes Dev 28: 491–501 [DOI] [PMC free article] [PubMed] [Google Scholar]
- 30. Eftimie R, Brenner HR, Buonanno A (1991) Myogenin and MyoD join a family of skeletal muscle genes regulated by electrical activity. Proc Natl Acad Sci USA 88: 1349–1353 [DOI] [PMC free article] [PubMed] [Google Scholar]
- 31. Moresi V, Williams AH, Meadows E, Flynn JM, Potthoff MJ, McAnally J, Shelton JM, Backs J, Klein WH, Richardson JA et al (2010) Myogenin and class II HDACs control neurogenic muscle atrophy by inducing E3 ubiquitin ligases. Cell 143: 35–45 [DOI] [PMC free article] [PubMed] [Google Scholar]
- 32. Fuller‐Pace FV (2013) The DEAD box proteins DDX5 (p68) and DDX17 (p72): multi‐tasking transcriptional regulators. Biochim Biophys Acta 1829: 756–763 [DOI] [PubMed] [Google Scholar]
- 33. Sartorelli V, Puri PL, Hamamori Y, Ogryzko V, Chung G, Nakatani Y, Wang JY, Kedes L (1999) Acetylation of MyoD directed by PCAF is necessary for the execution of the muscle program. Mol Cell 4: 725–734 [DOI] [PubMed] [Google Scholar]
- 34. Dilworth FJ, Seaver KJ, Fishburn AL, Htet SL, Tapscott SJ (2004) In vitro transcription system delineates the distinct roles of the coactivators pCAF and p300 during MyoD/E47‐dependent transactivation. Proc Natl Acad Sci USA 101: 11593–11598 [DOI] [PMC free article] [PubMed] [Google Scholar]
- 35. Shin S, Janknecht R (2007) Concerted activation of the Mdm2 promoter by p72 RNA helicase and the coactivators p300 and P/CAF. J Cell Biochem 101: 1252–1265 [DOI] [PubMed] [Google Scholar]
- 36. Puri PL, Sartorelli V, Yang XJ, Hamamori Y, Ogryzko VV, Howard BH, Kedes L, Wang JY, Graessmann A, Nakatani Y et al (1997) Differential roles of p300 and PCAF acetyltransferases in muscle differentiation. Mol Cell 1: 35–45 [DOI] [PubMed] [Google Scholar]
- 37. Choi SI, Han KS, Kim CW, Ryu K‐S, Kim BH, Kim K‐H, Kim S‐I, Kang TH, Shin H‐C, Lim K‐H et al (2008) Protein solubility and folding enhancement by interaction with RNA. PLoS ONE 3: e2677 [DOI] [PMC free article] [PubMed] [Google Scholar]
- 38. Docter BE, Horowitz S, Gray MJ, Jakob U, Bardwell JCA (2016) Do nucleic acids moonlight as molecular chaperones? Nucleic Acids Res 44: 4835–4845 [DOI] [PMC free article] [PubMed] [Google Scholar]
- 39. Meadows E, Cho J‐H, Flynn JM, Klein WH (2008) Myogenin regulates a distinct genetic program in adult muscle stem cells. Dev Biol 322: 406–414 [DOI] [PubMed] [Google Scholar]
- 40. Méjat A, Ramond F, Bassel‐Duby R, Khochbin S, Olson EN, Schaeffer L (2005) Histone deacetylase 9 couples neuronal activity to muscle chromatin acetylation and gene expression. Nat Neurosci 8: 313–321 [DOI] [PubMed] [Google Scholar]
- 41. Bricceno KV, Sampognaro PJ, Van Meerbeke JP, Sumner CJ, Fischbeck KH, Burnett BG (2012) Histone deacetylase inhibition suppresses myogenin‐dependent atrogene activation in spinal muscular atrophy mice. Hum Mol Genet 21: 4448–4459 [DOI] [PMC free article] [PubMed] [Google Scholar]
- 42. Galbiati M, Onesto E, Zito A, Crippa V, Rusmini P, Mariotti R, Bentivoglio M, Bendotti C, Poletti A (2012) The anabolic/androgenic steroid nandrolone exacerbates gene expression modifications induced by mutant SOD1 in muscles of mice models of amyotrophic lateral sclerosis. Pharmacol Res 65: 221–230 [DOI] [PMC free article] [PubMed] [Google Scholar]
- 43. Mielcarek M, Toczek M, Smeets CJLM, Franklin SA, Bondulich MK, Jolinon N, Muller T, Ahmed M, Dick JRT, Piotrowska I et al (2015) HDAC4‐myogenin axis as an important marker of HD‐related skeletal muscle atrophy. PLoS Genet 11: e1005021 [DOI] [PMC free article] [PubMed] [Google Scholar]
- 44. Huarte M, Guttman M, Feldser D, Garber M, Koziol MJ, Kenzelmann‐Broz D, Khalil AM, Zuk O, Amit I, Rabani M et al (2010) A large intergenic noncoding RNA induced by p53 mediates global gene repression in the p53 response. Cell 142: 409–419 [DOI] [PMC free article] [PubMed] [Google Scholar]
- 45. Liu L, Yue H, Liu Q, Yuan J, Li J, Wei G, Chen X, Lu Y, Guo M, Luo J et al (2016) LncRNA MT1JP functions as a tumor suppressor by interacting with TIAR to modulate the p53 pathway. Oncotarget 7: 15787–15800 [DOI] [PMC free article] [PubMed] [Google Scholar]
- 46. Uezumi A, Fukada S‐I, Yamamoto N, Takeda S, Tsuchida K (2010) Mesenchymal progenitors distinct from satellite cells contribute to ectopic fat cell formation in skeletal muscle. Nat Cell Biol 12: 143–152 [DOI] [PubMed] [Google Scholar]
- 47. Uezumi A, Fukada S, Yamamoto N, Ikemoto‐Uezumi M, Nakatani M, Morita M, Yamaguchi A, Yamada H, Nishino I, Hamada Y et al (2014) Identification and characterization of PDGFRα+ mesenchymal progenitors in human skeletal muscle. Cell Death Dis 5: e1186 [DOI] [PMC free article] [PubMed] [Google Scholar]
- 48. Hitachi K, Nakatani M, Tsuchida K (2014) Myostatin signaling regulates Akt activity via the regulation of miR‐486 expression. Int J Biochem Cell Biol 47: 93–103 [DOI] [PubMed] [Google Scholar]
- 49. Hohenstein P, Slight J, Ozdemir DD, Burn SF, Berry R, Hastie ND (2008) High‐efficiency Rosa26 knock‐in vector construction for Cre‐regulated overexpression and RNAi. Pathogenetics 1: 3 [DOI] [PMC free article] [PubMed] [Google Scholar]
- 50. Hitachi K, Tsuchida K (2017) Myostatin‐deficiency in mice increases global gene expression at the Dlk1‐Dio3 locus in the skeletal muscle. Oncotarget 8: 5943–5953 [DOI] [PMC free article] [PubMed] [Google Scholar]
- 51. Pertea M, Kim D, Pertea GM, Leek JT, Salzberg SL (2016) Transcript‐level expression analysis of RNA‐seq experiments with HISAT, StringTie and Ballgown. Nat Protoc 11: 1650–1667 [DOI] [PMC free article] [PubMed] [Google Scholar]
- 52. Li H, Handsaker B, Wysoker A, Fennell T, Ruan J, Homer N, Marth G, Abecasis G, Durbin R, 1000 Genome Project Data Processing Subgroup (2009) The sequence alignment/Map format and SAMtools. Bioinformatics 25: 2078–2079 [DOI] [PMC free article] [PubMed] [Google Scholar]
- 53. Anders S, Pyl PT, Huber W (2015) HTSeq–a Python framework to work with high‐throughput sequencing data. Bioinformatics 31: 166–169 [DOI] [PMC free article] [PubMed] [Google Scholar]
- 54. Love MI, Huber W, Anders S (2014) Moderated estimation of fold change and dispersion for RNA‐seq data with DESeq2. Genome Biol 15: 550 [DOI] [PMC free article] [PubMed] [Google Scholar]
- 55. Miao Y, Ajami NE, Huang T‐S, Lin F‐M, Lou C‐H, Wang Y‐T, Li S, Kang J, Munkacsi H, Maurya MR et al (2018) Enhancer‐associated long non‐coding RNA LEENE regulates endothelial nitric oxide synthase and endothelial function. Nat Commun 9: 292 [DOI] [PMC free article] [PubMed] [Google Scholar]
- 56. Wang L, Park HJ, Dasari S, Wang S, Kocher J‐P, Li W (2013) CPAT: coding‐potential assessment tool using an alignment‐free logistic regression model. Nucleic Acids Res 41: e74 [DOI] [PMC free article] [PubMed] [Google Scholar]
- 57. Kurosawa G, Sumitomo M, Akahori Y, Matsuda K, Muramatsu C, Takasaki A, Iba Y, Eguchi K, Tanaka M, Suzuki K et al (2009) Methods for comprehensive identification of membrane proteins recognized by a large number of monoclonal antibodies. J Immunol Methods 351: 1–12 [DOI] [PubMed] [Google Scholar]
- 58. Klenova E, Chernukhin I, Inoue T, Shamsuddin S, Norton J (2002) Immunoprecipitation techniques for the analysis of transcription factor complexes. Methods 26: 254–259 [DOI] [PubMed] [Google Scholar]
- 59. Chu C, Quinn J, Chang HY (2012) Chromatin isolation by RNA purification (ChIRP). J Vis Exp 61: e3912 [DOI] [PMC free article] [PubMed] [Google Scholar]
- 60. Oki S, Maehara K, Ohkawa Y, Meno C (2014) SraTailor: graphical user interface software for processing and visualizing ChIP‐seq data. Genes Cells 19: 919–926 [DOI] [PubMed] [Google Scholar]
- 61. Mousavi K, Zare H, Wang AH, Sartorelli V (2012) Polycomb protein Ezh1 promotes RNA polymerase II elongation. Mol Cell 45: 255–262 [DOI] [PMC free article] [PubMed] [Google Scholar]
Associated Data
This section collects any data citations, data availability statements, or supplementary materials included in this article.
Supplementary Materials
Appendix
Expanded View Figures PDF
Table EV1
Review Process File
Data Availability Statement
The RNA‐seq raw data for each sample reported in this paper were deposited into the DDBJ Sequence Read Archive under the accession No. DRA005527. The gene sequences reported in this paper were submitted to the DDBJ database. The accession numbers are as follows: AB921551 (Myoparr from the skeletal muscle of C57BL/6J), AB921552 (Myoparr from C2C12 cells), AB921553 (myogenin‐associated sense long non‐coding RNA isoform‐1), AB921554 (myogenin‐associated sense long non‐coding RNA isoform‐2), AB921556 (myogenin‐associated sense long non‐coding RNA isoform‐3), AB921557 (myogenin‐associated sense long non‐coding RNA isoform‐4), AB921555 (myogenin‐associated sense long non‐coding RNA isoform‐5), LC388421 (myogenin‐associated sense long non‐coding RNA isoform‐6), LC388422 (myogenin‐associated sense long non‐coding RNA isoform‐7), LC366983 (human Myoparr isoform‐1), and LC366984 (human Myoparr isoform‐2).