Abstract
A key regulated step of transcription in all cellular organisms is promoter melting by the RNA polymerase (RNAP) to form the open promoter complex1–3. To generate the open complex, the conserved catalytic core of the RNAP combines with initiation factors to locate promoter DNA, unwind 12–14 base pairs (bps) of the DNA duplex, and load the template-strand (t-strand) DNA into the RNAP active site. Formation of the open complex is a multi-step process with transient intermediates of unknown structures4–6. Here, we present cryo-electron microscopy structures of bacterial RNAP-promoter DNA complexes, including the first structures of partially melted intermediates. The structures unequivocally show that late steps of promoter melting occur within the RNAP cleft, delineate key roles for fork-loop 2 (FL2) and switch 2 (Sw2), universal structural features of RNAP, in restricting access of DNA to the RNAP active site, and explain why clamp opening is required to allow entry of single-stranded template DNA into the active site. The key roles of the FL2 and Sw2 suggest a common mechanism for late steps in promoter DNA opening to enable gene expression in all domains of life.
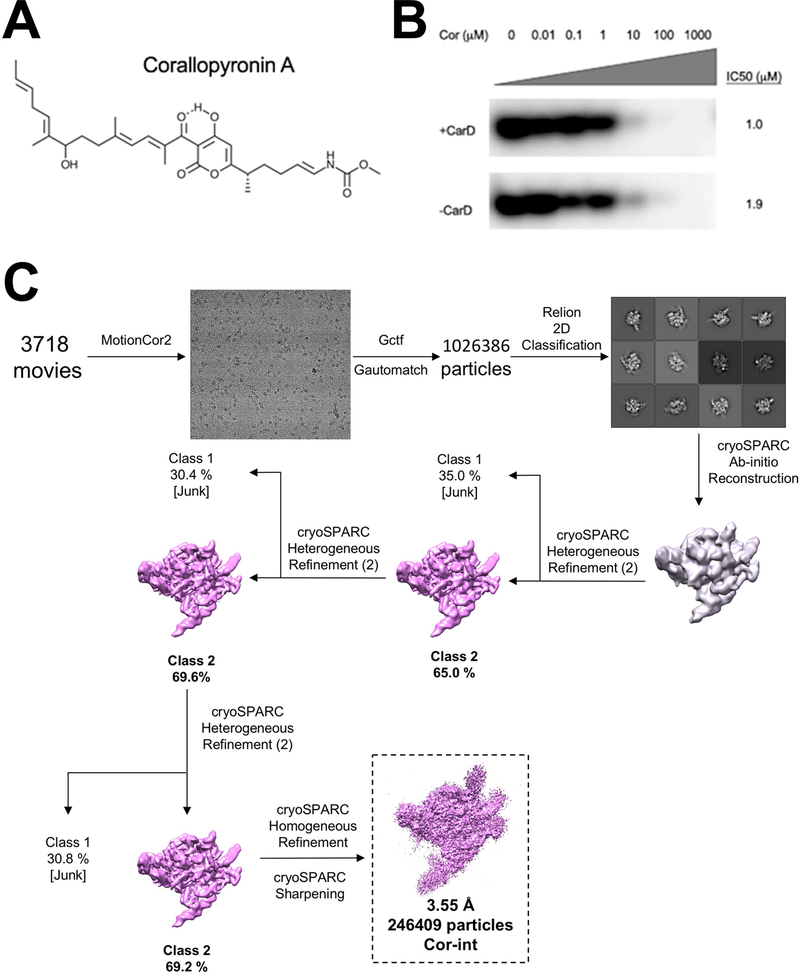
Structures of promoter melting intermediates are essential to understand the mechanism of open promoter complex (RPo) formation. We took advantage of corallopyronin A (Cor; Extended Data Fig. 1A), an antibiotic closely related in structure and function to myxopyronin (Myx)7,8, which was previously shown to inhibit RPo formation by trapping a partially melted intermediate7. A structure of bacterial RNAP with Cor is not available. As a target for Cor inhibition, we used Mycobacterium tuberculosis (Mtb) RNAP, which was inhibited by Cor in abortive initiation assays using the well-characterized Mtb rrnAP3 promoter as a template(Fig. 1A, Extended Data Fig. 1B)9. To assemble the complex for structural studies, we incubated the components of the Mtb RNAP housekeeping initiation complex (Mtb core RNAP and σA, along with essential Mtb general transcription factors RbpA and CarD)9 with Cor, then added duplex AP3 promoter template. After incubation, cryo-electron microscopy (cryo-EM) grids were prepared. A parallel sample was prepared without Cor.
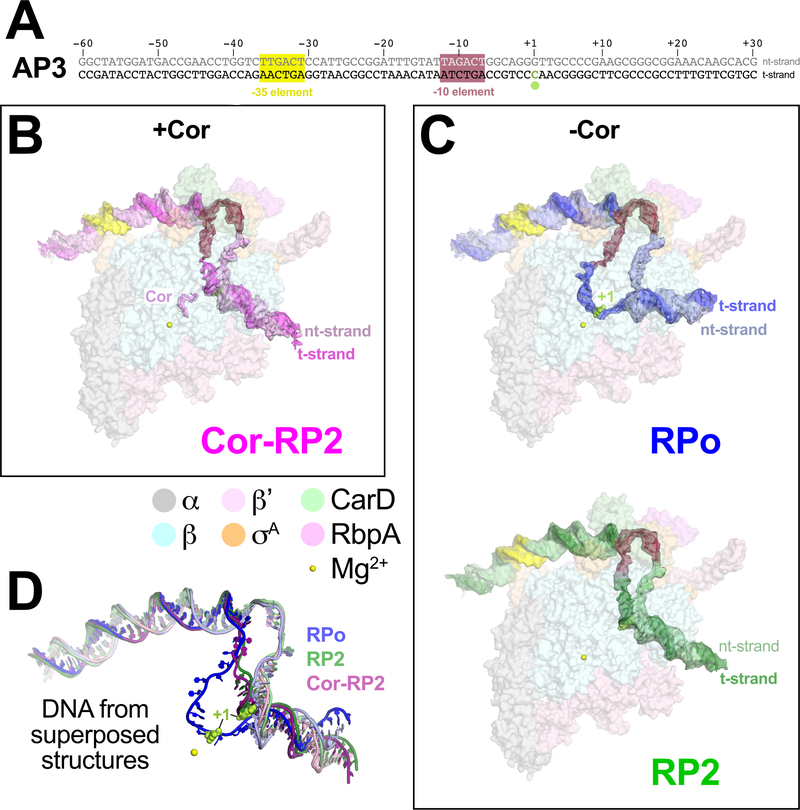
Figure 1 |. Structures of Mtb transcription initiation complexes with AP3 promoter DNA.
A. Mtb AP3 promoter9 fragment used for cryo-EM. The core promoter elements and the TSS (+1) are denoted.
B. Overall structure of Cor-RP2. Proteins are shown as transparent surfaces and color-coded as shown in the key. The Cor and DNA (labeled with the −35, −10 elements and +1 colored as in (A)) are shown with transparent cryo-EM difference density and colored as labeled.
C. Overall structures of RPo and RP2. Proteins and DNAs are shown as in (B) with DNA colors as labeled.
D. Superposed DNAs (colored as in B and C) from RPo, Cor-RP2, and RP2.
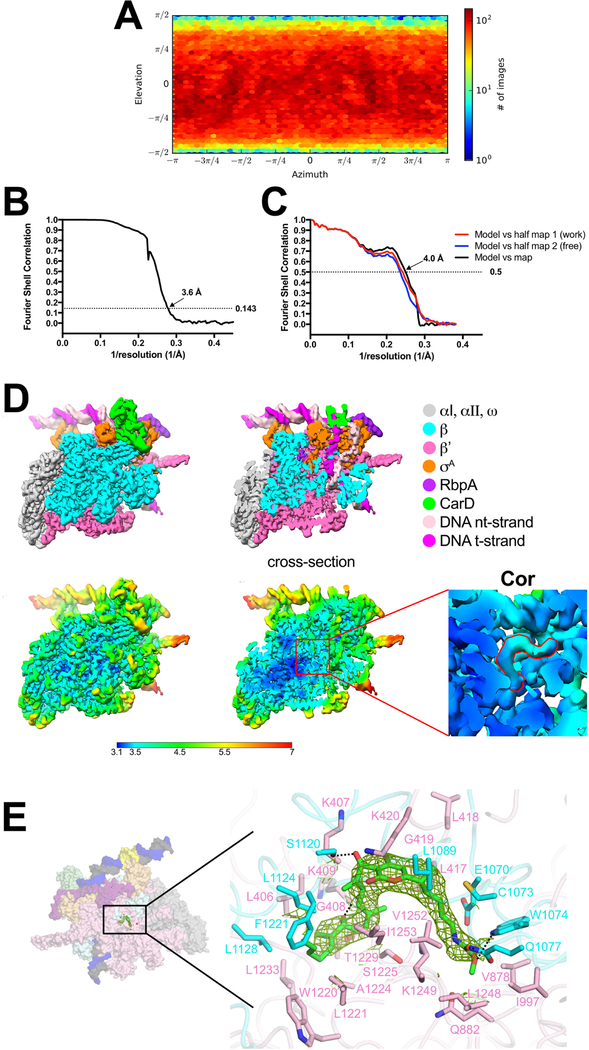
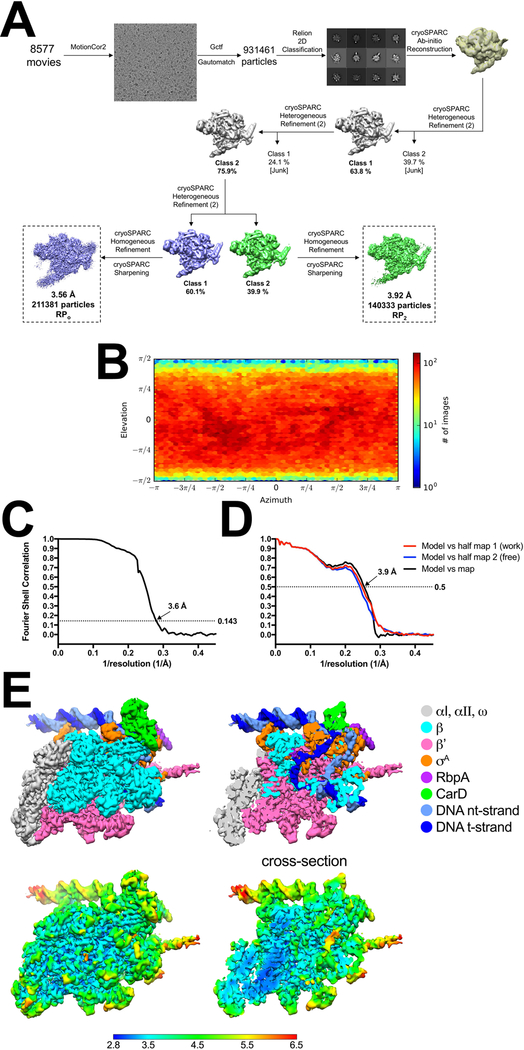
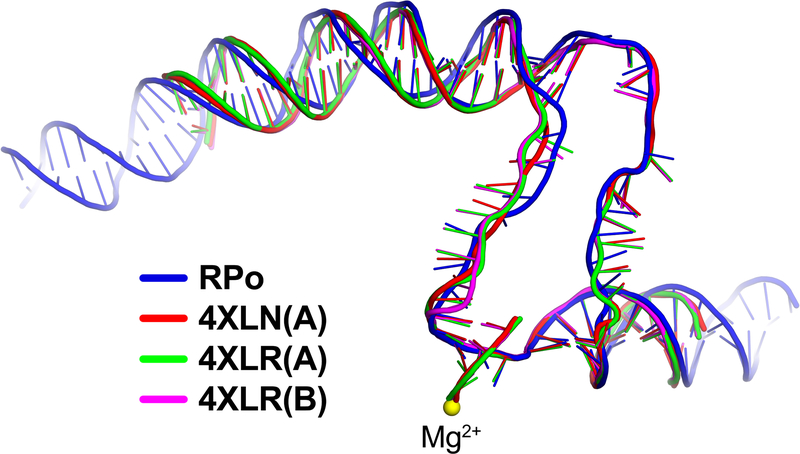
Cryo-EM data from the sample with Cor yielded a single class at a nominal resolution of 3.6 Å, comprising the Mtb initiation complex (CarD-RbpA-σA holoenzyme) bound to Cor (Extended Data Figs. 1C, 2) and also bound to the promoter DNA in a configuration distinct from RPo (Fig. 1B, Extended Data Table 1)10. The dataset without Cor was processed in a similar fashion and gave rise to two distinct classes (Fig. 1C, Extended Data Fig. 3A). The first class contained approximately 60% of the particles at a nominal resolution of 3.6 Å (Extended Data Fig. 3B–E) and comprised the Mtb initiation complex engaged with the promoter DNA melted into a complete 13 nucleotide transcription bubble (−11 to +2) with the t-strand DNA base at the transcription start site (TSS) (+1) near the RNAP active site Mg2+ (11 Å away) ready to template the incoming initiating NTP (Figs. 1C, 2A). The overall path of the DNA backbone matched previously determined RPo structures (Extended Data Fig. 4), hence we call this structure RPo. The second class contained approximately 40% of the particles at a nominal resolution of 3.9 Å (Extended Data Fig. 5) and comprised the Mtb initiation complex bound to the promoter DNA in a configuration very similar to the Cor-bound structure (Figs. 1B–D). We call this structure RP2 (and the Cor-bound structure Cor-RP2) for reasons explained below.
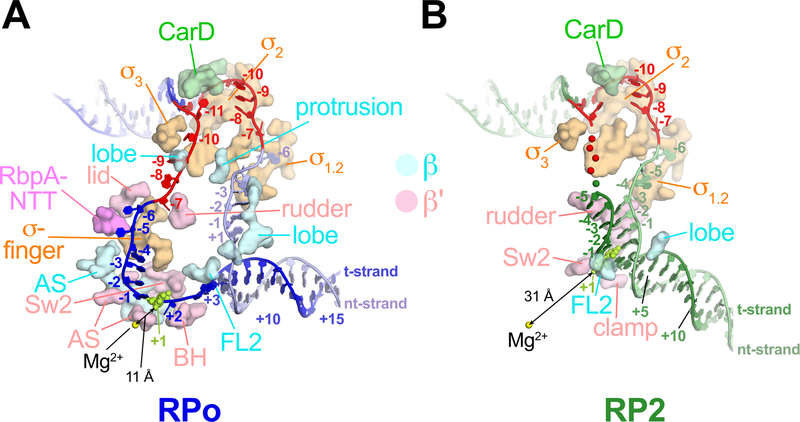
Figure 2 |. Protein/transcription bubble interactions.
DNAs are colored as in Fig. 1C. RNAP, CarD and RbpA residues that contact the DNA (< 4.5 Å) between −12 to +3 are shown as surfaces and labeled (FL2, fork loop 2; Sw2, switch 2; BH, bridge helix; AS, RNAP active site region). The double-arrowed black line denotes the shortest distance between the RNAP active site Mg2+ and an atom of the +1 t-strand DNA.
A. RPo.
B. RP2.
The cryo-EM maps revealed clear details of the interactions between RNAP and the DNA (Extended Data Fig. 6). In RPo, the promoter DNA from −12 to +3 (the transcription bubble from −11 to +2 plus the upstream and downstream double-strand/single-strand, ds/ss, junctions) interacts with conserved elements of the σ-factor as well as RNAP structural elements conserved in all kingdoms of life (Fig. 2A)11. We also observed protein/DNA interactions between the general transcription factors CarD and RbpA, both essential in mycobacteria but absent in E. coli (Eco)9,12 (Fig. 2A).
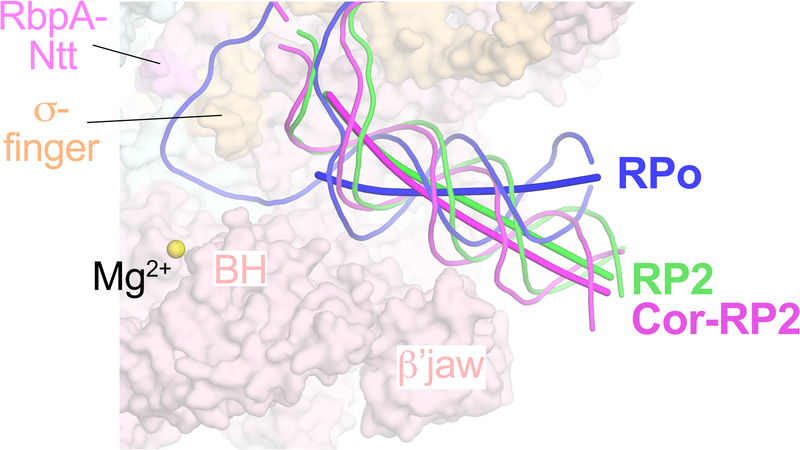
RP2 is a newly observed intermediate that contains a partially melted eight nucleotide bubble (−11 to −4) (Figs. 1B, 1C, 2B). While the upstream duplex portion of the promoter DNA in both the Cor-RP2 and RP2 structures is nearly identical to RPo (Fig. 1D), the protein/DNA interactions downstream differ substantially (Fig. 2). Belogurov et al.7 showed that Myx blocked bubble propagation downstream of −3, consistent with our Mtb RNAP RP2 structures. In the RP2 structures, the TSS (+1) is base-paired with the nontemplate strand (nt-strand) and located more than 30 Å from the RNAP active site Mg2+ (Figs. 1B, 1C, 2B). The base-paired DNA in RP2 that is ultimately melted in RPo (−3 to +2) as well as the duplex DNA further downstream to about +12 is enclosed in the RNAP cleft (Figs. 1B, 1C), but the helical axis is tilted about 35° compared to the downstream duplex of RPo (Extended Data Fig. 7).
Clamp dynamics play an important role in promoter melting for all cellular RNAPs13–15. In bacteria, early steps of promoter melting (transcription bubble nucleation) require clamp closure, while later steps (transcription bubble propagation to +1 and loading of the t-strand DNA into the RNAP active site) require clamp opening13. Finally, clamp closure stabilizes RPo16.
Like Myx, Cor closes the Eco RNAP clamp in solution, as shown by FRET16. We determined a cryo-EM structure of Mtb RNAP with Cor in the absence of downstream DNA (Cor-holo-us-fork) to a nominal resolution of 4.4 Å (Extended Data Figs. 8A–C) and compared it with a cryo-EM structure of holo without Cor (6C05)17, confirming that Cor closes the Mtb RNAP clamp in solution as well (Extended Data Fig. 8D).
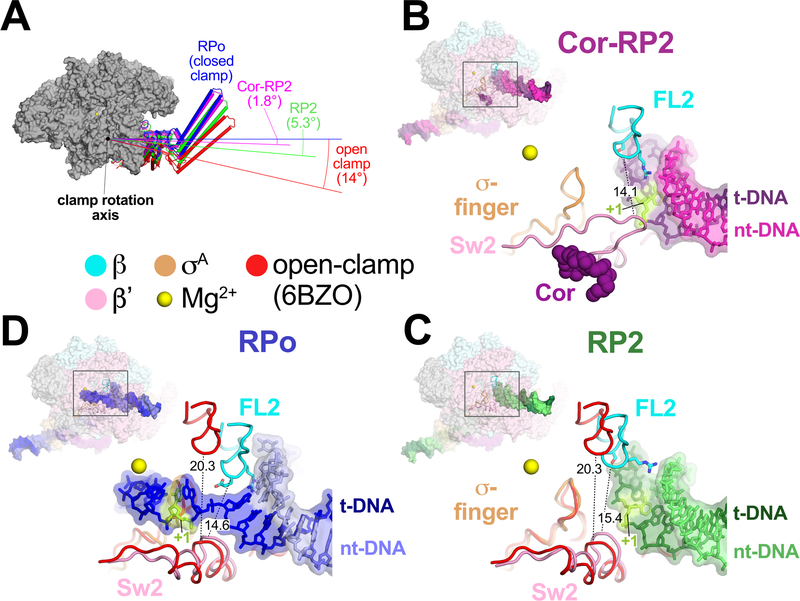
When the cryo-EM structures of promoter complexes (RPo, RP2, Cor-RP2) were superimposed (Extended Data Table 2), clamp conformational changes could be characterized as rigid body rotations about a common axis (Fig. 3A). Assigning a clamp rotation angle of 0° (closed clamp) to RPo, the Cor-RP2 and RP2 clamps are rotated open by 1.8° and 5.3°, respectively. By comparison, the clamp of an open clamp structure (6BZO)17 is opened by 14°.
Figure 3 |. FL2, Sw2, and clamp dynamics.
A. RNAP clamp conformations. The RPo structure was used as a reference to superimpose the other structures by a common core RNAP structure (gray), revealing shifts in the clamp. Clamps are shown as cylindrical helices along with angles of clamp opening (relative to RPo at 0°). The open clamp structure (6BZO) is the Mtb RNAP bound to Fidaxomicin, which stabilizes the clamp in a fully open position without DNA in the active site cleft17.
B. Overall structure of Cor-RP2 (upper left), with the boxed region magnified (lower right) showing the DNA and RNAP structural elements colored as labeled. Side chains of FL2 residues contacting the DNA (G462, S464, R467) are shown. Cor is also shown. The shortest distance between FL2 and Sw2 α-carbons is noted.
C. Same as B but showing RP2. Superimposed are the FL2, Sw2, and σ-fingers from the open clamp structure, aligned via the clamp, modelling a transient open-clamp intermediate. The shortest distance between FL2 and Sw2 α-carbons for each structure is noted.
D. Same as C but showing RPo.
Analyses of the RP2 and Cor-RP2 structures delineate key roles for FL2 and Sw2, as well as clamp dynamics13, in the late stages of promoter melting. In the RP2 structures, the duplex DNA that needs to be melted to form RPo (from −3 to +2) is blocked from approaching the active site Mg2+ by interactions with FL2 and the narrow gap between FL2 and Sw2 due to the relatively closed clamp conformation of RP2 (Figs. 3A–C). The Cor-RP2 clamp presumably cannot open due to the bound Cor (Fig. 3B, Extended Data Fig. 8D)8, but opening of the RP2 clamp would break the FL2-duplex DNA interactions and widen the FL2-Sw2 gap from 15.4 Å to 20.3 Å (determined by measuring the minimal FL2-Sw2 α-carbon to α-carbon distance; βE466 to β’K409), allowing passage of the ss t-strand DNA as it unwinds from the duplex by rotation of the downstream DNA13. With the t-strand DNA in place, clamp closure would again restrict the FL2-Sw2 gap (Fig. 3D), helping to enforce the separation of the two DNA strands at the downstream ss/ds junction and stabilizing RPo (Fig. 3D). Single amino acid substitutions at multiple positions in or near FL2 destabilize RPo and reduce transcription from promoters limited by the RPo lifetime, consistent with a role for FL2 in RPo formation and/or dissociation18,19.
Like Myx7, Cor refolds Sw2, resulting in a configuration that is sterically incompatible with the ss t-strand DNA in RPo (Fig. 3B). While Mukhopadhyay et al.8 proposed that Myx functions by interfering with clamp opening, Belogurov et al.7 proposed that the steric clash of the reconfigured Sw2 with the t-strand DNA explained Myx action. Our analysis suggests that both mechanisms likely contribute to Myx/Cor action.
Our finding that the partially melted state trapped by Cor (Fig. 1B) is very similar to a state observed in the absence of Cor (Fig. 1C) suggests that this structure corresponds to an ‘on-pathway’ promoter melting intermediate. In RP2, the TSS is base-paired as a part of the duplex DNA enclosed within the RNAP cleft (Figs. 1C, 2B, 3C). In RPo, the start site is fully melted to template the incoming initiating NTP (Figs. 1B, 2A, 3D). Thus, our RP2 structures show that promoter melting occurs in multiple steps and that opening of the TSS occurs within the RNAP active site cleft.
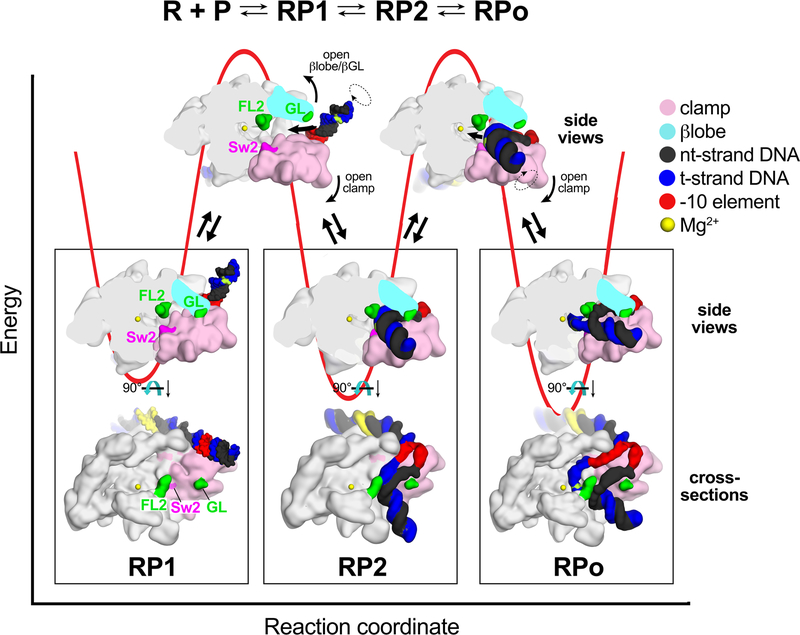
Seminal work on the kinetics of RPo formation by Eco RNAP, as well as an analysis of RPo formation by mycobacterial RNAP on the AP3 promoter used here, established a minimal, three-step sequential mechanism4–69. After formation of the initial encounter complex between RNAP and duplex promoter DNA (the closed complex, which we term RP1; Fig. 4), two major energetic barriers exist on the pathway to RPo formation, corresponding to the RP1 → RP2 and RP2 → RPo transitions (Fig. 4). Strikingly, consideration of the trajectory the DNA must traverse on its way from outside the active site cleft (in the RP1 model) to the final position near the RNAP active site in RPo reveals two major physical barriers. First, in the closed clamp RNAP conformation required for transcription bubble nucleation13, the gate loop (GL) of the RNAP β pincer20 interacts with the clamp, sealing off DNA access to the RNAP cleft (Fig. 4). An RNAP conformational change, either opening of the βlobe/GL and/or clamp opening, is required to allow DNA access to a vestibule in the RNAP cleft between the GL and FL2, giving rise to RP2 (Fig. 4). As outlined above, clamp opening is then required to open the narrow FL2/Sw2 gap (Figs. 3C, 4), allowing the ss t-strand DNA to pass and position itself near the RNAP active site in RPo (Figs. 3D, 4). This second step, which corresponds to propagation of the transcription bubble from −3 to +2 and positioning of the ss t-strand into the RNAP active site, is the highest energy barrier (rate-limiting step) at the AP3 promoter9.
Figure 4 |. Structural energetics for RPo formation.
Top; Three-step sequential kinetic scheme for RPo formation by bacterial RNAP9.
Bottom; A schematic free energy profile for the last two steps of RPo formation is shown (red line) with cartoon structures of stable states and transitions, illustrating RNAP conformational changes. Details of the views are described in Methods. In RP1, the duplex DNA is outside of the RNAP cleft and must traverse through two physical barriers to reach the RNAP active site: 1) the βlobe/GL barrier, and 2) FL2/Sw2. In the first transition, the βlobe/GL and/or the clamp must swing open to allow the DNA to pass. In the second transition, the clamp must open to allow the ss t-strand DNA to pass through the FL2/Sw2 gap to access the RNAP active site.
Thus, we propose that the two final major energetic barriers to RPo formation correspond to steric obstacles along the DNA trajectory that must be relieved by RNAP conformational changes. These barriers could serve as regulation checkpoints to control RNAP active site access. Indeed, the RP1 ↔ RP2 and RP2 ↔ RPo transitions were modulated by the mycobacterial transcription factors CarD and RbpA9, and the transition from RP1 → RPo is a regulated step at some eukaryotic promoters21.
The RNAP structural features, namely FL2 and Sw2, highlighted in this study as key players in the final promoter melting transition, as well as clamp dynamics, are universally conserved features of all cellular RNAPs11,13–15. In this regard, single molecule observations of the yeast RNAP II transcription initiation system support a two-step promoter melting process with an intermediate containing a 6 base-pair bubble22. We thus suggest that the RP2 intermediate observed here, and the RNAP clamp opening that allows the RP2 → RPo transition, are common features of promoter melting and regulation for RNAPs from all three kingdoms of life.
METHODS
Structural biology software was accessed through the SBGrid consortium23.
Protein Expression and Purification.
Mycobacterium tuberculosis RbpA/σA-holoenzyme was purified and assembled as described previously17. M. tuberculosis (Mtb) CarD was overexpressed and purified as previously described for Thermus thermophilus CarD24.
In vitro Transcription Assays.
In vitro abortive initiation transcription assays were performed using a wild-type Mtb AP3 promoter25 template (−87 to +71) at 37°C as described previously17,26. Assays were performed in KCl assay buffer (10 mM Tris-HCl, pH 8.0, 50 mM KCl, 10 mM MgCl2, 0.1 mM EDTA, 0.1 mM DTT, 50 μg/mL BSA). CarD (250 nM) was added at 5X molar excess over RbpA/holoenzyme (50 nM) and incubated for 10 min at 37°C prior to the addition of corallopyronin (Cor) at the indicated concentrations (Extended Data Fig. 1B). Template DNA (10 nM) was added and the samples were incubated for 15 min at 37°C to allow RPo formation. Transcription was initiated by the addition of GpU initiating dinucleotide (250 μM, TriLink Biotechnologies) and α−32P-UTP (15 nM). After 10 min., the reaction was quenched by the addition of 2X stop buffer (8 M urea, 0.5X TBE, 0.05% bromophenol blue, 0.05% xylene cyanol), and transcription products were visualized by polyacrylamide gel electrophoresis using phosphorimagery and quantified using Image J27. The transcription assay (Extended Data Fig. 1B) was performed once to calculate the concentration of Cor to use to obtain the structure. Since the experiment was performed with two batches of enzyme (one prepared with and one prepared without the transcription CarD, which would not affect the inhibition) with a range of concentrations and showed similar IC50 (1 and 2 μM) we considered this duplicated and cautiously used 100 times above the IC50 (100 μM) for cryo-EM sample preparation.
Preparation of Mtb RNAP/σA/CarD/RbpA/Cor Complex for Cryo-EM.
Mtb RNAP/σA/RbpA (0.5 ml of 5 mg/ml) was injected into a Superose 6 Increase column (GE Healthcare) equilibrated with 20 mM Tris-HCl, pH 8.0, 150 mM K-Glutamate, 5 mM MgCl2, and 2.5 mM DTT. The peak fractions of the eluted protein were concentrated by centrifugal filtration (Millipore) to 6 mg/mL protein concentration. CarD was added to 5X molar excess and incubated for 37°C for 10 min. Cor (10 mM stock solution in DMSO) was added to a final concentration of 0.1 mM [final 1% (v/v) DMSO], and DMSO to 1% (v/v) was added to the sample with no Cor, then incubated for 10 min at 37°C. Next, duplex AP3 promoter fragment (−60 to +30, Fig. 1A) was added to a final concentration of 20 μM and the sample incubated for 15 min at 37°C. CHAPSO (3-([3-cholamidopropyl]dimethylammonio)-2-hydroxy-1-propanesulfonate) was then added to a final concentration of 8 mM and sample was kept at room temperature prior to grid preparation.
Cryo-EM grid preparation.
C-flat holey carbon grids (CF-1.2/1.3–4Au) were glow-discharged for 20 s prior to the application of 3.5 μl of the sample (4.0– 6.0 mg/ml protein concentration). After blotting for (3–4.5 s) the grids were plunge-frozen in liquid ethane using an FEI Vitrobot Mark IV (FEI, Hillsboro, OR) with 100% chamber humidity at 22 °C.
Cryo-EM data acquisition and processing
Mtb RNAP/σA/CarD/RbpA/AP3.
The grids were imaged using a 300 keV Titan Krios (FEI) equipped with a K2 Summit direct electron detector (Gatan). Images were recorded with Leginon28 in counting mode with a pixel size of 1.07 Å and a defocus range of 0.8 μm to 1.8 μm. Data were collected with a dose of 8 electrons/px/s. Images were recorded over a 10 second exposure with 0.2 second frames (50 total frames) to give a total dose of 70 electrons/Å2. Dose-fractionated subframes were aligned and summed using MotionCor229 and subsequent dose-weighting was applied to each image. The contrast transfer function was estimated for each summed image using Gctf30. From the summed images, Gautomatch (developed by K. Zhang, MRC Laboratory of Molecular Biology, Cambridge, UK, http://www.mrc-lmb.cam.ac.uk/kzhang/Gautomatch) was used to pick particles with an auto-generated template. A subset of the dataset was used to generate an initial model of the complex in cryoSPARC (ab initio reconstruction)31. Many classification schemes were tested that converged on the conclusion that two major, high-resolution classes were present in the particle dataset. For the final structures, the ab initio model (low-pass filtered to 30 Å-resolution) was used as a template to 3D classify the particles into two classes using cryoSPARC heterogeneous refinement. Two more rounds of classification (into 2 classes) were performed to remove bad particles (low resolution reconstructions that did not resemble RNAP). Then, cryoSPARC homogenous refinement was performed for each resulting class using the class map and corresponding particles, yielding two different structures: RPo and RP2 (Extended Data Fig. 3A). The RPoclass contained 211,381 particles with a nominal resolution of 3.6 Å (Extended Data Fig. 3) while the RP2 class contained 140,333 particles with a nominal resolution of 3.9 Å (Extended Data Figs. 3A, 5).
Mtb RNAP/σA/CarD/RbpA/CarD/AP3/Cor.
The grids were imaged using a 300 keV Titan Krios (FEI) equipped with a K2 Summit direct electron detector (Gatan). Images were recorded with Serial EM32 in super-resolution counting mode with a super-resolution pixel size of 0.65 Å and a defocus range of 0.8 μm to 2.0 μm. Data were collected with a dose of 8 electrons/px/s. Images were recorded over a 15 second exposure using 0.3 second subframes (50 total frames) to give a total dose of 71 electrons/Å2. Dose-fractionated subframes were 2 × 2 binned (giving a pixel size of 1.3 Å), aligned and summed using MotionCor229. The contrast transfer function was estimated for each summed image using Gctf30. From the summed images, Gautomatch (developed by K. Zhang, MRC Laboratory of Molecular Biology, Cambridge, UK, http://www.mrc-lmb.cam.ac.uk/kzhang/Gautomatch) was used to pick particles with an auto-generated template. Autopicked particles were manually inspected. A subset of the dataset was used to generate an initial model of the complex in cryoSPARC (ab initio reconstruction)31. Many classification schemes were tested that converged on the conclusion that one major, high-resolution class was present in the particle dataset. For the final structure, the ab initio model (low-pass filtered to 30 Å-resolution) was used as a template to 3D classify the particles into two classes using cryoSPARC heterogeneous refinement. Two more rounds of classification (into 2 classes) were performed to remove bad particles (low resolution reconstructions that did not resemble RNAP). Then, cryoSPARC homogenous refinement was performed for the best class using the class map and corresponding particles, yielding the Cor-RP2 structure containing 246,409 particles with a nominal resolution of 3.6 Å (Extended Data Figs. 1C, 2).
Mtb RNAP/σA/RbpA/us-fork DNA/Cor.
Grids were imaged on two separate 300 keV Krios microscopes (FEI), both equipped with K2 Summit direct electron detectors (Gatan). Two datasets were recorded with Serial EM32 in super-resolution mode over a defocus range of 0.8 μm to 2.5 μm (Extended Data Table 1). The first dataset was collected at 8 electrons/physical pixel/second with a super-resolution pixel size of 0.65 Å. Images in the first dataset were recorded in dose-fractionation mode with subframes of 0.3 s over a 15 s exposure (50 frames) to give a total dose of 71 electrons/Å2. Dose-fractionated movies were gain-normalized, Fourier binned by 2 (giving a pixel size of 1.3 Å), drifted-corrected, summed, and dose-weighted using MotionCor229. The second dataset was collected at 5 electrons/physical pixel/s with a superresolution pixel size of 0.515 Å. Images in the second dataset were recorded in dose-fractionation mode with subframes of 0.3 s over an exposure of 15 s (50 total frames) to give a total dose of 71 electrons/Å2. Dose-fractionated movies were gain-normalized, scaled to the pixel size of the first dataset using a Fourier binning factor of 2.52 (giving a pixel size of 1.30 Å), drifted-corrected, summed, and dose-weighted using MotionCor229. CTF estimations were calculated for each dataset using Gctf30. Particles were picked using Gautomatch (K. Zhang, http://www.mrc-lmb.cam.ac.uk/kzhang/) without using a 2D template. Picked particles were extracted from the dose-weighted images in RELION34 using a box size of 256 pixels. The first dataset consisting of 2,059 images with 504,577 particles was combined with the second dataset consisting of 2,839 images with 420,432 particles. Particles were subjected to multiple rounds of cryoSPARC31 3D classifications using a cryo-EM map of Mtb RNAP/σA/RbpA (EMD-7322) as a 3D template (Extended Data Fig. 8A). The best class consisted of 222,962 particles with a nominal resolution of 4.38 Å (Extended Data Figs. 8B–C) after homogenous refinement in cryoSPARC31.
The distribution of particle orientations for each class was plotted using cryoSPARC (Extended Data Figs. 2A, 3B, 5A, 8B). FSC calculations were performed in cryoSPARC (Extended Data Figs. 2B, 3C, 5B, 8C) and half-map FSCs (Extended Data Figs. 2C, 3D, 5C) were calculated using EMAN235. Local resolution calculations (Extended Data Figs. 2D, 3E, 5D) were performed using blocres36.
Model building and refinement.
To build initial models of the protein components of the complexes, a model of Mtb RNAP σA/RbpA/us-double-fork structure with the DNA removed (PDB ID 6C04)17 was manually fit into the cryo-EM density maps using Chimera37 and real-space refined using Phenix38. The DNAs were mostly built de novo based on the density map. For real-space refinement, rigid body refinement with fourteen manually-defined mobile domains was followed by all-atom and B-factor refinement with Ramachandran and secondary structure restraints. A model of Cor was generated from a SMILES string and edited in Phenix REEL, and refined into the cryo-EM density. Refined models were inspected and modified in Coot39.
Generation of cartoons in figure 4.
Cartoons were drawn by superimposition unto the pdbs of the RP1 model9, and Rp2 (6EE8) and RPo (6EDT) structures. In the side views, the main body of the RNAP has been cut away at the level of the RNAP active site Mg2+ (yellow sphere) but the full clamp (pink) and nucleic acids are shown. In the cross-sections (viewed from the top), most of the RNAP β subunit has been removed (except for FL2 and the GL in green) to reveal the inside of the RNAP active site cleft.
Extended Data
Extended Data Figure 1 |.
Cor inhibits Mtb RNAP transcription initiation but not promoter DNA binding and data processing pipeline for the cryo-EM movies of Mtb RNAP/σA/CarD/RbpA/Cor/AP3 promoter
A. Chemical structure of corallopyronin A40
B. Abortive transcription initiation assays measuring GpUpU production in the presence of increasing concentrations of Cor. [32P]-labeled abortive transcript production was monitored by polyacrylamide gel electrophoresis and autoradiography. Full gel is shown in supplementary Fig. 1.
C. Flowchart showing the image processing pipeline for the cryo-EM data of Mtb RNAP/σA/CarD/RbpA/Cor/AP3 promoter complexes starting with 3,718 dose-fractionated movies collected on a 300 keV Titan Krios (FEI) equipped with a K2 Summit direct electron detector (Gatan). Movies were frame aligned and summed using MotionCor229. CTF estimation for each micrograph was calculated with Gctf30. A representative micrograph is shown following processing by MotionCor2. Particles were autopicked from each micrograph with Gautomatch and then sorted by 2D classification using RELION34 to assess quality. The twelve highest populated classes from the 2D classification are shown.
After picking, the dataset contained 1,026,386 particles. A subset of particles was used to generate an ab-initio map in cryoSPARC31. Using the low-pass filtered (30 Å) ab initio map as a template, three rounds of 3D heterogeneous refinement were performed using cryoSPARC in a binomial-like fashion. One major, high-resolution class emerged, which was refined using cryoSPARC homogenous refinement and then sharpened for model building.
Extended Data Figure 2 |.
Cryo-EM of Cor-RP2.
A. Angular distribution calculated in cryoSPARC for particle projections. Heat map shows number of particles for each viewing angle (less=blue, more=red).
B. Gold-standard FSC41, calculated by comparing the two independently determined half-maps from cryoSPARC. The dotted line represents the 0.143 FSC cutoff which indicates a nominal resolution of 3.6 Å.
C. FSC calculated between the refined structure and the half map used for refinement (work, red), the other half map (free, blue), and the full map (black).
D. (top) The 3.6 Å-resolution cryo-EM density map of Cor-RP2 is colored according to the key on the right. The right view is a cross-section of the left view revealing the DNA inside the RNAP cleft.
(bottom) Same views as (top) but colored by local resolution36. The boxed region in the right view is magnified on the far right and sliced at the level of the Cor binding pocket. Density for the Cor molecule is outlined in red.
E. (left) Overview of the Cor-RP2 structure, shown as a molecular surface. The boxed region is magnified on the right.
(right) Magnified view of the Cor binding pocket at the same orientation as the boxed region on the left. Proteins are shown as α-carbon backbone worms. Residues that interact with Cor are shown in stick format. Cor is shown in stick format with green carbon atoms. Hydrogen-bonds are indicated by dashed gray lines. The cryo-EM difference density for the Cor is shown (green mesh).
Extended Data Figure 3 |.
Data processing pipeline for the cryo-EM movies of Mtb RNAP/σA/CarD/RbpA/AP3 promoter (RPo, RP2) and cryo-EM of RPo.
A. Flowchart showing the image processing pipeline for the cryo-EM data of Mtb RNAP/σA/CarD/RbpA/AP3 promoter complexes starting with 8,577 dose-fractionated movies collected on a 300 keV Titan Krios (FEI) equipped with a K2 Summit direct electron detector (Gatan). Movies were frame aligned and summed using MotionCor229. CTF estimation for each micrograph was calculated with Gctf30. A representative micrograph is shown following processing by MotionCor2. Particles were auto picked from each micrograph with Gautomatch and then sorted by 2D classification using RELION34 to assess quality. The twelve highest populated classes from the 2D classification are shown.
The dataset contained 931,461 particles. A subset of particles was used to generate an ab-initio map in cryoSPARC31. Using the low-pass filtered (30 Å) ab initio map as a template, two rounds of 3D heterogeneous refinement were performed using cryoSPARC in a binomial-like fashion. Two major classes emerged, which were refined using cryoSPARC homogenous refinement and then sharpened for model building.
B. Angular distribution calculated in cryoSPARC for particle projections. Heat map shows number of particles for each viewing angle (less=blue, more=red).
C. Gold-standard FSC41, calculated by comparing the two independently determined half-maps from cryoSPARC. The dotted line represents the 0.143 FSC cutoff which indicates a nominal resolution of 3.6 Å.
D. FSC calculated between the refined structure and the half map used for refinement (work, red), the other half map (free, blue), and the full map (black).
E. (top) The 3.6 Å-resolution cryo-EM density map of RPo is colored according to the key on the right. The right view is a cross-section of the left view revealing the DNA inside the RNAP cleft.
(bottom) Same views as (top) but colored by local resolution36.
Extended Data Figure 4 |.
Overall DNA path of RPo matches previously determined RPo structures.
Selected RPo structures containing a completely intact transcription bubble42,43 were superimposed with the cryo-EM RPo structure by α-carbons of the structural core module (Extended Data Table 2). The resulting superposition of the nucleic acids is shown. The nucleic acids are shown as phosphate backbone worms, color-coded as shown in the key.
Extended Data Figure 5 |.
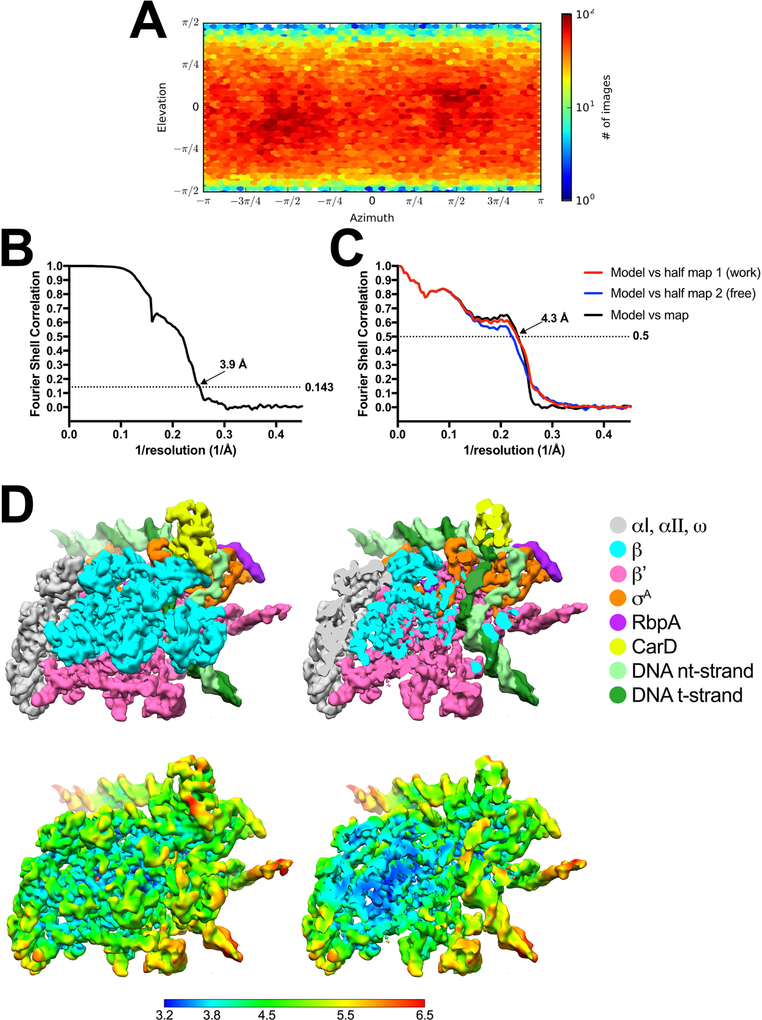
Cryo-EM of RP2 class.
(A) Angular distribution calculated in cryoSPARC for particle projections. Heat map shows number of particles for each viewing angle (less=blue, more=red).
(B) Gold-standard FSC41, calculated by comparing the two independently determined half-maps from cryoSPARC. The dotted line represents the 0.143 FSC cutoff which indicates a nominal resolution of 3.9 Å.
(C) FSC calculated between the refined structure and the half map used for refinement (work, red), the other half map (free, blue), and the full map (black).
(D) (top) The 3.9 Å-resolution cryo-EM density map of RP2 is colored according to the key on the right. The right view is a cross-section of the left view revealing the DNA inside the RNAP cleft.
(bottom) Same views as (top) but colored by local resolution36.
Extended Data Figure 6 |.
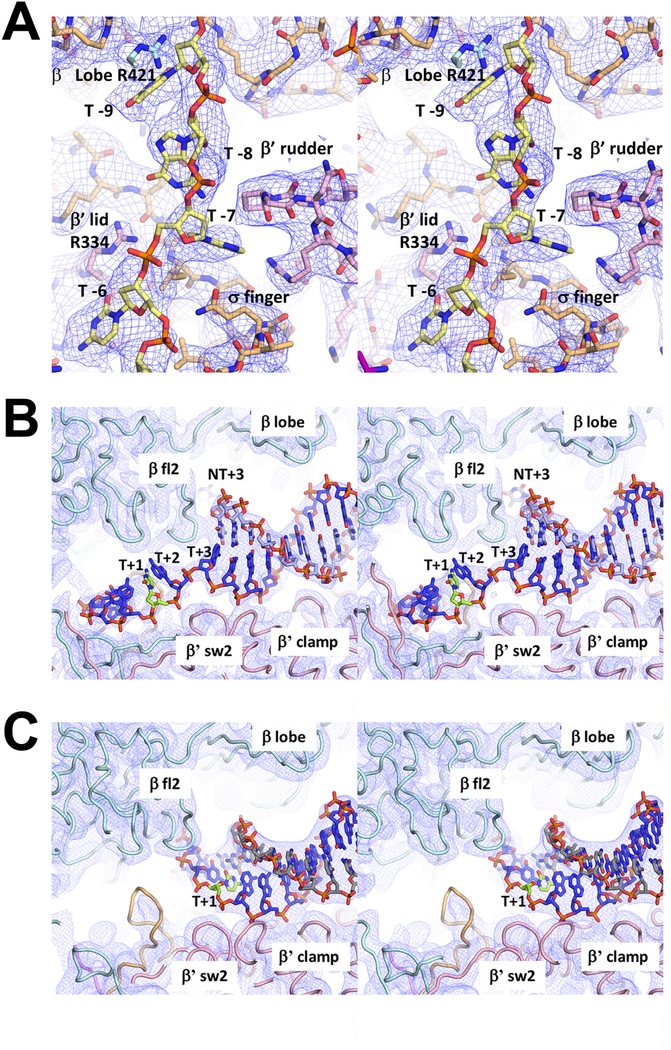
Sample cryo-EM density.
Stereo views of cryo-EM density (blue mesh) and superimposed models.
A. Protein/DNA interactions for t-strand DNA of RPo.
B. Downstream ss/ds fork junction of RPo. The t-strand +1 position (transcription start site, T+1, colored lemon-green) is unpaired and positioned near the RNAP active site Mg2+ (not visible in this view).
C. Same view as (B) but showing cryo-EM density and model for RP2. The T+1 nucleotide (lemon-green) is base paired with the nt-strand and more than 30 Å away from the RNAP active site Mg2+.
Extended Data Figure 7 |.
Downstream duplex DNA helical axes.
The RPo, RP2, and Cor-RP2 structures were superimposed and the nucleic acid backbones are shown (RPo, blue; RP2, green; Cor-RP2, magenta). The helical axes of the downstream duplex DNAs, determined using curves44, are shown as thick colored lines. The RP2 and Cor-RP2 downstream duplexes are tilted about 35° with respect to RPo.
Extended Data Figure 8 |.
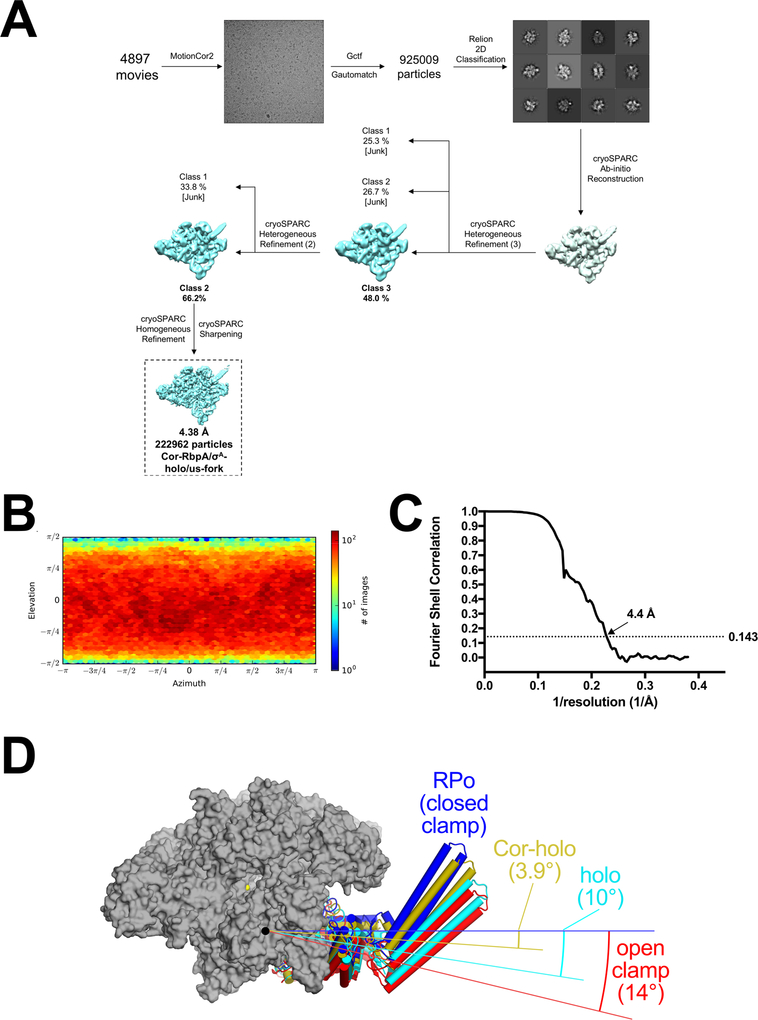
Cryo-EM of Mtb RNAP/σA/RbpA/Cor/us-fork.
A. Flowchart showing the image processing pipeline for the cryo-EM data of Mtb RNAP/σA/RbpA/Cor/us-fork complexes starting with 4,897 dose-fractionated movies collected on a 300 keV Titan Krios (FEI) equipped with a K2 Summit direct electron detector (Gatan). Movies were frame aligned and summed using MotionCor229. CTF estimation for each micrograph was calculated with Gctf30. A representative micrograph is shown following processing by MotionCor2. Particles were autopicked from each micrograph with Gautomatch and then sorted by 2D classification using RELION34 to assess quality. The twelve highest populated classes from the 2D classification are shown.
The dataset contained 925,009 particles. A subset of particles was used to generate an ab-initio map in cryoSPARC31. Using the low-pass filtered (30 Å) ab initio map as a template, two rounds of 3D heterogeneous refinement were performed using cryoSPARC in a binomial-like fashion. One major class emerged, which was refined using cryoSPARC homogenous refinement and then sharpened for model building.
B. Angular distribution calculated in cryoSPARC for particle projections. Heat map shows number of particles for each viewing angle (less=blue, more=red).
C. Gold-standard FSC41, calculated by comparing the two independently determined half-maps from cryoSPARC. The dotted line represents the 0.143 FSC cutoff which indicates a nominal resolution of 4.4 Å.
D. RNAP clamp conformations. The RPo structure (Fig. 1C) was used as a reference to superimpose other structures via α-carbon atoms of the structural core module (table S2), revealing a common core RNAP structure (gray molecular surface) but with shifts in the clamp modules. The clamp modules are shown as backbone cartoons with cylindrical helices (RPo, blue; Cor-RbpA/holo, olive; RbpA/holo (6C05), cyan; open clamp (6BZO), red). The angles of clamp opening are shown (relative to RPo at 0°).
Extended Data Table 1 |.
Cryo-EM data collection, refinement and validation statistics
| Cor-RP2 (EMDB-9041) (PDB 6EEC) |
RPo (EMDB-9037) (PDB 6EDT) |
RP2 (EMDB-9039) (PDB 6EE8) |
Cor-RbpA/σA-holo (EMDB-9047) (PDB6M7J) |
||
|---|---|---|---|---|---|
| Data collection and processing | Dataset1 | Dataset2 | |||
| Magnification | 22,500 | 22,500 | 22,500 | 29,000 | |
| Voltage (kV) | 300 | 300 | 300 | 300 | |
| Electron exposure (e-/Å2) | 71 | 70 | 71 | 71 | |
| Defocus range (μm) | 0.8 – 2.0 | 0.8 – 1.8 | 0.8 – 2.5 | 0.8 – 2.5 | |
| Pixel size (Å) | 1.3 | 1.07 | 1.3 | 1.1 | |
| Symmetry imposed | C1 | C1 | C1 | ||
| Initial particle images (no.) | 1,026,386 | 931,461 | 925,009 | ||
| Final particle images (no.) | 246,409 | 211,381 | 140,333 | 222,962 | |
| Map resolution (Å) FSC threshold 0.143 | 3.6 | 3.6 | 3.9 | 4.4 | |
| Map resolution range (Å) | 3.1 −7 | 2.8–6.5 | 3.2–6.5 | 3.6–8 | |
| Refinement | |||||
| Initial model used (PDB code) | 6C04 | 6C04 | 6C04 | 6C04 | |
| Model resolution (Å) FSC threshold 0.5 | 4.0 | 3.9 | 4.3 | 4.4 | |
| Model resolution range (Å) | 3.1 −7 | 2.8–6.5 | 3.2–6.5 | 3.6–8 | |
| Map sharpening B factor (Å2) | 141.1 | 137.7 | 132.6 | 198.3 | |
| Model composition | |||||
| Non-hydrogen atoms | 29,894 | 29,983 | 29,782 | 27,183 | |
| Protein residues | 3,508 | 3,516 | 3,508 | 3,349 | |
| Nucleic acid residues | 128 | 130 | 125 | 57 | |
| Ligands | 4 (Cor, 1 Mg2+, 2 Zn2+) | 3 (1 Mg2+, 2 Zn2+) | 3 (1 Mg2+, 2 Zn2+) | 4 (Cor, 1 Mg2+, 2 Zn2+) | |
| B factors (Å2) | |||||
| Protein | 92.07 | 111.72 | 171.82 | 213.46 | |
| Nucleic acid | 190.41 | 195.96 | 256.07 | 302.55 | |
| Ligands | 68.39 | 115.81 | 209.48 | 74.04 | |
| R.m.s. deviations | |||||
| Bond lengths (Å) | 0.009 | 0.009 | 0.007 | 0.008 | |
| Bond angles (°) | 0.861 | 1.07 | 0.948 | 1.063 | |
| Validation | |||||
| MolProbity score | 2.10 | 1.80 | 1.79 | 2.45 | |
| Clashscore | 9.82 | 5.74 | 6.46 | 21.86 | |
| Poor rotamers (%) | 0 | 0.51 | 0.48 | 0.03 | |
| Ramachandran plota | |||||
| Favored (%) | 99.8 | 99.8 | 99.7 | 99.5 | |
| Allowed (%) | 0.2 | 0.2 | 0.3 | 0.5 | |
| Disallowed (%) | 0 | 0 | 0 | 0 | |
Ramachandran plot parameters from PROCHECK45
Extended Data Table 2 |.
Structural superpositions.
| Structural core modulea | |||
| subunit | Mtb RNAP residues | Thermus aquaticus residues | |
| αI, αII, ω | complete | complete | |
| β | 1–53; 177–182; 370–380; 445–639; 705–747; 879–1116 | 1–18; 138–143; 325–335; 400–592; 658–700; 833–1080 | |
| β’ | 414–443; 496–863; 1246–1282 | 615–644; 700–1084; 1460–1488 | |
| alignmentsb | |||
| Rmsd (Å) | # of Cα’s | ||
| Taq RPo (4XLN-A) ➔ Mtb RPo | 1.226 | 1147 | |
| Taq RPo (4XLN-B) ➔ Mtb RPo | 1.226 | 1147 | |
| Taq CarD-RPo (4XLR-B) ➔ Mtb RPo | 1.338 | 1150 | |
| Mtb Cor-RP2 ➔ Mtb RPo | 0.475 | 1390 | |
| Mtb Cor-RbpA/σA-holo ➔ Mtb RPo | 0.619 | 1399 | |
| Mtb RP2 ➔ Mtb RPo | 0.342 | 1326 | |
| Mtb RbpA/σA-holo (6C05) ➔ Mtb RPo | 0.825 | 1397 | |
| Mtb Fdx-RbpA/σA-holo (6BZO) ➔ Mtb RPo | 0.566 | 1363 | |
The structural core module comprises the α subunits, the ω subunit, and conserved β and β’ regions around the RNAP active center that have not been observed to undergo significant conformational changes.
Alignments performs using the PyMOL ‘align’ command.
Supplementary Material
Acknowledgments
We thank M. Ebrahim and J. Sotiris at The Rockefeller University Evelyn Gruss Lipper Cryo-electron Microscopy Resource Center and E. Eng at the New York Structural Biology Center for help with cryo-EM data collection. We also thank A. Feklistov, M. Lilic, R. Saecker, and other members of the Darst/Campbell laboratory, as well as R. Landick, for helpful discussion on the manuscript. Some of the work reported here was conducted at the Simons Electron Microscopy Center and the National Resource for Automated Molecular Microscopy located at the New York Structural Biology Center, supported by grants from the NIH National Institute of General Medical Sciences (GM103310), NYSTAR, and the Simons Foundation (349247). This work was supported by NIH grants R35 GM118130 to S.A.D. and R01 GM114450 to E.A.C.
Footnotes
Data availability
The cryo-EM density maps have been deposited in the EMDataBank under accession codes EMD-9041 (Cor-RP2), EMD-9037 (RPo), EMD-9039 (RP2), and EMD-9047 (Cor-holo). The atomic coordinates have been deposited in the Protein Data Bank under accession codes 6EEC (Cor-RP2), 6EDT (RPo), 6EE8 (RP2), and 6M7J (Cor-holo).
Competing interests The authors declare there are no competing interests.
References
- 1.Browning DF & Busby SJW Local and global regulation of transcription initiation in bacteria. Nat. Rev. Micro 14, 638–650 (2016). [DOI] [PubMed] [Google Scholar]
- 2.Nogales E, Louder RK & He Y Structural Insights into the Eukaryotic Transcription Initiation Machinery. Annu. Rev. Biophys 46, 59–83 (2017). [DOI] [PMC free article] [PubMed] [Google Scholar]
- 3.Plaschka C et al. Transcription initiation complex structures elucidate DNA opening. Nature 533, 353–358 (2016). [DOI] [PubMed] [Google Scholar]
- 4.Buc H & McClure WR Kinetics of open complex formation between Escherichia coli RNA polymerase and the lac UV5 promoter. Evidence for a sequential mechanism involving three steps. Biochemistry 24, 2712–2723 (1985). [DOI] [PubMed] [Google Scholar]
- 5.Roe JH, Burgess RR & Record MT Jr. Kinetics and mechanism of the interaction of Escherichia coli RNA polymerase with the lambda PR promoter. J. Mol. Biol 176, 495–522 (1984). [DOI] [PubMed] [Google Scholar]
- 6.Saecker RM, Record MT Jr & deHaseth PL Mechanism of Bacterial Transcription Initiation: RNA Polymerase - Promoter Binding, Isomerization to Initiation-Competent Open Complexes, and Initiation of RNA Synthesis. J. Mol. Biol 412, 754–771 (2011). [DOI] [PMC free article] [PubMed] [Google Scholar]
- 7.Belogurov GA et al. Transcription inactivation through local refolding of the RNA polymerase structure. Nature 457, 332–335 (2008). [DOI] [PMC free article] [PubMed] [Google Scholar]
- 8.Mukhopadhyay J et al. The RNA Polymerase ‘Switch Region’ Is a Target for Inhibitors. Cell 135, 295–307 (2008). [DOI] [PMC free article] [PubMed] [Google Scholar]
- 9.Hubin EA et al. Structure and function of the mycobacterial transcription initiation complex with the essential regulator RbpA. eLife 6, e22520 (2017). [DOI] [PMC free article] [PubMed] [Google Scholar]
- 10.Hubin EA, Lilic M, Darst SA & Campbell EA Structural insights into the mycobacteria transcription initiation complex from analysis of X-ray crystal structures. Nat. Comm 8, 16072 (2017). [DOI] [PMC free article] [PubMed] [Google Scholar]
- 11.Lane WJ & Darst SA Molecular Evolution of Multisubunit RNA Polymerases: Structural Analysis. J. Mol. Biol 395, 686–704 (2010). [DOI] [PMC free article] [PubMed] [Google Scholar]
- 12.Stallings CL et al. CarD Is an Essential Regulator of rRNA Transcription Required for Mycobacterium tuberculosis Persistence. Cell 138, 146–159 (2009). [DOI] [PMC free article] [PubMed] [Google Scholar]
- 13.Feklistov A et al. RNA polymerase motions during promoter melting. Science 356, 863–866 (2017). [DOI] [PMC free article] [PubMed] [Google Scholar]
- 14.Schulz S et al. TFE and Spt4/5 open and close the RNA polymerase clamp during the transcription cycle. Proc. Natl. Acad. Sci 113, E1816–25 (2016). [DOI] [PMC free article] [PubMed] [Google Scholar]
- 15.He Y, Fang J, Taatjes DJ & Nogales E Structural visualization of key steps in human transcription initiation. Nature 495, 481–486 (2013). [DOI] [PMC free article] [PubMed] [Google Scholar]
- 16.Chakraborty A et al. Opening and Closing of the Bacterial RNA Polymerase Clamp. Science 337, 591–595 (2012). [DOI] [PMC free article] [PubMed] [Google Scholar]
- 17.Boyaci H et al. Fidaxomicin jams Mycobacterium tuberculosis RNA polymerase motions needed for initiation via RbpA contacts. eLife 7, e34823 (2018). [DOI] [PMC free article] [PubMed] [Google Scholar]
- 18.Zhou YN & Jin DJ The rpoB mutants destabilizing initiation complexes at stringently controlled promoters behave like ‘stringent’ RNA polymerases in Escherichia coli. Proc. Natl. Acad. Sci 95, 2908–2913 (1998). [DOI] [PMC free article] [PubMed] [Google Scholar]
- 19.Trautinger BW & Lloyd RG Modulation of DNA repair by mutations flanking the DNA channel through RNA polymerase. The EMBO Journal 21, 6944–6953 (2002). [DOI] [PMC free article] [PubMed] [Google Scholar]
- 20.Vassylyev DG et al. Crystal structure of a bacterial RNA polymerase holoenzyme at2.6 Å resolution. Nature 417, 712–719 (2002). [DOI] [PubMed] [Google Scholar]
- 21.Kouzine F et al. Global regulation of promoter melting in naive lymphocytes. Cell 153, 988–999 (2013). [DOI] [PMC free article] [PubMed] [Google Scholar]
- 22.Tomko EJ, Fishburn J, Hahn S & Galburt EA TFIIH generates a six-base-pair open complex during RNAP II transcription initiation and start-site scanning. Nature Structural & Molecular Biology 24, 1139–1145 (2017). [DOI] [PMC free article] [PubMed] [Google Scholar]
References
- 23.Morin A et al. Collaboration gets the most out of software. eLife 2, e01456 (2013). [DOI] [PMC free article] [PubMed] [Google Scholar]
- 24.Srivastava DB et al. Structure and function of CarD, an essential mycobacterial transcription factor. Proc. Natl. Acad. Sci 110, 12619–12624 (2013). [DOI] [PMC free article] [PubMed] [Google Scholar]
- 25.Gonzalez-y-Merchand JA, Colston MJ & Cox RA The rRNA operons of Mycobacterium smegmatis and Mycobacterium tuberculosis: comparison of promoter elements and of neighbouring upstream genes. Microbiology (Reading, Engl.) 142 (Pt 3), 667–674 (1996). [DOI] [PubMed] [Google Scholar]
- 26.Davis E, Chen J, Leon K, Darst SA & Campbell EA Mycobacterial RNA polymerase forms unstable open promoter complexes that are stabilized by CarD. Nucl. Acids. Res 43, 433–445 (2015). [DOI] [PMC free article] [PubMed] [Google Scholar]
- 27.Schneider CA, Rasband WS & Eliceiri KW NIH Image to ImageJ: 25 years of image analysis. Nat. Methods 9, 671–675 (2012). [DOI] [PMC free article] [PubMed] [Google Scholar]
- 28.Nicholson WV, White H & Trinick J An approach to automated acquisition of cryoEM images from lacey carbon grids. J. Struct. Biol 172, 395–399 (2010). [DOI] [PMC free article] [PubMed] [Google Scholar]
- 29.Zheng SQ et al. MotionCor2: anisotropic correction of beam-induced motion for improved cryo-electron microscopy. Nat. Methods 14, 331–332 (2017). [DOI] [PMC free article] [PubMed] [Google Scholar]
- 30.Zhang K Gctf: Real-time CTF determination and correction. J. Struct. Biol 193, 1–12 (2016). [DOI] [PMC free article] [PubMed] [Google Scholar]
- 31.Punjani A, Rubinstein JL, Fleet DJ & Brubaker MA cryoSPARC: algorithms for rapid unsupervised cryo-EM structure determination. Nat. Methods (2017). doi: 10.1038/nmeth.4169 [DOI] [PubMed] [Google Scholar]
- 32.Mastronarde DN Automated electron microscope tomography using robust prediction of specimen movements. J. Struct. Biol 152, 36–51 (2005). [DOI] [PubMed] [Google Scholar]
- 33.Grant T & Grigorieff N Measuring the optimal exposure for single particle cryo-EM using a 2.6 Å reconstruction of rotavirus VP6. eLife 4, e06980 (2015). [DOI] [PMC free article] [PubMed] [Google Scholar]
- 34.Scheres SHW RELION: implementation of a Bayesian approach to cryo-EM structure determination. J. Struct. Biol 180, 519–530 (2012). [DOI] [PMC free article] [PubMed] [Google Scholar]
- 35.Tang G et al. EMAN2: an extensible image processing suite for electron microscopy. J. Struct. Biol 157, 38–46 (2007). [DOI] [PubMed] [Google Scholar]
- 36.Cardone G, Heymann JB & Steven AC One number does not fit all: mapping local variations in resolution in cryo-EM reconstructions. J. Struct. Biol 184, 226–236 (2013). [DOI] [PMC free article] [PubMed] [Google Scholar]
- 37.Pettersen EF et al. UCSF Chimera--a visualization system for exploratory research and analysis. J, Comput. Chem 25, 1605–1612 (2004). [DOI] [PubMed] [Google Scholar]
- 38.Adams PD et al. PHENIX: a comprehensive Python-based system for macromolecular structure solution. Act.a Crystallogr. D Biol. Crystallog.r 66, 213–221 (2010). [DOI] [PMC free article] [PubMed] [Google Scholar]
- 39.Emsley P & Cowtan K Coot: model-building tools for molecular graphics. Acta. Crystallogr. D Biol. Crystallogr 60, 2126–2132 (2004). [DOI] [PubMed] [Google Scholar]
- 40.Irschik H, Jansen R, Höfle G, Gerth K & Reichenbach H The corallopyronins, new inhibitors of bacterial RNA synthesis from Myxobacteria. J. Antibiot 38, 145–152 (1985). [DOI] [PubMed] [Google Scholar]
- 41.Rosenthal PB & Henderson R Optimal Determination of Particle Orientation, Absolute Hand, and Contrast Loss in Single-particle Electron Cryomicroscopy. J. Mol. Biol 333, 721–745 (2003). [DOI] [PubMed] [Google Scholar]
- 42.Bae B, Feklistov A, Lass-Napiorkowska A, Landick R & Darst SA Structure of a bacterial RNA polymerase holoenzyme open promoter complex. eLife 4, e08504 (2015). [DOI] [PMC free article] [PubMed] [Google Scholar]
- 43.Bae B et al. CarD uses a minor groove wedge mechanism to stabilize the RNA polymerase open promoter complex. eLife 4, e08505 (2015). [DOI] [PMC free article] [PubMed] [Google Scholar]
- 44.Lavery R & Sklenar H Defining the structure of irregular nucleic acids: conventions and principles. J. Biomol. Struct. Dyn 6, 655–667 (1989). [DOI] [PubMed] [Google Scholar]
- 45.Laskowski RA, MacArthur MW, Moss DS, Thornton JM IUCr. PROCHECK: a program to check the stereochemical quality of protein structures. J. Appl. Crystallogr 26, 283–291 (1993). [Google Scholar]
Associated Data
This section collects any data citations, data availability statements, or supplementary materials included in this article.


