

Abstract
Duchenne muscular dystrophy is a deadly muscle-wasting disorder caused by loss of dystrophin protein. Studies suggest that metabolic alterations are important to disease pathogenesis. Because muscle accounts for ~40% of body mass, we hypothesized that dystrophy-mediated metabolic changes would be measurable in biofluids and that a metabolomic analysis of urine would provide insight into the metabolic status of dystrophic muscle. Using the mdx mouse model, we performed a large-scale metabolomic screen at 1 and 3 months. While 10% of metabolites were altered at age 1 month, 40% were changed at 3 months. Principal component analysis distinguished wild-type from mdx animals, with the greatest separation at 3 months. A critical distinguishing pathway was Krebs cycle metabolite depletion in mdx urine. Five of seven detected Krebs cycle metabolites were depleted in mdx urine, with succinate being the most robustly affected metabolite. Using selected reaction monitoring mass spectrometry, we demonstrated that muscle-specific dystrophin expression corrects mdx succinate depletion. When subjected to downhill treadmill running, wild-type and mdx mice expressing recombinant dystrophin in skeletal muscle displayed significant increases in urinary succinate levels. However, mdx succinate levels were unchanged, suggesting urinary succinate depletion may reflect an inability to upregulate the Krebs cycle following exercise. Finally, we show that supplementing the Krebs cycle in an ex vivo fatigue/recovery assay significantly impacts mdx muscle performance but has no effect on wild-type muscle. Our results suggest that global metabolic impairment is associated with mdx disease progression and that Krebs cycle deficiencies are a downstream consequence of dystrophin loss.
Introduction
Duchenne muscular dystrophy (DMD) is a deadly muscle-wasting disorder that affects approximately 1 in every 5000 newborn males (1). Over the course of the disease, patients lose ambulation in their early teens and eventually succumb to respiratory or cardiac failure in their late twenties. While corticosteroids and ventilator support are available palliative measures (2,3), there remain limited treatment strategies for patients.
DMD is caused by mutations that abolish expression or function of the 427 kDa protein dystrophin (4). Dystrophin localizes to subsarcolemmal protein complexes called costameres where, via interactions with cortical actin filaments and the dystrophin glycoprotein complex, it links the intracellular cytoskeleton to the extracellular matrix (5,6). These interactions are critical for the maintenance of sarcolemmal integrity during muscle contraction. Increased sarcolemmal fragility in dystrophin-deficient muscles leads to an influx of calcium and other small molecules, which negatively impacts cellular homeostasis (7). In addition to its role in structural integrity of the sarcolemma, dystrophin is also involved in signal transduction via its interaction with the enzyme neuronal nitric oxide synthase (nNOS) (8). During muscle contraction, nNOS produces nitric oxide (NO) that stimulates vasodilation and increased blood flow in response to exercise. In the absence of dystrophin, nNOS fails to properly localize (8) resulting in a loss of contraction-induced vasodilation (9). Recently, an additional role of dystrophin has been described in the regulation of the subsarcolemmal microtubule network (10–12). While the full consequences of the dystrophin/microtubule interaction remain to be determined, it appears that disruption may be involved in sensitivity to eccentric contractions (11,13), increased reactive oxygen species and aberrant calcium regulation (7,14).
One downstream consequence of dystrophin loss is mitochondrial dysfunction. Various mitochondrial abnormalities have been reported in dystrophin-deficient tissue including decreased adenosine triphosphate (ATP) synthesis (15), increased permeability transition pore opening (16), perturbed localization (15) and defective oxidative phosphorylation (17). Studies of mitochondrial metabolism in dystrophic tissue have uncovered significant metabolic perturbations including altered substrate utilization shifting from long chain fatty acids to carbohydrates (18) and decreased activity of various enzyme (17). Additionally, methods to increase mitochondrial biogenesis have been described to have ameliorative effects on the dystrophic phenotype (19). Overall, the current literature points to impairment of mitochondrial function as a significant downstream consequence of dystrophin loss.
To better understand the systemic metabolic consequences of dystrophin deficiency, we performed a mass-spectrometric metabolomic screen of wild-type mice and a mouse model of DMD (mdx). Most notably, almost all metabolites of the Krebs cycle were significantly depleted from urine of 3-month-old mdx mice. Using a selected reaction monitoring (SRM) mass spectrometric assay, we demonstrate that succinate is depleted in quadriceps and heart of mdx mice while urinary succinate levels are normalized in transgenic mdx mice expressing nearly full-length recombinant dystrophin (mdx/D71–78). We also demonstrate that moderate treadmill exercise induced significant increases in urinary succinate in wild-type and mdx/D71–78 mice, but not in mdx mice, suggesting that Krebs cycle depletion is due to decreased flux through the Krebs cycle in response to exercise in mdx mice. Finally, we show that α-ketoglutarate (AKG) increased fatigue resistance in isolated mdx extensor digitorum longus (EDL) muscle and expedited fatigue recovery. Our data demonstrate that urinary metabolites report on altered skeletal muscle Krebs cycle metabolism in the dystrophic mdx mouse model.
Results
Disease progression in the mdx model is such that muscle degeneration is relatively mild at 1 month of age and reaches its peak by 3 months of age (20). Therefore, we analyzed urine from mdx mice at both 1- and 3-month time points using a mass spectrometry (MS)-based metabolomic screen employing both gas chromatography and high-performance liquid chromatography. Of 319 metabolites identified, 225 were measured in all samples and used for further analysis (Supplementary Material, Table SS1). To account for potential differences in total urine concentration, each metabolite was normalized to urinary creatinine. In the 1-month cohort, 18 metabolites (8%) were reduced in mdx urine, whereas 5 (2%) were elevated (Fig. 1A). However, in the 3-month cohort, 64 metabolites (28%) were reduced in mdx urine, whereas 24 (11%) were elevated (Fig. 1B), suggesting that disease progression is correlated with increased metabolic perturbations.
Figure 1.
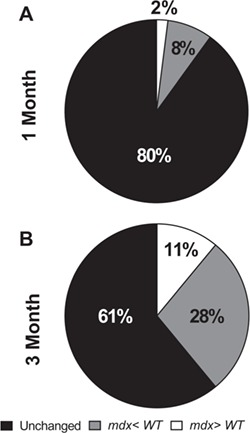
Urinary metabolite comparison between wild-type and mdx mice. (A) Comparison of urinary metabolites between wild-type and mdx mice at 1 month and (B) 3 months of age. N = 10/genotype/age.
We next compared our dataset with previously published metabolic perturbations associated with the mdx mouse model. It is well established that sarcolemmal fragility in the mdx mouse and DMD patients leads to increased serum creatine kinase levels (21). Intriguingly, elevated creatine:creatinine in mdx mice and DMD patient serum was recently reported (22). In agreement with these reports, we observed increased urinary creatine levels in the 3-month mdx cohort (Fig. 2A; P = 0.004). Several groups have also reported increased taurine and decreased lactate concentrations in mdx muscle, but these changes do not appear to be recapitulated in mdx urine (Fig. 2B and C). Additionally, previously described alterations in urinary and plasma dimethylarginine (ADMA) and glutamate levels (23) were measured, but changes were not detected in mdx urine (Fig. 2D and E ). Finally, increases in leucine and isoleucine have been previously reported in the mdx central nervous system (CNS) and muscle tissues (24). Indeed, mdx urine appears to contain elevated levels of all three of the branched chain amino acids (BCAAs) at the 3-month time point (Fig. 2F–H; P ≤ 0.003). Collectively, we also found an age effect for creatine, taurine, lactate, ADMA, glutamate and isoleucine (P ≤ 0.05).
Figure 2.
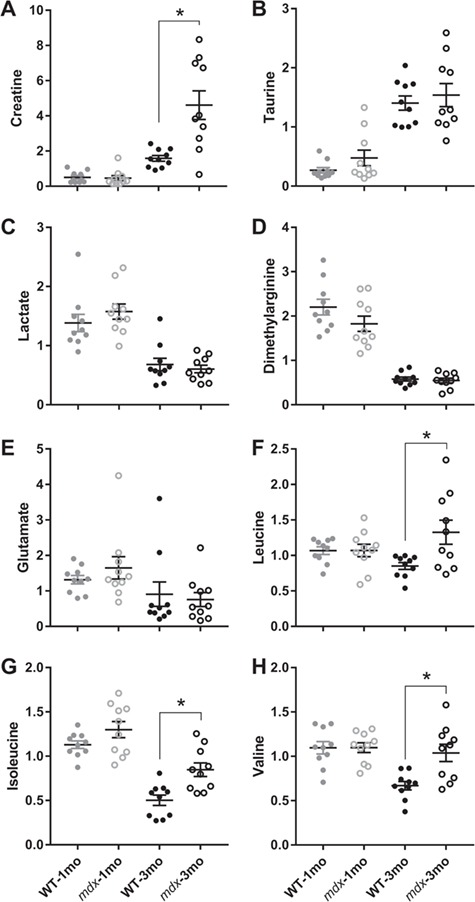
Creatine and BCAAs are elevated in the urine of 3-month-old mdx mice. (A) Urinary creatinine (B) taurine, (C) lactate, (D) ADMA, (E) glutamate, (F) leucine, (G) isoleucine and (H) valine comparison between 1- and 3-month-old wild-type and mdx mice. N = 10/genotype/age. A two-way analysis of variance (ANOVA) was used to test the effect of age and genotype. Data are presented as mean ± SEM. *P < 0.05.
To determine which metabolic changes were critical in distinguishing mdx and wild-type groups, we performed principal component analysis (PCA). PCA segregated the groups by both age and genotype. Importantly, the segregation of wild-type and mdx animals is more prominent at the 3-month time point (Fig. 3A). Specific metabolites most important to the segregation of groups were identified in the PCA loadings plot, with the metabolites most impacting the plotted location of any given sample located near the edge of either axis. For example, creatine (most significantly increased in the 3-month cohort) and 2-hydroxyglutarate (most significantly decreased in the 1-month cohort) were two of the most peripheral metabolites along the principal component 2 axis (Fig. 3B). Additionally, N-glycolylneuramate (elevated concentration in mdx) and desaminotyrosine (reduced concentration in mdx) were two of the metabolites that most significantly impacted segregation by genotype (Fig. 3B).
Figure 3.
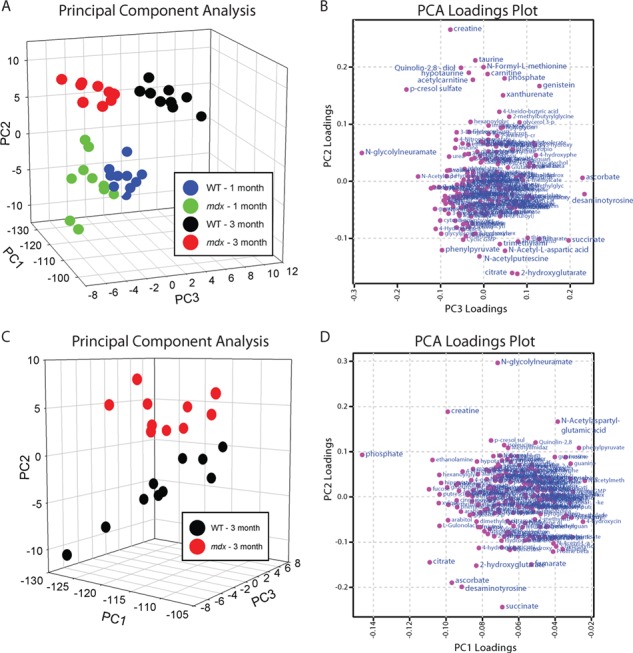
PCA of urine from wild-type and mdx mice. (A) PCA and (B) PCA loadings plot from 1- and 3-month-old wild-type and mdx mice. (C) PCA and (D) PCA loadings plot from 3-month-old wild-type and mdx mice only. N = 10/genotype/age. Data are presented as mean ± SEM. *P < 0.05.
As metabolic disruption was more prominent in the 3-month-old mice, we performed a PCA limited to the 3-month samples to identify metabolic changes that best segregate mdx from wild-type (Fig. 3C). The genotypes are best segregated along the principal component 2 axis. Based on the PCA loadings plot, N-glycolylneuramate, creatine and N-acetylaspartylglutamic acid are all elevated in mdx urine and important in separating the two groups. Additionally, succinate, desaminotyrosine, ascorbate, 2-hydroxyglutarate, fumarate and citrate are all reduced in mdx urine and involved in separation by genotype (Fig. 3D). Because three of the mdx-depleted metabolites identified by PCA are involved in the Krebs cycle, we analyzed all Krebs cycle metabolites measured in the screen by MS. While we did not measure any difference at 1 month of age between wild-type and mdx mice for any Krebs cycle metabolite (Supplementary Material, Fig. S1; P ≥ 0.069), citrate, cis-aconitate, AKG, succinate and malate were all significantly depleted in mdx urine at 3 months of age (Fig. 4A–C, E and G; P ≤ 0.014). Isocitrate and fumarate were the only Krebs cycle metabolites not significantly different (Fig. 4D and F). There was also a main effect for age with all Krebs metabolites except cis-aconitate in wild-type and mdx mice becoming lower at 3 months of age (P < 0.001).
Figure 4.
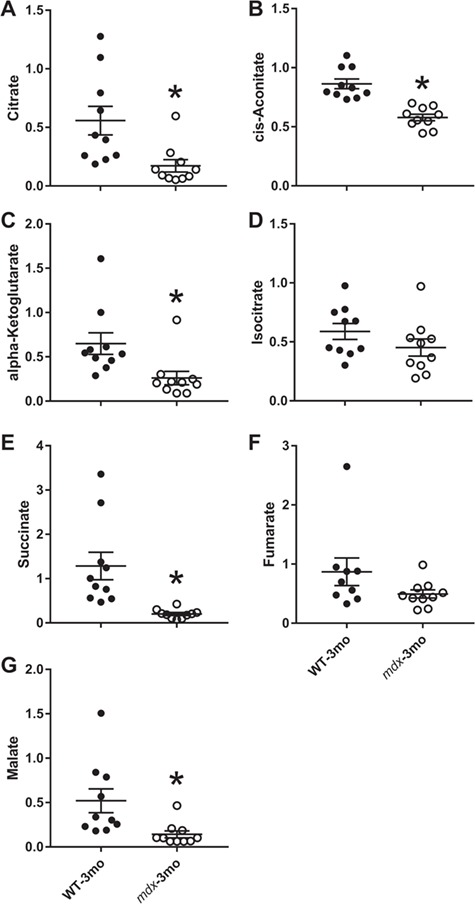
Krebs cycle metabolites are lower in the urine of 3-month-old mdx mice. (A) Urinary citrate, (B) cis-aconitate, (C) AKG, (D) isocitrate, (E) succinate, (F) fumarate and (G) malate from 3-month-old wild-type and mdx mice. N = 10/genotype/age. A Student’s t-test was used to determine differences between wild-type and mdx mice, and data are presented as mean ± SEM. *P < 0.05.
Based on the 6.4-fold decrease in succinate levels in mdx urine compared to wild-type (Fig. 4E), we developed an SRM mass spectrometric assay to measure succinate in urine and other tissues (Fig. 5A and B). In a separate cohort of 3-month animals, succinate is significantly depleted in urine (Fig. 5CP = 0.035). Additionally, we measured succinate levels in tissues harvested from mdx and wild-type mice and found that succinate was depleted in quadriceps muscle and the heart, but not in the brain, kidney, lung or liver (Fig. 5D; P ≤ 0.030). To test whether urinary succinate depletion is corrected by expression of recombinant dystrophin in skeletal muscle, we also measured succinate in wild-type, mdx and mdx/D71–78 animals that express a nearly full-length (missing the C-terminus encoded by exons 71–78) dystrophin transgene under the human skeletal alpha-actin promoter (25). While succinate levels were significantly lower in mdx than wild-type mice, levels were restored to those of wild-type in mdx/D71–78 mice (Fig. 6A).
Figure 5.

Succinate is low in some but not all tissues of mdx mice. (A) Representative urinary succinate single-reaction monitoring tracing from a wild-type and (B) mdx mouse. (C) Urinary succinate and (D) succinate concentrations in several tissues from wild-type and mdx mice at 3 months of age. N ≥ 5/genotype/tissue. A Student’s t-test was used to determine differences between wild-type and mdx mice, and data are presented as mean ± SEM. *P < 0.05.
Figure 6.
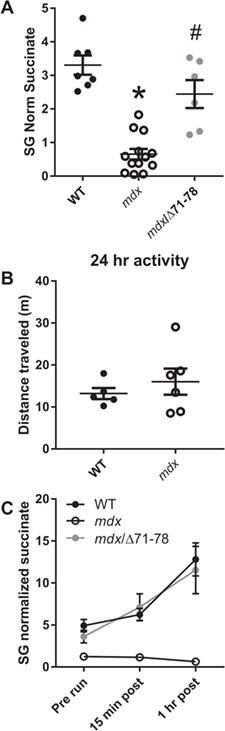
Skeletal muscle-specific dystrophin expression rescues urinary succinate concentrations in mdx mice. (A) Urinary succinate concentrations in wild-type, mdx and mdx/Δ71–78. (B) Distance travelled in 24 h in wild-type and mdx mice within their home cage. (C) Urinary succinate concentrations in response to forced downhill treadmill exercise. N ≥ 5/genotype/age. A one-way ANOVA was used to test differences in urinary succinate between genotypes for urinary succinate and at rest and after exercise while a Student’s t-test analyzed differences between home cage activity. Data are presented as mean ± SEM. *P < 0.05; different from wild-type; #P < 0.05; different from mdx.
Previous studies have linked plasma and urine concentrations of Krebs cycle metabolites to physical activity levels (22). Additionally, cage activity of mdx animals, as measured by voluntary wheel running, has been shown to be decreased compared to wild-type (26). To test whether depleted Krebs cycle metabolites may be due to low physical activity, we measured the total distance travelled by 3-month-old mdx animals in their home cages. No difference was detected in home cage activity between mdx and wild-type animals, suggesting that Krebs cycle depletion is not due to diminished overall activity (Fig. 6B; P = 0.459). We further examined the relationship between physical activity and urinary succinate concentrations by subjecting 3-month-old wild-type, mdx and mdx/D71–78 mice to a moderate downhill treadmill exercise protocol. Wild-type urinary succinate concentrations were elevated over baseline at 15 min and 1 h post exercise. However, mdx urinary succinate concentrations did not change following exercise. Expression of recombinant dystrophin in skeletal muscle was sufficient to correct the loss of exercise-induced succinate increase in mdx mice (Fig. 6C). Taken together, these data suggest that it is not a loss of activity that leads to reduced urinary succinate in mdx animals, but rather a diminished ability to increase flux through the Krebs cycle that leads to global depletion of Krebs metabolites.
Because urinary Krebs cycle metabolites following isocitrate in the Krebs cycle were lower in mdx compared to wild-type animals (Fig. 4), we hypothesized that this may affect skeletal muscle energy production and affect physiological function. We performed an ex vivo fatiguing protocol on isolated EDL muscle in the presence or absence of AKG in the bathing media. As expected, specific force was lower in 3-month-old mdx than wild-type EDL muscles while AKG had no impact on specific force in either the wild-type or mdx EDL muscle (Fig. 7A). Intriguingly, the number of contractions required to fatigue mdx muscle (fatigue defined here as a 50% decrease in initial force of muscle stimulated at 60 Hz) was slightly yet statistically significantly higher compared to wild-type. AKG had no impact on the number of contractions required to fatigue wild-type EDL muscle; however, mdx EDL muscle displayed significantly greater fatigue resistance in the presence of AKG (Fig. 7B; P = 0.038). Following the fatigue protocol, tetanic force was measured every 5 min to determine the effect of AKG on fatigue recovery. In the absence of AKG, the initial recovery of force in mdx EDL matched wild-type levels; however at 10 and 15 min post-fatigue, the percent of force recovered is significantly reduced in mdx. Interestingly, while AKG had no impact on force recovery in wild-type EDL muscle, recovery in mdx muscle was accelerated by exposure to AKG and ultimately recovered to the same level as wild-type by 15 min post-fatigue (Fig. 7C).
Figure 7.
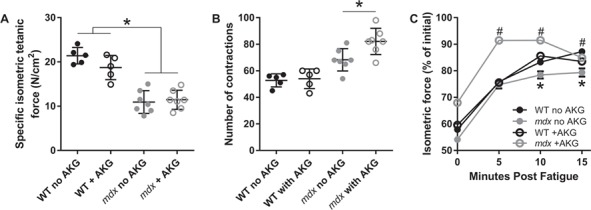
AKG extends time to fatigue and accelerates recovery from fatiguing contractions in mdx mice. (A) Specific isometric tetanic force of the EDL muscle, (B) number of submaximal contractions required to lose 50% maximal force and (C) rates of isometric tetanic force recovery following fatiguing contractions in 3-month-old wild-type and mdx mice. N ≥ 5/genotype/treatment. A two-way ANOVA was used to test the effect of genotype and treatment. Data are presented as mean ± SEM. *P < 0.05; different from wild-type, #P < 0.05; different from mdx with no AKG.
Discussion
Here we present data supporting the following conclusions: (1) systemic metabolic dysfunction is correlated with disease progression of the mdx mouse model of DMD; (2) urinary Krebs cycle metabolite depletion is a major component in segregating wild-type and mdx cohorts based on metabolic profile; (3) decreased Krebs cycle metabolites are not a consequence of decreased overall physical activity, but appear to reflect the inability of mdx animals to increase flux through the Krebs cycle in response to exercise; and (4) supplementing isolated mdx muscle with AKG slows muscle fatigue and speeds recovery from fatigue but has no effect on fatigue in muscles from wild-type mice.
Previous nuclear magnetic resonance spectroscopy (NMR)-based metabolomic studies of isolated and living tissues have laid the groundwork to establish a metabolic phenotype in mdx mice (27). The overall goal of this study was to utilize a non-invasive and systemic biofluid to glean new information about systemic metabolic dysfunction associated with dystrophinopathy using the mdx mouse model. We observed a significant increase in the number of altered metabolites in older mdx animals (3 months of age) compared to a younger cohort (1 month). Additionally, 3-month mdx animals showed greater separation compared to controls by PCA than did the 1-month cohort. This data fits with progression of muscle degeneration in the mdx model that is low at 1 month and peaks around 3 months of age (28). In agreement with a previously published screen of serum from DMD patients (22), mdx mice show elevated urinary creatine levels. Additionally, all three BCAAs (leucine, isoleucine and valine) were significantly elevated in urine of mdx mice. Finally, elevated N-glycolylneuramate in mdx urine at both 1 and 3 months is intriguing since targeted mutation of the cytidine monophosphate-sialic acid hydroxylase gene, which is essential for the biosynthesis of N-glycolylneuramate, exacerbates the phenotype of mdx as well as α-sarcoglycan null mice (29,30).
The greater difference in urinary metabolites between wild-type and mdx mice at 3 months of age compared to 1 month of age may be associated with the progressive muscle wasting associated with DMD that is accompanied by increasing levels of inflammation (31) and fibrotic deposition (32). We specifically chose 1- and 3-month-old animals to best capture the high degree of variation associated with muscle degeneration and regeneration that plateaus after 3 months (28). However, because symptoms like cardiomyopathies (33), neurological impairments (34) and fibrosis (32) often have a late onset in DMD, a similar disturbance in the metabolic profile may also be affected by disease progression. Thus, it is possible that the aging process in mdx mice may further affect urinary Krebs cycle metabolites and contribute to further reductions in energy metabolism.
Most notable was the significant depletion of Krebs cycle metabolites in mdx urine at 3 months of age, which agrees with previous work demonstrating reduced Krebs cycle pool in hearts from mdx mice (18). Krebs metabolite changes in mdx hearts were linked to a shift from light chain fatty acid to carbohydrate hydroxylation for energy production, anaplerotic pyruvate carboxylation and increased glycolysis (18). The data also correlates with previous proteomic profiling of skeletal muscle of mdx mice that showed large-scale reductions in adenylate kinase, which catalyzes the interconversion of adenine nucleotides (35). Interestingly, the data of the current study provides contradictory evidence to previous studies that show elevated Krebs cycle enzymes and lower glycolysis enzymes in 6-week-old mdx mice compared to wild-type (36). While we did not measure any differences in Krebs cycle metabolites at 1 month of age, Krebs cycle metabolites were significantly lower at 3 months in mdx mice. The highly variable and progressive nature of DMD is likely affecting skeletal muscle metabolism in the absence of dystrophin, which may explain the equivocal results to proteomic profiling. Additionally, Krebs cycle metabolite changes appear dependent upon disrupted NO/cyclic guanosine monophosphate (cGMP) signaling as manipulation of this deficit by genetic or pharmacologic means ameliorated the cardiac defects. Importantly, we show here that succinate levels, which showed the greatest difference compared to wild-type in the metabolomic screen, is normalized when mdx mice are crossed to a mouse expressing nearly full-length recombinant dystrophin in skeletal muscle (mdx/Δ71–78). Mdx/Δ71–78 mice are known to properly localize nNOS to the membrane, thus alleviated NO/cGMP signaling deficits. While we measured decreased succinate in quadriceps and heart from mdx mice, it appears that skeletal muscle-specific expression is sufficient to return urinary succinate levels to normal.
Submaximal exercise in healthy humans is generally associated with an increase in Krebs cycle metabolites (37). Because mdx mice display decreased voluntary wheel running compared to wild-type mice (26,38), we hypothesized that diminished urinary Krebs cycle metabolites could be a consequence of reduced cage activity. We measured no difference in home cage activity between mdx and wild-type mice, suggesting that Krebs cycle loss is not caused by decreased physical activity. Furthermore, wild-type animals displayed increased urinary succinate levels when forced to run downhill on a treadmill, corroborating published results in human subjects. However, mdx mice exhibited no increase in urinary succinate following an acute bout of exercise. While the downhill treadmill exercise protocol likely caused skeletal muscle damage in wild-type, mdx and mdx/Δ71–78 mice (39,40), it likely did not affect mitochondrial function (41). Our results suggest that Krebs cycle depletion is not due to decreased activity of mdx mice, but rather due to defective Krebs cycle flux in response to exercise.
Our results also suggest that isolated mdx EDL muscle is not more susceptible to a moderate ex vivo fatigue protocol but rather require more contractions to fatigue than wild-type. However, mdx EDL muscle displays slightly impaired recovery following contraction. Most interesting was the effect of AKG on mdx muscle. Whereas AKG had no effect on wild-type EDL, mdx showed an even greater fatigue resistance and accelerated recovery when in the presence of AKG. AKG-induced fatigue resistance is similar to that previously reported by exercise training in mdx mice (42). Elevated resistance to fatigue and accelerated recovery suggest that isocitrate dehydrogenase activity may be impaired in mdx skeletal muscle and thus AKG could represent a possible therapeutic avenue for alleviating dysfunction in dystrophic muscle. Increased resistance to fatigue might also suggest that it is associated with an immediate increase in nicotinamide adenine dinucleotide (NADH) production, replenishment of lower concentrations of subsequent Krebs cycle metabolites or a likely combination of both. However, consideration is required when assessing the extent of AKG supplementation in the EDL muscle because (1) the EDL of mdx mice does not reproduce changes associated with DMD patients as seen in the diaphragm (43) and (2) it is a type 2b fiber-dominant muscle that is associated with lower mitochondria and oxidative phosphorylation potential compared to type 1 (44). Given diaphragm (45) and type 2b fiber-dominant tibialis anterior muscle of mdx mice (46) suffer from severe metabolic disturbances, the current results might suggest that Krebs cycle supplementation may offer therapeutic potential for other skeletal muscles.
Biomarkers for DMD can provide clinicians with pertinent information about disease diagnosis, progression and evaluating the efficacy/side effects of various treatment strategies. We recently reported that urinary neopterin and isoxanthopterin could be useful biomarkers for DMD (47,48). Our data now provide evidence that urinary succinate could offer another suitable urinary biomarker capable of distinguishing a healthy from dystrophin-deficient animal—providing a suitable hydration correction method is utilized. Creatinine and specific gravity are the two primary methods used to correct urinary metabolites for hydration status, but because specific gravity in mice is typically beyond the upper limit for accurate correction, urinary creatinine is suggested to be the preferable option, especially if metabolites are compared between mice and humans (47). Because urine is a non-invasive and stress-free collection method that is routinely used during clinical visits, it could become a useful biofluid for future DMD research. However, renal function is compromised in DMD patients (49), which may affect concentrations of urinary metabolites and should be taken into consideration.
In summary, our results suggest that dystrophinopathy induces significant metabolic defects in Krebs cycle metabolites that are exacerbated by disease progression. The profiling of systemic metabolism using urine may provide a window of opportunity into the pathomechanisms of dystrophin deficiency.
Materials and Methods
Experimental approval and animal models
Male mdx (C57Bl/10ScSn-DMDmdx) and C57BL/10 mice (C57BL/10ScSn) were generated using founders purchased from Jackson Laboratory (Bar Harbor, ME, USA). Generation of Dys/Δ71–78 was previously reported (10). All mice were housed in groups of three to four per cage on a 14/10 h light/dark cycle with food and water provided ad libitum. All protocols were approved by the University of Minnesota Institutional Animal Care and Use Committee.
Identification and measurement of urinary metabolites
Sample preparation from 1- and 3-month-old mdx and C57BL/10 mice (n = 10/genotype/age) was carried out at Metabolon Inc., in a manner similar to a previous study (50). Briefly, individual samples were subjected to methanol extraction then split into aliquots for analysis by ultrahigh performance liquid chromatography/MS. The global biochemical profiling analysis comprised four unique arms consisting of reverse phase chromatography positive ionization methods optimized for hydrophilic compounds (LC/MS Pos Polar) and hydrophobic compounds (LC/MS Pos Lipid), reverse phase chromatography with negative ionization conditions (LC/MS Neg), as well as a HILIC chromatography method coupled to negative (LC/MS Polar) (51). All of the methods alternated between full scan MS and data-dependent MSn scans. The scan range varied slightly between methods but generally covered 70–1000 m/z.
Metabolites were identified by automated comparison of the ion features in the experimental samples to a reference library of chemical standard entries that included retention time, molecular weight (m/z), preferred adducts and in-source fragments as well as associated MS spectra and curated by visual inspection for quality control using software developed at Metabolon. Identification of known chemical entities was based on comparison to metabolomic library entries of purified standards (52).
Metabolomic Statistical Analysis—Two types of statistical analyses were performed: (1) significance tests and (2) classification analysis. Standard statistical analyses were performed in ArrayStudio on log-transformed data. For analyses not standard in ArrayStudio, the R program (http://cran.r-project.org/) was used. Following log transformation and imputation of missing values, if any, with the minimum observed value for each compound, Welch’s two sample t-test was used as significance test to identify biochemicals that differed significantly (P < 0.05) between experimental groups. An estimate of the false discovery rate (q-value) was calculated to take into account the multiple comparisons that normally occur in metabolomic-based studies. Classification analyses used included PCA, hierarchical clustering and random forest. For the scaled intensity graphics, each biochemical in the original scale (raw area count) was rescaled to set the median across all animals and time points equal to 1.
Tissue preparation
Tissue from 3-month-old mdx and C57BL/10 mice (n ≥ 5/genotype/tissue) was flash frozen in liquid nitrogen and homogenized with a LiN2 cooled mortar and pestle. Tissue or urine samples were precipitated with 4x volume 90:10 methanol:acetone and incubated on ice for 10 min. Samples were centrifuged at 12 000 x G for 10 min. Supernatant was dried in a Jouan RC1010 centrifuged SpeedVac coupled to a Savant trap and a Leybold vacuum. Urine pellet was resuspended in 10X volume of running buffer and tissue pellet was resuspended in 1x volume of running buffer for analysis by MS.
Urine samples were precipitated with 4x volume 90:10 methanol:acetone and incubated on ice for 10 min. Samples were centrifuged at 12 000 x G for 10 min. Supernatant was dried in a Jouan RC1010 centrifuged SpeedVac coupled to a Savant trap and a Leybold vacuum. Pellet was resuspended in 10x volume of running buffer for analysis by MS.
MS
LC-MS/MS SRM Analysis of metabolites—Samples (10 μL) for SRM analysis were subjected to separation using a Shimazu UFLCXR system coupled to an analytical Thermo Scientific Hypercarb column (100 × 2.1 mm, 5um) column at 50°C connected to the Applied Biosystem 5500 iontrap fitted with a turbo V electrospray source run in negative mode with declustering potential and collision energies (Table 1).
Table 1.
Selected reaction monitoring mass spectrometry parameters optimized for succinate
| ID | Q1 M/Z | Q2 M/Z | Dwell time | Decluster potential | Collision energy | Retention time |
|---|---|---|---|---|---|---|
| Succ | 117 | 73 | 50 | −85 | −16 | 1.36 |
| Succ 13C2 | 119 | 74 | 50 | −85 | −16 | 1.36 |
The samples were subjected to a linear gradient of A: 5% acetonitrile 0.1 formic acid B: 95% acetonitrile 0.1% formic acid for 7 min at a column flow rate of 400 μL/min. The column was cleared with 95% acetonitrile for 2 min and then equilibrated to buffer A for 3 min. Transitions monitored were established using the instrument’s compound optimization mode with direct injection for each compound. The data was analyzed using MultiQuant™ (ABI Sciex Framingham, MA) providing the peak area. A standard curve was constructed using from picomole to nanomole in 10 μL. Samples were run in duplicate and concentrations determined from the standard curve.
Home cage activity
Activity of 3-month-old mdx and C57BL/10 mice (n ≥ 5/genotype) was measured using an AccuScan system by Columbus Instruments, Inc. Activity was determined by measuring horizontal beam breaks, which was calculated as total distance ambulated. Mice were placed in the open-field apparatus for 24 h within their home cage.
Treadmill assay
We utilized a similar protocol to that previously reported as a ‘proof of concept’ in mdx mice (5). Briefly, 3-month-old mdx and C57BL/10 mice (n ≥ 5/genotype) were acclimated to the running apparatus for 3 days by placing them in the running lane for 5 min and then running them for 5 min at 5 m/min on a level surface. On the fourth day, mice were placed in the running lane that was on a 15-degree decline. The following protocol was carried out. 5 min at 0 m/min, 5 min at 5 m/min, 10 min at 15 m/min. Mice were run until they became exhausted or unwilling to continue. Urine was collected in sterile 1.5 mL tubes by gently massaging the lower back of the mouse while being elevated by the base of the tail. Urine was collected pre and at 15 and 60 min post-exercise.
Ex vivo physiology
Baseline contractile functions of EDL muscles from 3-month-old mdx and C57BL/10 mice (n ≥ 5/genotype/treatment) were assessed according to the methods of Moran et al. (53). Mice were anesthetized with sodium pentobarbital (100 mg/kg body mass (BM) for wild-type and 75 mg/kg BM for mdx). EDL muscles were removed and mounted on a dual-mode muscle lever system (300B-LR; Aurora Scientific Inc., Aurora, ON, Canada) with 5–0 suture in a 1.2 mL bath assembly and filled with oxygenated (95:5% O2:CO2) Krebs-Ringer bicarbonate (Krebs) buffer maintained at 25°C with or without AKG. Muscles were adjusted to their anatomical optimal length (Lo) based on resting tension. Muscle length was then measured from myotendonous junction to myotendonous junction using digital callipers. Prior to performing baseline contractile functions, muscles remained quiescent in the bath for 5 min. Maximal isometric tetanic force (Po) was measured every 2 min by stimulating the muscle to contract for 200 ms at 175 Hz until force plateaued (within 5 mN from one contraction to the next). Fatiguing submaximal, isometric contractions (60 Hz, 200 ms, 7.5 s between contractions) commenced 2 min following baseline contractile functions. Once 50% force loss was attained, recovery of force was measured by maximal isometric tetanic contractions at 0, 5, 10 and 15 min post.
Statistics
Statistical significance was determined by one- or two-way analysis of variance (ANOVA) for repeated measure with Tukey’s post hoc test or Student’s t-test (using Bonferroni correction of α level) where appropriate. All data are presented as mean ± SEM with significance set at P < 0.05.
Conflict of Interest statement. None declared.
Funding
Muscular Dystrophy Association (349549); University of Minnesota AHC Seed Grant; gifts from John and Cheryl Gunvalson and the Gregory Marzolf Jr. Foundation; National Institutes of Health (RO1 AR042423 and RO1 AR049899).
Supplementary Material
References
- 1. Mendell J.R., Shilling C., Leslie N.D., Flanigan K.M., Al-Dahhak R., Gastier-Foster J., Kneile K., Dunn D.M., Duval B., Aoyagi A. et al. (2012) Evidence-based path to newborn screening for Duchenne muscular dystrophy. Ann. Neurol., 71, 304–313. [DOI] [PubMed] [Google Scholar]
- 2. Manzur A.Y., Kuntzer T., Pike M. and Swan A.V. (2008) Glucocorticoid corticosteroids for Duchenne muscular dystrophy In Manzur A.Y. (ed), Cochrane Database of Systematic Reviews. John Wiley & Sons, Ltd, Chichester, UK. [DOI] [PubMed] [Google Scholar]
- 3. Eagle M., Baudouin S.V., Chandler C., Giddings D.R., Bullock R. and Bushby K. (2002) Survival in Duchenne muscular dystrophy: improvements in life expectancy since 1967 and the impact of home nocturnal ventilation. Neuromuscul. Disord., 12, 926–929. [DOI] [PubMed] [Google Scholar]
- 4. Hoffman E.P., Brown R.H. and Kunkel L.M. (1987) Dystrophin: the protein product of the Duchenne muscular dystrophy locus. Cell, 51, 919–928. [DOI] [PubMed] [Google Scholar]
- 5. Ervasti J.M. and Campbell K.P. (1993) A role for the dystrophin-glycoprotein complex as a transmembrane linker between laminin and actin. J. Cell Biol., 122, 809–823. [DOI] [PMC free article] [PubMed] [Google Scholar]
- 6. Ervasti J.M. and Campbell K.P. (1991) Membrane organization of the dystrophin-glycoprotein complex. Cell, 66, 1121–1131. [DOI] [PubMed] [Google Scholar]
- 7. Allen D.G., Whitehead N.P. and Froehner S.C. (2016) Absence of dystrophin disrupts skeletal muscle signaling: roles of Ca2+, reactive oxygen species, and nitric oxide in the development of muscular dystrophy. Physiol. Rev., 96, 253–305. [DOI] [PMC free article] [PubMed] [Google Scholar]
- 8. Brenman J.E., Chao D.S., Xia H., Aldape K. and Bredt D.S. (1995) Nitric oxide synthase complexed with dystrophin and absent from skeletal muscle sarcolemma in Duchenne muscular dystrophy. Cell, 82, 743–752. [DOI] [PubMed] [Google Scholar]
- 9. Kobayashi Y.M., Rader E.P., Crawford R.W., Iyengar N.K., Thedens D.R., Faulkner J.A., Parikh S.V., Weiss R.M., Chamberlain J.S., Moore S.A. et al. (2008) Sarcolemma-localized nNOS is required to maintain activity after mild exercise. Nature, 456, 511–515. [DOI] [PMC free article] [PubMed] [Google Scholar]
- 10. Belanto J.J., Mader T.L., Eckhoff M.D., Strandjord D.M., Banks G.B., Gardner M.K., Lowe D.A. and Ervasti J.M. (2014) Microtubule binding distinguishes dystrophin from utrophin. Proc. Natl. Acad. Sci. U. S. A., 111, 5723–5728. [DOI] [PMC free article] [PubMed] [Google Scholar]
- 11. Belanto J.J., Olthoff J.T., Mader T.L., Chamberlain C.M., D’anna M.N., McCourt P.M., Talsness D.M., Gundersen G.G., Lowe D.A. and Ervasti J.M. (2016) Independent variability of microtubule perturbations associated with dystrophinopathy. Hum. Mol. Genet., 25, 4951–4961. [DOI] [PMC free article] [PubMed] [Google Scholar]
- 12. Prins K.W., Humston J.L., Mehta A., Tate V., Ralston E. and Ervasti J.M. (2009) Dystrophin is a microtubule-associated protein. J. Cell Biol., 186, 363–369. [DOI] [PMC free article] [PubMed] [Google Scholar]
- 13. Nelson D.M., Lindsay A., Judge L.M., Duan D., Chamberlain J.S., Lowe D.A. and Ervasti J.M. (2018) Variable rescue of microtubule and physiological phenotypes in mdx muscle expressing different miniaturized dystrophins. Hum. Mol. Genet., 27, 2090–2100. [DOI] [PMC free article] [PubMed] [Google Scholar]
- 14. Tidball J.G. and Wehling-Henricks M. (2007) The role of free radicals in the pathophysiology of muscular dystrophy. J. Appl. Physiol., 102, 1677–1686. [DOI] [PubMed] [Google Scholar]
- 15. Percival J.M., Siegel M.P., Knowels G. and Marcinek D.J. (2013) Defects in mitochondrial localization and ATP synthesis in the mdx mouse model of Duchenne muscular dystrophy are not alleviated by PDE5 inhibition. Hum. Mol. Genet., 22, 153–167. [DOI] [PMC free article] [PubMed] [Google Scholar]
- 16. Millay D.P., Sargent M.A., Osinska H., Baines C.P., Barton E.R., Vuagniaux G., Sweeney H.L., Robbins J. and Molkentin J.D. (2008) Genetic and pharmacologic inhibition of mitochondrial-dependent necrosis attenuates muscular dystrophy. Nat. Med., 14, 442–447. [DOI] [PMC free article] [PubMed] [Google Scholar]
- 17. Kuznetsov A.V., Winkler K., Wiedemann F., Bossanyi P., Dietzmann K. and Kunz W.S. (1998) Impaired mitochondrial oxidative phosphorylation in skeletal muscle of the dystrophin-deficient mdx mouse. Mol. Cell. Biochem., 183, 87–96. [DOI] [PubMed] [Google Scholar]
- 18. Khairallah M., Khairallah R., Young M.E., Dyck J.R.B., Petrof B.J. and Des Rosiers C. (2007) Metabolic and signaling alterations in dystrophin-deficient hearts precede overt cardiomyopathy. J. Mol. Cell. Cardiol., 43, 119–129. [DOI] [PubMed] [Google Scholar]
- 19. Khairallah M., Khairallah R.J., Young M.E., Allen B.G., Gillis M.A., Danialou G., Deschepper C.F., Petrof B.J. and Des Rosiers C. (2008) Sildenafil and cardiomyocyte-specific cGMP signaling prevent cardiomyopathic changes associated with dystrophin deficiency. Proc. Natl. Acad. Sci. U. S. A., 105, 7028–7033. [DOI] [PMC free article] [PubMed] [Google Scholar]
- 20. Cullen M.J. and Jaros E. (1988) Ultrastructure of the skeletal muscle in the X chromosome-linked dystrophic (mdx) mouse. Acta Neuropathol., 77, 69–81. [DOI] [PubMed] [Google Scholar]
- 21. Zatz M., Shapiro L.J., Campion D.S., Oda E. and Kaback M.M. (1978) Serum pyruvate-kinase (PK) and creatine-phosphokinase (CPK) in progressive muscular dystrophies. J. Neurol. Sci., 36, 349–362. [DOI] [PubMed] [Google Scholar]
- 22. Spitali P., Hettne K., Tsonaka R., Sabir E., Seyer A., Hemerik B.A., Goeman J.J., Picillo E., Ergoli M. et al. (2018) Cross-sectional serum metabolomic study of multiple forms of muscular dystrophy. J. Cell. Mol. Med., 22, 2442–2448. [DOI] [PMC free article] [PubMed] [Google Scholar]
- 23. Hörster I., Weigt-Usinger K., Carmann C., Chobanyan-Jürgens K., Köhler C., Schara U., Kayacelebi A.A., Beckmann B., Tsikas D. and Lücke T. (2015) The l-arginine/NO pathway and homoarginine are altered in Duchenne muscular dystrophy and improved by glucocorticoids. Amino Acids, 47, 1853–1863. [DOI] [PubMed] [Google Scholar]
- 24. Griffin J.L., Williams H.J., Sang E., Clarke K, Rae C. and Nicholson J.K. (2001) Metabolic profiling of genetic disorders: a multitissue 1 H nuclear magnetic resonance spectroscopic and pattern recognition study into dystrophic tissue. Anal. Biochem., 293, 16–21. [DOI] [PubMed] [Google Scholar]
- 25. Crawford G.E., Faulkner J.A., Crosbie R.H., Campbell K.P., Froehner S.C. and Chamberlain J.S. (2000) Assembly of the dystrophin-associated protein complex does not require the dystrophin COOH-terminal domain. J. Cell Biol., 150, 1399–1410. [DOI] [PMC free article] [PubMed] [Google Scholar]
- 26. Carter G.T., Wineinger M.A., Walsh S.A., Horasek S.J. and Abresch R.T. (1995) Effect of voluntary wheel running exercise on muscles of the mdx mouse. Neuromuscular. Disord., 5, 323–332. [DOI] [PubMed] [Google Scholar]
- 27. Patti G.J., Yanes O. and Siuzdak G. (2012) Metabolomics: the apogee of the omics trilogy. Nat. Rev. Mol. Cell Biol., 13, 263–269. [DOI] [PMC free article] [PubMed] [Google Scholar]
- 28. Pastoret C. and Sebille A. (1995) mdx mice show progressive weakness and muscle deterioration with age. J. Neurol. Sci., 129, 97–105. [DOI] [PubMed] [Google Scholar]
- 29. Chandrasekharan K., Yoon J.H., Xu Y., Vries S., Camboni M., Janssen P.M.L., Varki A. and Martin P.T. (2010) A human-specific deletion in mouse Cmah increases disease severity in the mdx model of Duchenne muscular dystrophy. Sci. Transl. Med., 2, 42ra54. [DOI] [PMC free article] [PubMed] [Google Scholar]
- 30. Martin P.T., Camboni M., Xu R., Golden B., Chandrasekharan K., Wang C.-M., Varki A. and Janssen P.M.L. (2013) N-Glycolylneuraminic acid deficiency worsens cardiac and skeletal muscle pathophysiology in α-sarcoglycan-deficient mice. Glycobiology, 23, 833–843. [DOI] [PMC free article] [PubMed] [Google Scholar]
- 31. Porter J.D., Khanna S., Kaminski H.J., Rao J.S., Merriam A.P., Richmonds C.R., Leahy P., Li J., Guo W. and Andrade F.H. (2002) A chronic inflammatory response dominates the skeletal muscle molecular signature in dystrophin-deficient mdx mice. Hum. Mol. Genet., 11, 263–272. [DOI] [PubMed] [Google Scholar]
- 32. Klingler W., Jurkat-Rott K., Lehmann-Horn F. and Schleip R. (2012) The role of fibrosis in Duchenne muscular dystrophy. Acta Myol., 31, 184–195. [PMC free article] [PubMed] [Google Scholar]
- 33. Nigro G., Comi L.I., Politano L. and Bain R.J.I. (1990) The incidence and evolution of cardiomyopathy in Duchenne muscular dystrophy. Int. J. Cardiol., 26, 271–277. [DOI] [PubMed] [Google Scholar]
- 34. Banihani R., Smile S., Yoon G., Dupuis A., Mosleh M., Snider A. and McAdam L. (2015) Cognitive and neurobehavioral profile in boys with duchenne muscular dystrophy. J. Child Neurol., 30, 1472–1482. [DOI] [PubMed] [Google Scholar]
- 35. Ge Y., Molloy M.P., Chamberlain J.S. and Andrews P.C. (2003) Proteomic analysis of mdx skeletal muscle: great reduction of adenylate kinase 1 expression and enzymatic activity. Proteomics, 3, 1895–1903. [DOI] [PubMed] [Google Scholar]
- 36. Gardan-Salmon D., Dixon J.M., Lonergan S.M. and Selsby J.T. (2011) Proteomic assessment of the acute phase of dystrophin deficiency in mdx mice. Eur. J. Appl. Physiol., 111, 2763–2773. [DOI] [PubMed] [Google Scholar]
- 37. Sahlin K., Katz A. and Broberg S. (1990) Tricarboxylic acid cycle intermediates in human muscle during prolonged exercise. Am. J. Physiol., 259, C834–C841. [DOI] [PubMed] [Google Scholar]
- 38. Landisch R.M., Kosir A.M., Nelson S.A., Baltgalvis K.A. and Lowe D.A. (2008) Adaptive and nonadaptive responses to voluntary wheel running by mdx mice. Muscle Nerve, 38, 1290–1293. [DOI] [PMC free article] [PubMed] [Google Scholar]
- 39. Radley-Crabb H., Terrill J., Shavlakadze T., Tonkin J., Arthur P. and Grounds M. (2012) A single 30 min treadmill exercise session is suitable for ‘proof-of concept studies’ in adult mdx mice: a comparison of the early consequences of two different treadmill protocols. Neuromuscul. Disord., 22, 170–182. [DOI] [PubMed] [Google Scholar]
- 40. Wang B., Li J. and Xiao X. (2000) Adeno-associated virus vector carrying human minidystrophin genes effectively ameliorates muscular dystrophy in mdx mouse model. Proc. Natl. Acad. Sci. U. S. A., 97, 13714–13719. [DOI] [PMC free article] [PubMed] [Google Scholar]
- 41. Nichenko A.S., Southern W.M., Qualls A., Spencer C.C. and Call J.A. (2017) Autophagy related Ulk1 is necessary for the recovery of mitochondrial function after skeletal muscle injury. FASEB J., 31, No. 1_supplement. [Google Scholar]
- 42. Hayes A. and Williams D.A. (1996) Beneficial effects of voluntary wheel running on the properties of dystrophic mouse muscle. J. Appl. Physiol., 80, 670–679. [DOI] [PubMed] [Google Scholar]
- 43. Stedman H.H., Sweeney H.L., Shrager J.B., Maguire H.C., Panettieri R.A., Petrof B., Narusawa M., Leferovich J.M., Sladky J.T. and Kelly A.M. (1991) The mdx mouse diaphragm reproduces the degenerative changes of Duchenne muscular dystrophy. Nature, 352, 536–539. [DOI] [PubMed] [Google Scholar]
- 44. Yan Z., Okutsu M., Akhtar Y.N. and Lira V.A. (2011) Regulation of exercise-induced fiber type transformation, mitochondrial biogenesis, and angiogenesis in skeletal muscle J. Appl. Physiol., 110, 264–274. [DOI] [PMC free article] [PubMed] [Google Scholar]
- 45. Pauly M., Daussin F., Burelle Y., Li T., Godin R., Fauconnier J., Koechlin-Ramonatxo C., Hugon G., Lacampagne A., Coisy-Quivy M. et al. (2012) AMPK activation stimulates autophagy and ameliorates muscular dystrophy in the mdx mouse diaphragm. Am. J. Pathol., 181, 583–592. [DOI] [PubMed] [Google Scholar]
- 46. Rybalka E., Timpani C.A., Cooke M.B., Williams A.D. and Hayes A. (2014) Defects in mitochondrial ATP synthesis in dystrophin-deficient mdx skeletal muscles may be caused by complex I insufficiency. PLoS One, 9, e115763. [DOI] [PMC free article] [PubMed] [Google Scholar]
- 47. Lindsay A., Schmiechen A., Chamberlain C.M., Ervasti J.M. and Lowe D.A. (2018) Neopterin/7,8-dihydroneopterin is elevated in Duchenne muscular dystrophy patients and protects mdx skeletal muscle function. Exp. Physiol., 103, 995–1009. [DOI] [PMC free article] [PubMed] [Google Scholar]
- 48. Lindsay A., McCourt P.M., Karachunski P., Lowe D.A. and Ervasti J.M. (2018) Xanthine oxidase is hyper-active in Duchenne muscular dystrophy. Free Radic. Biol. Med., 129, 364–371. [DOI] [PMC free article] [PubMed] [Google Scholar]
- 49. Braat E., Hoste L., De Waele L., Gheysens O., Vermeersch P., Goffin K., Pottel H., Goemans N. and Levtchenko E. (2015) Renal function in children and adolescents with Duchenne muscular dystrophy. Neuromuscul. Disord., 25, 381–387. [DOI] [PubMed] [Google Scholar]
- 50. Hatano T., Saiki S., Okuzumi A., Mohney R.P. and Hattori N. (2016) Identification of novel biomarkers for Parkinson’s disease by metabolomic technologies. J. Neurol. Neurosurg. Psychiatry, 87, 295–301. [DOI] [PubMed] [Google Scholar]
- 51. Marie Evans A., Bridgewater B., Mitchell M., Dai H. and Lad M. (2014) High resolution mass spectrometry improves data quantity and quality as compared to unit mass resolution mass spectrometry in high-throughput profiling metabolomics. Metabolomics, 4, 132. [Google Scholar]
- 52. DeHaven C.D., Evans A.M., Dai H. and Lawton K.A. (2010) Organization of GC/MS and LC/MS metabolomics data into chemical libraries. J. Cheminform., 2, 9. [DOI] [PMC free article] [PubMed] [Google Scholar]
- 53. Moran A.L., Warren G.L. and Lowe D.A. (2005) Soleus and EDL muscle contractility across the lifespan of female C57BL/6 mice. Exp. Gerontol., 40, 966–975. [DOI] [PubMed] [Google Scholar]
Associated Data
This section collects any data citations, data availability statements, or supplementary materials included in this article.