

Abstract
Aims/Introduction
In the present meta‐analysis, we aimed to determine the effects of sodium–glucose cotransporter 2 inhibitor (SGLT‐2i) in addition to insulin therapy on cardiovascular risk factors in type 2 diabetes patients.
Materials and Methods
Randomized controlled trials were identified by searching the PubMed, Embase and Cochrane Library databases published before September 2017. The intervention group received SGLT‐2i as add‐on treatment to insulin therapy, and the control group received placebos in addition to insulin. We assessed pooled data, including weighted mean differences and 95% confidence intervals (CIs) using a random‐effects model.
Results
A total of 10 randomized controlled trials (n = 5,159) were eligible. The weighted mean differences for systolic blood pressure and diastolic blood pressure were −3.17 mmHg (95% CI −4.53, −1.80, I 2 = 0%) and −1.60 mmHg (95% CI −2.52, −0.69, I 2 = 0%) in the intervention groups. Glycosylated hemoglobin, fasting plasma glucose, postprandial glucose and daily insulin were also lower in the intervention groups, with relative weighted mean differences of −0.49% (95% CI −0.71, −0.28%, I 2 = 92%), −1.10 mmol/L (95% CI −1.69, −0.51 mmol/L, I 2 = 84%), −3.63 mmol/L (95% CI −4.36, −2.89, I 2 = 0%) and −5.42 IU/day (95% CI −8.12, −2.72, I 2 = 93%). The transformations of uric acid and bodyweight were −26.16 μmol/L (95% CI −42.14, −10.17, I 2 = 80%) and −2.13 kg (95% CI −2.66, −1.60, I 2 = 83%). The relative risk of hypoglycemia was 1.09 (95% CI 1.02, 1.17, P < 0.01). The relative risks of urinary tract and genital infection were 1.29 (95% CI 1.03, 1.62, P = 0.03) and 5.25 (95% CI 3.55, 7.74, P < 0.01).
Conclusions
The results showed that in the intervention group, greater reductions were achieved for blood pressure, glucose control, uric acid and bodyweight. This treatment regimen might therefore provide beneficial effects on the occurrence and development of cardiovascular events.
Keywords: Cardiovascular risk factors, Meta‐analysis, Sodium–glucose cotransporter 2 inhibitor
Introduction
Diabetes mellitus is a chronic metabolic disorder that seriously influences the health, quality of life and life expectancy of affected patients. One of the most common macrovascular complications of diabetes is coronary atherosclerotic heart disease. The rate of myocardial infarction and heart failure in diabetes patients is far higher than the rate in patients without diabetes1. Therefore, when choosing therapies for diabetes patients, we must evaluate whether the treatment will lower the risk of cardiovascular disease associated with selected antidiabetic agents, and whether it can improve prognoses in diabetes‐associated cardiovascular disease.
For islets function failure along with the progression of type 2 diabetes, most patients will require insulin therapy, especially in the late stage. However, the long‐term use of insulin has side‐effects of obesity and sodium retention, which not only increase the difficulty of glycemic control, but also increase the risk of metabolic syndrome (hypertension, hyperlipidemia and hyperuricemia), which increases the occurrence of cardiovascular events. How to reduce these side‐effects of insulin therapy is a realistic question.
Sodium–glucose cotransporter 2 inhibitors (SGLT‐2is) are a novel class of antihyperglycemic drugs that are independent of insulin release or action. These drugs reduce plasma glucose levels by reducing glucose renal reabsorption and increasing urinary glucose excretion2, 3. In addition, SGLT‐2is might potentially reduce the risk of cardiovascular events in diabetes patients with high risk factors4, 5, 6. It has also been shown that in patients with type 2 diabetes, treatment with SGLT‐2is resulted in 39% fewer hospitalizations for heart failure and 51% fewer deaths from any cause than were observed for other type 2 diabetes medicines. When hospitalization for heart failure and death from any cause were combined, the reduction was 46%7. Meanwhile, the reduction of cardiovascular risk factors, such as bodyweight, systolic blood pressure (SBP) and diastolic blood pressure (DBP), and uric acid level, were also reported in these studies8, 9, 10, probably intermediates the cardiovascular protective effects of SGLT‐2is.
Therefore, we sought to determine whether SGLT‐2is as add‐on treatment to insulin therapy could improve cardiovascular risk factors and reduce the side‐effects of insulin, and thus benefit cardiovascular outcomes in type 2 diabetes patients.
Recently, some high‐quality and randomized controlled studies of the efficacy and safety of SGLT‐2is in addition to insulin therapy have emerged. However, there has been no meta‐analysis or systematic review on this. Therefore, we carried out the present meta‐analysis to evaluate the effects of SGLT‐2is in addition to insulin on cardiovascular risk factors in type 2 diabetes patients.
Methods
The present meta‐analysis was carried out in accordance with the recommendations described in the Preferred Reporting Items for Systematic Reviews and Meta‐Analyses statement11.
Data sources and search strategy
PubMed, Embase and Cochrane Library databases were searched to identify relevant studies published before September 2017. Trials that were published between 2009 and 2017 were manually searched. We first carried out a search using the following MeSH terms: ‘canagliflozin,’ ‘dapagliflozin,’ ‘ertugliflozin,’ ‘luseogliflozin,’ ‘sotagliflozin,’ ‘ipragliflozin,’ ‘empagliflozin,’ ‘tofogliflozin’ and ‘insulin.’ Then, we searched for these MeSH terms and their corresponding entry terms (using every MeSH term) as combinations of terms in the [Title/Abstract] using ‘OR.’ Finally, we searched the search results for published randomized controlled trials or unpublished trials using ‘AND.’ The methods used for the literature search are described in detail in the Data S1. All the studies included in this meta‐analysis were approved by institutional review boards or independent ethics committees, or in accordance with the Declaration of Helsinki and Good Clinical Practice Guidelines for each center. All patients provided written informed consent.
Study selection
We searched for randomized controlled trials carried out to evaluate the efficacy and safety of SGLT‐2is administered in combination with insulin in patients with type 2 diabetes. The selection criteria were as follows: the randomized controlled trial had at least an 8‐week follow‐up period, and it reported cardiovascular outcomes (e.g., blood pressure, glucose control, serum lipid parameters, uric acid levels and changes in serum electrolyte levels) and safety outcomes (e.g., hyperglycemic events, severe hypoglycemic events, urinary tract infections and genital infections).
Data extraction
Studies that were not based on a treatment combining insulin or SGLT‐2is, studies with a follow‐up period of <8 weeks or studies that included individuals with type 1 diabetes were excluded. When multiple reports described the same randomized controlled trial, the most recent or most complete study was included. Whether other oral medicines were added to the treatment regimen was not an elimination criterion. Single‐arm and open‐control trials were excluded.
Quality assessment
Two independent reviewers (Bingshu Wu and Difei Wang) evaluated the studies according to the inclusion and exclusion criteria, and assessed the risk of bias according to the Cochrane risk of bias tool12. The following domains were considered: random sequence generation, allocation concealment, blinding of participants, blinding of outcome assessment, incomplete outcome data, selective reporting and other bias. Disagreements were resolved in discussions.
Statistical analysis
The effect of administering SGLT‐2is in combination with insulin was assessed according to the six following outcomes: blood pressure, glucose control, bodyweight, serum lipid levels, uric acid levels and changes in serum electrolyte levels. All six outcomes were assessed as continuous variables. We calculated pooled outcomes for weighted mean differences (WMDs) and 95% confidence intervals (CIs) using a random‐effects model. Heterogeneity was assessed using the I 2 statistic. Values >50% were viewed as indicative of moderate‐to‐high heterogeneity13. We also carried out subgroup analyses and sensitivity analyses to test the heterogeneity and stability of our findings. We used Review Manager version 5.3 (The Cochrane Collaboration, Copenhagen, Denmark) and Stata/SE 12.0 (StataCorp, College Station, TX, USA) for all statistical analyses.
Results
Study characteristics and quality assessment results
The search strategy identified 2,890 citations that were published before September 2017 in the PubMed, Embase and Cochrane Library databases. After duplicate studies were eliminated using Endnote reference manager, 676 articles remained. The 676 resulting titles and abstracts were reviewed, and 21 articles were determined to be potentially eligible for inclusion. The full‐text of each of these was then retrieved and evaluated. Of these 21 studies, 11 were excluded for the reasons described in Data S1 (flow chart). The 10 remaining trials were published between 2009 and 2017 (Table 1). The trial durations were 12–104 weeks in length. All participants were adult patients with type 2 diabetes.
Table 1.
Study characteristics
| Name | Duration of diabetes (years) | Age (years) | BMI (kg/m2) | HbA1c (%) | Trial duration (weeks) | Interventor | Dose of SGLT‐2i | Placebo group |
|---|---|---|---|---|---|---|---|---|
| JPW 200914 | 12.28/6.27 | 56.70/8.90 | 35.51/4.27 | 8.43/0.83 | 12 | Dapagliflozin + insulin + OAD | 10 mg | Insulin + OAD |
| 20 mg | ||||||||
| JPW 201415 | 13.59/7.27 | 59.31/8.21 | 33.12/5.32 | 8.53/0.82 | 104 | Dapagliflozin + insulin ± OAD | 2.5 mg | Insulin ± OAD |
| 5/10 mg | ||||||||
| 10 mg | ||||||||
| JR 201516 | >4.72 | 58.8/9.90 | 32.2/5.90 | 8.2/0.80 | 78 | Empagliflozin + insulin ± OAD | 10 mg | Insulin ± OAD |
| 25 mg | ||||||||
| JR 201417 | >8.78 | 56.7/9.50 | 34.8/4.10 | 8.34/0.73 | 52 | Empagliflozin + insulin ± metformin | 10 mg | Insulin ± metformin |
| 25 mg | ||||||||
| NI 201618 | 13.82/8.51 | 57.97/10.27 | 26.45/4.63 | 8.87/0.82 | 16 | Canagliflozin + insulin | 100 mg | Insulin |
| BN 201519 | 16.23/7.50 | 62.67/11.94 | 33.13/6.40 | 8.3/0.90 | 52 | Canagliflozin + insulin | 100 mg | Insulin |
| 300 mg | ||||||||
| HI 201620 | 13.17/8.08 | 58.87/10.50 | 25.89/3.64 | 8.653/0.80 | 16 | Ipragliflozin + insulin ± DPP‐4 | 50 mg | Insulin ± DPP‐4 |
| EA 201621 | 6.77/5.87 | 58/9.82 | 26.64/4.51 | 8.34/0.85 | 16 | Dapagliflozin + insulin ± OAD | 5 mg | Insulin ± OAD |
| KS 201622 | 14.91/6.33 | 57.24/11.73 | 28.71/5.72 | 8.67/0.97 | 24 | Tofogliflozin + insulin ± OAD | 20 mg | Insulin ± OAD |
| Tofogliflozin + glargine ± OAD | 20 mg | Insulin ± OAD | ||||||
| YT 201723 | 14.15/8.81 | 58.20/10.59 | 26.16/3.67 | 8.49/0.72 | 16 | Tofogliflozin + insulin ± OAD | 20 mg | Insulin ± OAD |
The data are shown as the mean/standard deviation. Data were extracted until 16 weeks (a double‐blind treatment) instead of 36 weeks (an open‐label extension treatment) from EA 201621. BMI, body mass index; DPP‐4, dipeptidyl peptidase‐4; HbA1c, glycosylated hemoglobin; OAD, oral antidiabetic drug; SGLT‐2i, sodium–glucose cotransporter 2.
For all of the included studies, a risk of bias assessment was carried out using The Cochrane Collaboration risk of bias tool (Figure 2 in Data S1).
Meta‐analysis results
The effects of the included treatments on cardiovascular risk factors were determined according to the following characteristics: blood pressure, lipid levels, glycemic efficacy (i.e., changes in the insulin dose or glycosylated hemoglobin [HbA1c], fasting plasma glucose [FPG] or 2‐h postprandial glucose [PPG] levels), bodyweight, uric acid and serum electrolyte levels (i.e., sodium, potassium and magnesium).
Blood pressure and lipid levels
Treatment with a single SGLT‐2i in addition to insulin ± other antidiabetic drugs resulted in better blood pressure control than was observed in the placebo groups. The corresponding WMDs were −3.17 mmHg (95% CI −4.53, −1.80, I 2 = 0%) and −1.60 mmHg (95% CI −2.52, −0.69, I 2 = 0%; Figures 1 and 2). After incomplete data were excluded, the results for lipid levels, including total cholesterol, triglyceride, low‐density lipoprotein cholesterol and high‐density lipoprotein cholesterol levels, were slightly different or showed no statistical significance in the intervention groups (Data S2).
Figure 1.
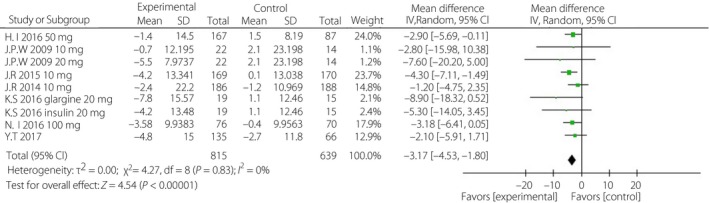
Forest plot of randomized controlled trials: effect on systolic blood pressure. CI, confidence interval; SD, standard deviation.
Figure 2.
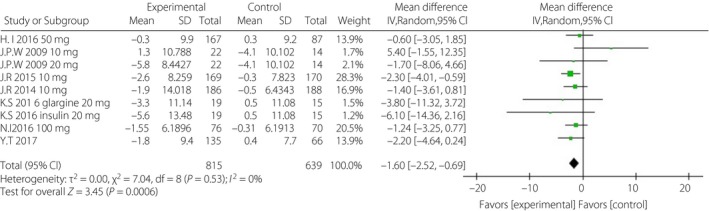
Forest plot of randomized controlled trials: effect on diastolic blood pressure. CI, confidence interval; SD, standard deviation.
Glycemic control
When incomplete data was excluded, the SGLT‐2i group, to a certain extent, showed lower levels of HbA1c, FPG, PPG and daily insulin than were observed in the control group. The corresponding WMDs were −0.49% (95% CI −0.71, −0.28%, I 2 = 92%), −1.10 mmol/L (95% CI −1.69, −0.51, I 2 = 84%), −3.63 mmol/L (95% CI −4.36, −2.89, I 2 = 0%) and −5.42 IU/day (95% CI −8.12, −2.72, I 2 = 93%; Figures 3, 4, 5, 6).
Figure 3.
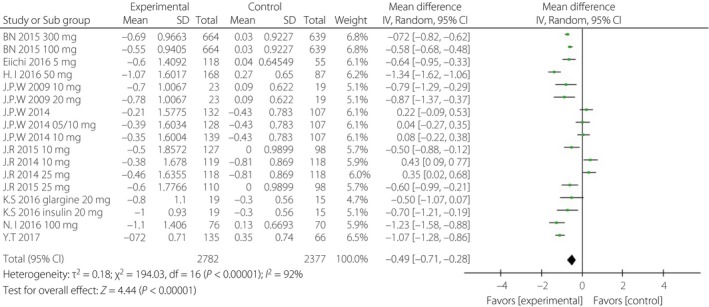
Forest plot of randomized controlled trials: effect on glycosylated hemoglobin. CI, confidence interval; SD, standard deviation.
Figure 4.
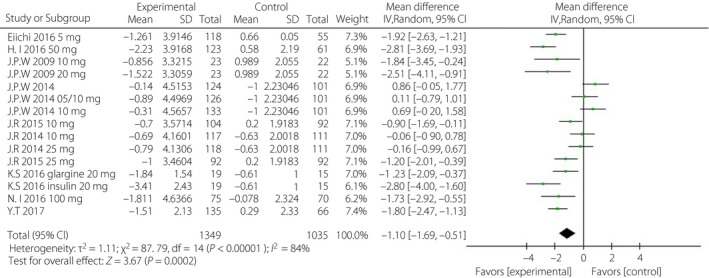
Forest plot of randomized controlled trials: effect on fasting glucose plasma. CI, confidence interval; SD, standard deviation.
Figure 5.
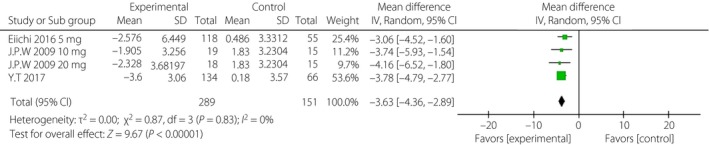
Forest plot of randomized controlled trials: effect on 2‐h postprandial glucose. CI, confidence interval; SD, standard deviation.
Figure 6.
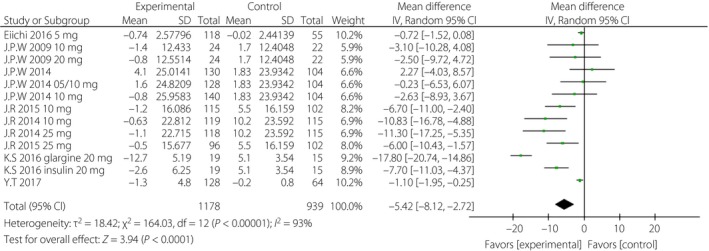
Forest plot of randomized controlled trials: effect on daily insulin. CI, confidence interval; SD, standard deviation.
Bodyweight
After incomplete data were excluded, bodyweight was significantly lower in the SGLT‐2i group than in the control group (Figure 7). The WMD was −2.13 kg (95% CI −2.66, −1.60, I 2 = 83%).
Figure 7.
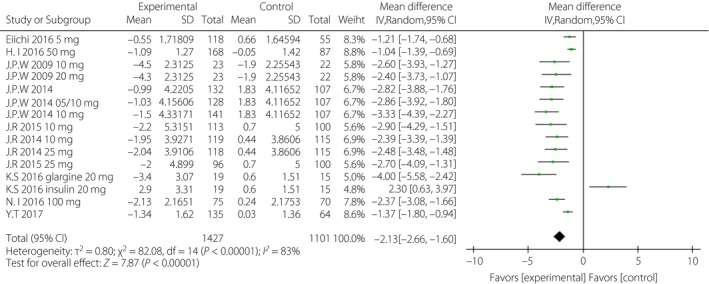
Forest plot of randomized controlled trials: bodyweight. CI, confidence interval; SD, standard deviation.
Uric acid
Patients in the experimental groups had substantially lower uric acid levels (−26.16 μmol/L, 95% CI −42.14, −10.17, I 2 = 80%) than were observed in the placebo‐controlled groups (Figure 8).
Figure 8.
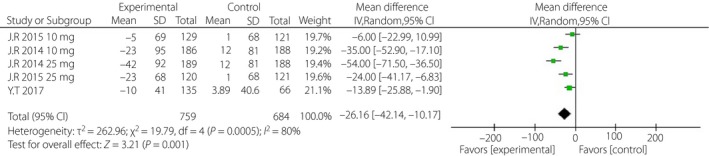
Forest plot of randomized controlled trials: uric acid. CI, confidence interval; SD, standard deviation.
Serum electrolyte
After incomplete data were excluded, the results showed that serum electrolyte levels, including sodium, potassium and magnesium levels, were slightly altered in the experimental groups (Data S2).
Subgroup analysis
First, considering the impact of the variation of the follow‐up period, we analyzed the above indicators in the short‐term (≤24 weeks) and long‐term (≥52 weeks) subgroups, separately. The WMD of DBP was greater in the long‐term subgroup (−1.96 mmHg, 95% CI −3.32, −0.61, I 2 = 0%) than that in the short‐term subgroup (−1.31 mmHg, 95% CI −2.57, −0.04, I 2 = 2%; Figure 9). The WMDs of daily insulin were similar between the subgroups: −5.63 IU/day (95% CI −9.46, −1.81, I 2 = 96%) in the short‐term subgroup and −5.23 IU/day (95% CI −8.70, −1.77, I 2 = 63%) in the long‐term subgroup (Figure 10). The WMD of bodyweight was greater in the long‐term subgroup (−2.77 kg, 95% CI −3.19, −2.35, I 2 = 0%) than that in the short‐term subgroup (−1.59 kg, 95% CI −2.26, −0.93, I 2 = 85%; Figure 11). The difference of SBP, HbA1c and FPG were non‐significant or could not be analyzed for enough participants in the subgroups.
Figure 9.
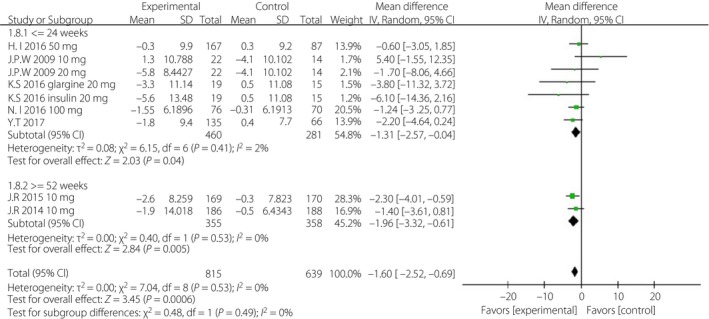
Subgroup analysis of diastolic blood pressure based on duration. CI, confidence interval; SD, standard deviation.
Figure 10.
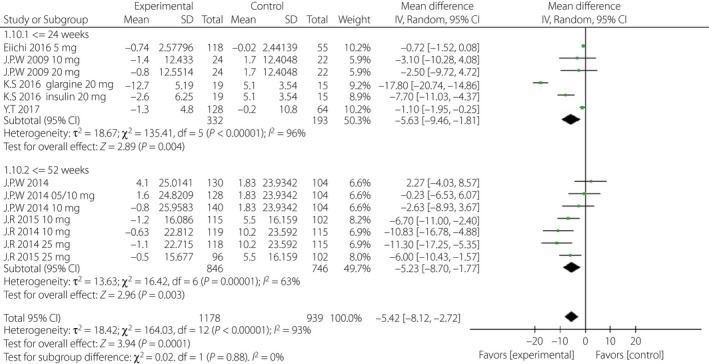
Subgroup analysis of daily insulin based on duration. CI, confidence interval; SD, standard deviation.
Figure 11.
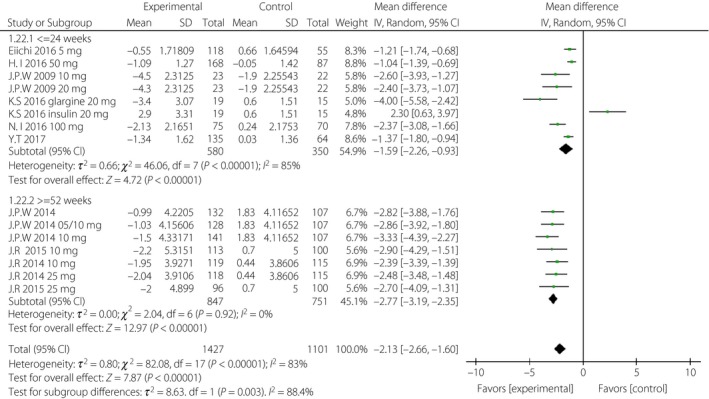
Subgroup analysis of body weight based on duration. CI, confidence interval; SD, standard deviation.
Second, to investigate the specific effects of different SGLT‐2is, we compared the above indicators for each kind of them as possible (Data S2). Tofogliflozin showed a greater reduction of SBP (−3.37 mmHg, 95% CI −6.64, −0.10, I 2 = 0%) compared with canagliflozin (−3.18 mmHg, 95% CI −2.26, −0.93) and ipragliflozin (−2.90 mmHg, 95% CI −6.41, 0.05). Tofogliflozin also showed a greater reduction of DBP (−2.63 mmHg, 95% CI −4.86, −0.39, I 2 = 0%) than empagliflozin (−1.96 mmHg, 95% CI −3.32, −0.61, I 2 = 0%). Ipragliflozin showed a greater reduction of HbA1c (−1.34%, 95% CI −1.62, −1.06%) compared with canagliflozin (−0.84%, 95% CI −1.12, −0.56%, I 2 = 85%) and tofogliflozin (−0.83%, 95% CI −1.19, −0.47%, I 2 = 56%). Ipragliflozin also showed a greater reduction of FPG (−2.81 mmol/L, 95% CI −1.12, −0.56) compared with empagliflozin (−0.59 mmol/L, 95% CI −1.12, −0.56, I 2 = 44%), canagliflozin (−1.73 mmol/L, 95% CI −2.95, −0.55) and tofogliflozin (−1.84 mmol/L, 95% CI −2.59, −1.09, I 2 = 54%). Tofogliflozin showed a greater reduction of PBG (−3.78 mmol/L, 95% CI −4.79, −2.77) than dapagliflozin (−3.06 mmol/L, 95% CI −4.52, −1.60, I 2 = 0%). Ipragliflozin showed a lower reduction of bodyweight (−1.04 kg, 95% CI −1.39, −0.69) than dapagliflozin (−2.48 kg, 95% CI −3.31, −1.66, I 2 = 75%), empagliflozin (−2.56 kg, 95% CI −3.13, −1.99, I 2 = 0%) and canagliflozin (−2.37 kg, 95% CI −3.08, −1.66). The relative risk (RR) of hypoglycemia with canagliflozin and ipragliflozin were 1.23 (95% CI 1.13, 1.35) and 1.95 (95% CI 1.12, 3.39) compared with their control. The RR of genital infection with dapagliflozin, empagliflozin and canagliflozin were 3.94 (95% CI 1.84, 8.45), 4.01 (95% CI 1.73, 9.29) and 6.12 (95% CI 3.57, 10.48), respectively.
Third, we also took subgroup analysis based on the population of participants. In Asian‐dominated studies, compared with non‐Asian‐dominated studies, SGLT‐2i showed a greater reduction of HbA1c (−0.96%, 95% CI −1.22, −0.70%, I 2 = 71% vs −0.26%, 95% CI −0.51, 0%, I 2 = 92%), daily insulin (−6.53 IU/day, 95% CI −11, −2.05, I 2 = 98% vs −4.82 IU/day, 95% CI −7.69, −1.95, I 2 = 54%) and a lower reduction of bodyweight (−1.36 kg, 95% CI −2.10, −0.62, I 2 = 88% vs −2.72 kg, 95% CI −3.11, −2.34, I 2 = 0%), SBP (−3.12 mmHg, 95% CI −4.90, −1.35, I 2 = 0% vs −3.23 mmHg, 95% CI −5.37, −1.09, I 2 = 0%), PPG (−3.55 mmol/L, 95% CI −4.38, −2.72, I 2 = 0% vs −3.93 mmol/L, 95% CI −5.54, −2.32, I 2 = 0%) and uric acid (−13.89 μmol/L, 95% CI −25.88, −1.90 vs −29.66 μmol/L, 95% CI −49.51, −9.82, I 2 = 81%).
Sensitivity analysis
Because significant heterogeneity was identified among these pooled studies, with I 2 > 50% including HbA1c, FPG, daily insulin, bodyweight and uric acid outcomes, sensitivity analyses were carried out. The results showed that there was no change when the model was switched from a random‐effects to a fixed‐effects model by Review Manager. The influence of the total effect size is slight when it eliminates any single study (by Stata/SE 12.0 in Data S3).
Publication bias
Finally, to assess publication bias of the results (including at least 10 studies) in the present meta‐analysis, we constructed funnel plots using Review Manager. The symmetry of the HbA1c funnel plot shows that there was a low risk of publication bias (Data S4).
Safety
The relative odds ratios of adverse events between the intervention and placebo groups are shown in detail in Data S5. The incidence of hypoglycemic events in the SGLT‐2i group increased, and the RR was 1.09 (95% CI 1.02, 1.17, P < 0.01). However, there was no significant difference in severe hypoglycemic events between the two groups (RR 1.24, 95% CI 0.84, 1.84, P = 0.29). Genital infection and urinary tract infection were more common (RR 5.25, 95% CI 3.55, 7.74, P < 0.01; RR 1.29, 95% CI 1.03, 1.62, P = 0.03) in the intervention group than in the placebo group.
Discussion
Patients with diabetes, those who are overweight or obese and those with hypertension or dyslipidemia are more vulnerable to cardiovascular disease25, 26. The risk of cardiovascular disease is two‐ to fourfold higher in diabetes patients than in patients without diabetes24. It is therefore vital to study the effects of antidiabetic therapies on diabetes mellitus patients with regard to their protective effects against cardiovascular events. In the present study, we carried out a meta‐analysis to evaluate the effects of SGLT‐2is administered in addition to insulin therapy on cardiovascular risk factors in patients with type 2 diabetes mellitus. The reduction of cardiovascular risk factors, such as bodyweight, SBP and DBP, and uric acid level, was probably an intermediate outcome mediated by the cardiovascular protective effects of SGLT‐2is, as reported in previous studies8, 9, 10.
First, the present results show that SGLT‐2is, as add‐on to insulin with or without other oral antidiabetic drugs, reduced blood pressure in type 2 diabetes patients. SBP was 3.17 mmHg lower and DBP was 1.60 mmHg lower in the intervention group than in the controls. The activity of SGLT‐2is involves a mechanism that reduces the amount of glucose absorbed by inhibiting the function SGLT‐2 in renal proximal tubules. As glucose reabsorption is reduced in the kidney, the resorption of sodium from the plasma is simultaneously reduced. It is therefore possible that this mechanism might also affect natriuresis and act as a diuretic27, 28, 29. This might be the reason that SGLT‐2i exerts a hypotensive effect. Further subgroup analysis showed the long‐term (≥52 weeks) use of SGLT‐2i could obviously lower SBP more than that of short‐term use (≤24 weeks). This means SGLT‐2i had played a continuous role of lowering blood pressure. The longer it was used, the more effective it was. Among the different kinds of SGLT‐2is, tofogliflozin performed better in lowering blood pressure, which might make it a better choice for those patients with hypertension who require SGLT‐2is. This finding is extremely important, because it presents us with a therapy that provides benefits in addition to glucose control in diabetes patients with hypertension, cardiovascular disease or heart failure. These benefits include not only the effective control of glucose levels and blood pressure, but also a reduction in cardiac stress, which improves long‐term prognoses.
Hence, SGLT‐2i in addition to insulin (with or without other drugs) has shown definite effectiveness when used to control glucose levels in type 2 diabetes patients. It appears to maintain HbA1c levels for an extended period time (e.g., 104 weeks). In addition, the average dose of insulin was approximately 5.42 IU/d lower in the SGLT‐2i group, which also reflects a hypoglycemic effect. After subgroup analysis, the SGLT‐2i group showed an obviously enhanced glycemic control in short‐term studies, whereas that in long‐term studies was non‐significant or slight, which might be because of self‐adjustment of inulin doses or other oral antidiabetic drugs in the control group. Ipragliflozin showed a stronger hypoglycemic effect, including HbAlc and FPG, in the present results, which should be considered in clinical prescription.
The Asian‐dominated population seemed to be more sensitive to the hypoglycemic effect of SGLT‐2i, which might be related to the relative higher blood concentration under the same prescribed dose, because the bodyweight of Asians is lower on average than that of Americans or Europeans. Bodyweight was also lower in patients who used a combination therapy that included SGLT‐2i. These patients weighed 2.13 kg less in the SGLT‐2i group. The reduction of bodyweight was more significant in the long‐term subgroup, which was 1.5‐fold of that in the short‐term subgroup. Most SGLT‐2is had similar effects on the reduction of bodyweight, except for ipragliflozin, which had a slight effect. SGLT‐2is brought about more bodyweight reduction in the Asian‐dominated population, probably because the baseline bodyweight of the non‐Asian‐dominated population was higher.
Weight gain is the most common side‐effect of insulin therapy, and this is therefore a subject of concern in patients on a long‐term insulin regimen. Additionally, weight gain can aggravate insulin resistance30, causing glucose levels to increase, and the required doses of insulin and hypoglycemic agents to correspondingly increase. Elevated blood glucose levels can also increase blood pressure, blood lipids levels, uric acid levels and other cardiovascular risk factors. Hence, weight gain not only makes it difficult to decrease glucose levels, but also increases the risk of cardiovascular disease. Increased insulin doses brought about weight gain, and followed metabolic disorders would adversely reduce the efficiency of insulin itself and required an increase of the insulin doses, which becomes a vicious cycle. The reduction of insulin doses means the break of this vicious cycle, and then fewer side‐effects. In the present study, we showed that adding SGLT‐2is reduced the amount of insulin a patient used and had a significant effect on weight reduction. These results are intensely gratifying, because they show that this treatment increases the ease of controlling blood glucose levels and clearly reduces obesity, which is a major risk factor for cardiovascular disease.
Previous studies have shown that serum uric acid can injure vascular endothelial cells31. Furthermore, increased uric acid levels have been associated with an increased risk of coronary heart disease events, heart failure and atrial fibrillation32. The results of the present study show that in the group treated with SGLT‐2is, uric acid levels were reduced more than was observed in the control group by 26.16 μmol/L (Figure 8). These data suggest that SGLT‐2is also improve other cardiovascular disease risk factors, including hyperuricemia.
We also studied the risk factors for cardiovascular disease that are associated with lipid levels. We found that treatment with SGLT‐2is and insulin with or without other drugs did not significantly transform serum lipid levels (including total cholesterol, triglyceride, high‐density lipoprotein cholesterol and low‐density lipoprotein cholesterol levels), with a mild increase of 0.03 mmol/L both in respect to high‐density lipoprotein cholesterol and low‐density lipoprotein cholesterol compared with the placebo group. The results of the statistical analysis showed that adding SGLT‐2is did not significantly alter serum electrolyte levels (i.e., serum sodium, potassium and magnesium levels).
The present analysis of adverse events showed that the incidence rate of genital infection and urinary tract infection were significantly higher in the SGLT‐2i‐treated group than in the control group. It is vital to drink enough water, especially for older adults, to prevent the incidence of infection events. The present results also showed that the incidence rate of hypoglycemia was higher when SGLT‐2i was added. However, there was no significant difference in the number of severe hypoglycemic events between the two groups. These data show that this combination therapy is appropriate to reduce the dose of insulin or other drugs that would otherwise be required to prevent the occurrence of hypoglycemia.
A limitation of the present meta‐analysis was that most studies used the last observation carried forward method to evaluate results at the follow‐up end‐point. The duration of trials ranged from 12 to 104 weeks. The combinations of other hypoglycemic drugs varied across each study, which might have moderated the effect of SGLT‐2i on blood pressure or other indicators. Hence, although the class of drugs was identical, the specific drugs and doses were not the same, and this might have affected our analysis of heterogeneity. There were fewer extracted data, which could influence the analysis results, especially in a forest plot of PPG, uric acid and serum electrolytes. These results should therefore be confirmed by larger and longer‐term clinical follow‐up trials.
In summary, in patients with type 2 diabetes, administering SGLT‐2is combined with insulin with or without other hypoglycemic agents improved blood pressure, plasma glucose levels, bodyweight, uric acid levels and other risk factors associated with cardiovascular disease, and thereby reduced the occurrence and development of cardiovascular events.
Disclosure
The authors declare no conflict of interest.
Supporting information
Data S1| File S1 Research strategy through two methods from PubMed (before September 2017). Figure S1 Flow chart showing the study selection process. Figure S2 Cochrane risk of bias. Graph and summary.
Data S2| Figure S1 Forest plot of randomized controlled trials: effect on lipids of triglyceride. Figure S2 Forest plot of randomized controlled trials: effect on lipids of total cholesterol. Figure S3 Forest plot of randomized controlled trials: effect on lipids of high‐density lipoprotein cholesterol. Figure S4 Forest plot of randomized controlled trials: effect on lipids of low‐density lipoprotein cholesterol. Figure S5 Forest plot of randomized controlled trials: effect on serum electrolyte of sodium. Figure S6 Forest plot of randomized controlled trials: effect on serum electrolyte of potassium. Figure S7 Forest plot of randomized controlled trials: effect on serum electrolyte of magnesium. Table S1 Different sodium–glucose cotransporter 2 inhibitors and whether or not Asian‐dominated studies compared.
Data S3| Figure S1 Influence analysis of glycosylated hemoglobin. Figure S2 Influence analysis of fasting plasma glucose. Figure S3 Influence analysis of daily insulin. Figure S5 Influence analysis of bodyweight. Figure S5 Influence analysis of uric acid (μmol/L).
Data S4| Figure S1 Funnel plot of glycosylated hemoglobin.
Data S5| Summary of adverse events.
Acknowledgments
This work was supported by the National Natural Science Foundation of China (31570819), the Science and Technology Projects of Liaoning Province (2015225024), and the Local Development Foundation of Science and Technology guided by the Central Commission (2016007024).
J Diabetes Investig 2019; 10: 446–457
References
- 1. Alvarez CA, Lingvay I, Vuylsteke V, et al Cardiovascular risk in diabetes mellitus: complication of the disease or of antihyperglycemic medications. Clin Pharmacol Ther 2015; 98: 145–161. [DOI] [PMC free article] [PubMed] [Google Scholar]
- 2. Madaan T, Akhtar M, Najmi AK, et al Sodium glucose Co‐Transporter 2 (SGLT2) inhibitors: current status and future perspective. Eur J Pharm Sci 2016; 93: 244–252. [DOI] [PubMed] [Google Scholar]
- 3. Wright EM, Loo DD, Hirayama BA, et al Biology of human sodium glucose transporters. Physiol Rev 2011; 91: 733–794. [DOI] [PubMed] [Google Scholar]
- 4. Wu JH, Foote C, Blomster J, et al Effects of sodium‐glucose cotransporter‐2 inhibitors on cardiovascular events, death and major safety outcomes in adults with type 2 diabetes: a systematic review and meta‐analysis. Lancet Diabetes Endocrinol 2016; 4: 411–419. [DOI] [PubMed] [Google Scholar]
- 5. Basile JN. The potential of sodium glucose cotransporter 2 (SGLT2) inhibitors to reduce cardiovascular risk in patients with type 2 diabetes (T2DM). J Diabetes Complications 2013; 27: 280–286. [DOI] [PubMed] [Google Scholar]
- 6. Ji L, Guo L, Guo X, et al Expert guidance on clinical practice of sodium glucose co‐transporter 2 inhibitor in China. Chin J Diabetes 2016; 24: 10. [Google Scholar]
- 7. Kosiborod M, Cavender MA, Fu AZ, et al Lower risk of heart failure and death in patients initiated on sodium‐glucose cotransporter‐2 inhibitors versus other glucose‐lowering drugs: the CVD‐REAL Study (Comparative Effectiveness of Cardiovascular Outcomes in New Users of Sodium‐Glucose Cotransporter‐2 Inhibitors). Circulation 2017; 136: 249–259. [DOI] [PMC free article] [PubMed] [Google Scholar]
- 8. Zinman B, Wanner C, Lachin JM, et al Empagliflozin, cardiovascular outcomes, and mortality in Type 2 diabetes. N Engl J Med 2015; 373: 2117–2128. [DOI] [PubMed] [Google Scholar]
- 9. Ji L, Ma J, Li H, et al Dapagliflozin as monotherapy in drug‐naive Asian patients with type 2 diabetes mellitus: a randomized, blinded, prospective phase III study. Clin Ther 2014; 36: 84–100. [DOI] [PubMed] [Google Scholar]
- 10. Bode B, Stenlof K, Harris S, et al Long‐term efficacy and safety of canagliflozin over 104 weeks in patients aged 55‐80 years with type 2 diabetes. Diabetes Obes Metab 2015; 17: 294–303. [DOI] [PubMed] [Google Scholar]
- 11. Moher D, Liberati A, Tetzlaff J, et al Preferred reporting items for systematic reviews and meta‐analyses: the PRISMA statement. Ann Intern Med 2009; 151: 264–269. [DOI] [PubMed] [Google Scholar]
- 12. Higgins J, Altman DG, Gøtzsche PC, et al The Cochrane Collaboration's tool for assessing risk of bias in randomised trials. BMJ 2011; 343: d5928. [DOI] [PMC free article] [PubMed] [Google Scholar]
- 13. Higgins JP, Thompson SG. Quantifying heterogeneity in a meta‐analysis. Stat Med 2002; 21: 1539–1558. [DOI] [PubMed] [Google Scholar]
- 14. Wilding JP, Norwood P, T'joen, C , et al A study of dapagliflozin in patients with type 2 diabetes receiving high doses of insulin plus insulin sensitizers: applicability of a novel insulin‐independent treatment. Diabetes Care 2009; 32: 1656–1662. [DOI] [PMC free article] [PubMed] [Google Scholar]
- 15. Wilding JP, Woo V, Rohwedder K, et al Dapagliflozin in patients with type 2 diabetes receiving high doses of insulin: efficacy and safety over 2 years. Diabetes Obes Metab 2014; 16: 124–136. [DOI] [PubMed] [Google Scholar]
- 16. Rosenstock J, Jelaska A, Zeller C, et al Impact of empagliflozin added on to basal insulin in type 2 diabetes inadequately controled on basal insulin: a 78‐week randomized, double‐blind, placebo‐controled trial. Diabetes Obes Metab 2015; 17: 936–948. [DOI] [PMC free article] [PubMed] [Google Scholar]
- 17. Rosenstock J, Jelaska A, Frappin G, et al Improved glucose control with weight loss, lower insulin doses, and no increased hypoglycemia with empagliflozin added to titrated multiple daily injections of insulin in obese inadequately controled Type 2 diabetes. Diabetes Care 2014; 37: 1815–1823. [DOI] [PubMed] [Google Scholar]
- 18. Inagaki N, Harashima S, Maruyama N, et al Efficacy and safety of ipragliflozin as add‐on therapy to insulinin Japanese patients with type2 diabetes mellitus (IOLITE): a multi‐centre, randomized, placebo‐controled, double‐blind study. Cardiovasc Diabetol 2016; 15: 89. [DOI] [PMC free article] [PubMed] [Google Scholar]
- 19. Neal B, Perkovic V, de Zeeuw D, et al Efficacy and safety of canagliflozin, an inhibitor of sodium‐glucose cotransporter 2, when used in conjunction with insulin therapy in patients with Type 2 diabetes. Diabetes Care 2015; 38: 403–411. [DOI] [PubMed] [Google Scholar]
- 20. Ishihara H, Yamaguchi S, Nakao I, et al Efficacy and safety of ipragliflozin as add‐on therapy to insulin in Japanese patients with type 2 diabetes mellitus (IOLITE): a multi‐centre, randomized, placebo‐controlled, double‐blind study. Diabetes Obes Metab 2016; 18: 1207–1226. [DOI] [PMC free article] [PubMed] [Google Scholar]
- 21. Araki E, Onishi Y, Asano M, et al Efficacy and safety of dapagliflozin over 1 year as add‐on to insulin therapy in Japanese patients with type 2 diabetes: the DAISY (Dapagliflozin Added to patients under InSulin therapY) Trial. Diabetes Obes Metab 2017; 19: 562–570. [DOI] [PubMed] [Google Scholar]
- 22. Suzuki K, Mitsuma Y, Sato T, et al Comparison of combined tofogliflozin and glargine, tofogliflozin added to insulin, and insulin dose‐increase therapy in uncontrolled Type 2 diabetes. J Clin Med Res 2016; 8: 805–814. [DOI] [PMC free article] [PubMed] [Google Scholar]
- 23. Terauchi Y, Tamura M, Senda M, et al Efficacy and safety of tofogliflozin in Japanese patients with type 2 diabetes mellitus with inadequate glycaemic control on insulin therapy (J‐STEP/INS): results of a 16‐week randomized, double‐blind, placebo‐controlled multicentre trial Diabetes. Obes Metab 2017; 19: 1397–1407. [DOI] [PMC free article] [PubMed] [Google Scholar]
- 24. Xu Y, Wang L, He J, et al Prevalence and control of diabetes in Chinese Adults. JAMA 2013; 310: 948–958. [DOI] [PubMed] [Google Scholar]
- 25. Ding L, Xu Y, Wang L, et al The cardiometabolic risk profile of Chinese adults with diabetes: a nationwide cross‐sectional survey. J Diabetes Complications 2016; 10: 1056–8727. [DOI] [PubMed] [Google Scholar]
- 26. Snell‐Bergeon JK, Wadwa RP. Hypoglycemia, diabetes, and cardiovascular disease. Diabetes Technol Ther 2012; 14(Suppl 1): S51–S58. [DOI] [PMC free article] [PubMed] [Google Scholar]
- 27. Bailey CJ. Renal glucose reabsorption inhibitors to treat diabetes. Trends Pharmacol Sci 2011; 32: 63–71. [DOI] [PubMed] [Google Scholar]
- 28. James W. Reed. Impact of sodium–glucose co‐transporter 2 inhibitors on blood pressure. Vasc Health Risk Manag 2016; 12: 393–405. [DOI] [PMC free article] [PubMed] [Google Scholar]
- 29. Heerspink HJ, Perkins BA, Fitchett DH, et al Sodium Glucose Cotransporter 2 inhibitors in the treatment of diabetes: cardiovascular and kidney effects, potential mechanisms and clinical applications. Circulation 2016; 134: 752–772. [DOI] [PubMed] [Google Scholar]
- 30. Younk LM, Lamos EM, Davis SN, et al The cardiovascular effects of insulin. Expert Opin Drug Saf 2014; 13: 955–966. [DOI] [PubMed] [Google Scholar]
- 31. Kanbay M, Segal M, Afsar B, et al The role of uric acid in the pathogenesis of human cardiovascular disease. Heart 2013; 99: 759–766. [DOI] [PubMed] [Google Scholar]
- 32. Wu AH, Gladden JD, Ahmedc M, et al Relation of serum uric acid to cardiovascular disease. Int J Cardiol 2016; 213: 4–7. [DOI] [PubMed] [Google Scholar]
Associated Data
This section collects any data citations, data availability statements, or supplementary materials included in this article.
Supplementary Materials
Data S1| File S1 Research strategy through two methods from PubMed (before September 2017). Figure S1 Flow chart showing the study selection process. Figure S2 Cochrane risk of bias. Graph and summary.
Data S2| Figure S1 Forest plot of randomized controlled trials: effect on lipids of triglyceride. Figure S2 Forest plot of randomized controlled trials: effect on lipids of total cholesterol. Figure S3 Forest plot of randomized controlled trials: effect on lipids of high‐density lipoprotein cholesterol. Figure S4 Forest plot of randomized controlled trials: effect on lipids of low‐density lipoprotein cholesterol. Figure S5 Forest plot of randomized controlled trials: effect on serum electrolyte of sodium. Figure S6 Forest plot of randomized controlled trials: effect on serum electrolyte of potassium. Figure S7 Forest plot of randomized controlled trials: effect on serum electrolyte of magnesium. Table S1 Different sodium–glucose cotransporter 2 inhibitors and whether or not Asian‐dominated studies compared.
Data S3| Figure S1 Influence analysis of glycosylated hemoglobin. Figure S2 Influence analysis of fasting plasma glucose. Figure S3 Influence analysis of daily insulin. Figure S5 Influence analysis of bodyweight. Figure S5 Influence analysis of uric acid (μmol/L).
Data S4| Figure S1 Funnel plot of glycosylated hemoglobin.
Data S5| Summary of adverse events.