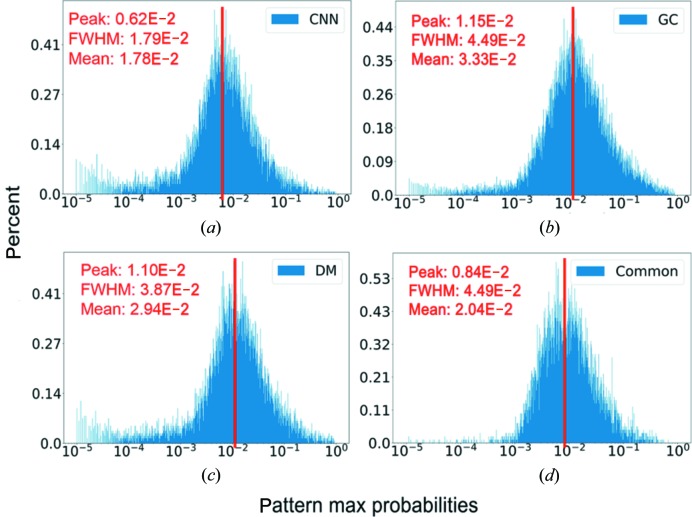
Figure 5.
The distributions of the largest probability for each pattern. For randomly sampled orientations, the expected probability should be approximately 2 × 10⁻⁵. For the CNN (a) , the GC (b) and the DM (d) methods, the percentage of patterns whose largest probabilities are smaller than 10−4 are 7.19, 2.62 and 6.76%, respectively. In comparison, the common dataset (d) has 9404 patterns, 28 of which have the largest probability smaller than 10−4 (∼0.3%).

