

Abstract
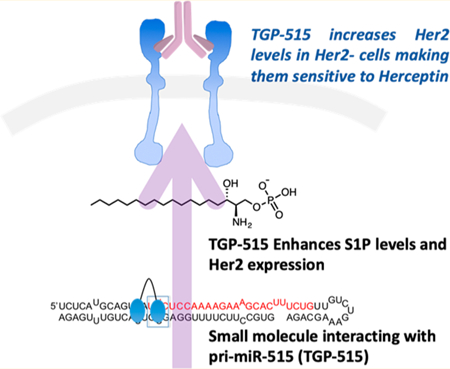
A small molecule (1) with overlapping affinity for two microRNA (miRNA) precursors was used to inform design of a dimeric compound (2) selective for one of the miRNAs. In particular, 2 selectively targets the microRNA(miR)-515 hairpin precursor to inhibit production of miR-515 that represses sphingosine kinase 1 (SK1), a key enzyme in the biosynthesis of sphingosine 1-phosphate (S1P). Application of 2 to breast cancer cells enhanced SK1 and S1P levels, triggering a migratory phenotype. Knockout of SK1, forced overexpression of miR-515, and application of a small molecule SK1 inhibitor all ablated 2’s effect on phenotype, consistent with its designed mode of action. Target profiling studies via Chem-CLIP showed that 2 bound selectively to the miR-515 hairpin precursor in cells. Global neoprotein synthesis upon addition of 2 to MCF-7 breast cancer cells demonstrated 2’s selectivity and upregulation of cancer-associated proteins regulated by S1P. The most upregulated protein was human epidermal growth factor receptor 2 (ERBB2/HER2), which is regulated by the SK1/S1P pathway and is normally not expressed in MCF-7 cells. Like triple negative breast cancer (TNBC) cells, the lack of HER2 renders them insusceptible to Herceptin and its antibody-drug conjugate Kadcyla. In addition to proteomics, an RNA-seq study supports that 2 has limited off target effects and other studies support that 2 is more selective than an oligonucleotide. We therefore hypothesized that 2 could sensitize MCF-7 cells to anti-HER2 therapies. Indeed, application of 2 sensitized cells to Herceptin. These results were confirmed in two other cell lines that express miR-515 and are HER2−, the hepatocellular carcinoma cell line HepG2 and the TNBC line MDA-MB-231. Importantly, normal breast epithelial cells (MCF-10A) that do not express miR-515 are not affected by 2. These observations suggest a precision medicine approach to sensitize HER2− cancers to approved anticancer medicines. This study has implications for broadening the therapeutic utility of known targeted cancer therapeutics by using a secondary targeted approach to render otherwise insensitive cells, sensitive to a targeted therapeutic.
Graphical Abstract
INTRODUCTION
The ENCODE project showed that 1–2% of the genome encodes for protein, yet 70–80% is transcribed into RNA.1 Not surprisingly, noncoding RNAs play a myriad of roles in cellular biology including regulating protein production.2,3 Noncoding RNA-mediated pathways are key regulators of health and disease, and often their effects can be amplified by modulating expression of transcription factors or second messengers.4 One goal in chemical biology and therapeutic development is to identify small molecules that modulate function, however, almost all of this effort has been directed toward proteins. Many small molecules that modulate proteins are identified from high-throughput screening.5
RNA is considered refractory to the development of small molecule chemical probes, with the exception of bacterial riboswitches6 and ribosomes.7 Unlike the ribosome, most potential RNA targets do not have defined long-range structures. Therefore, decoding RNAs with small molecules could have significant implications in chemical biology and drug discovery. Various screening and structure-based design approaches have found small molecules that target RNA, however, it has been challenging to identify small molecules that have biological activity.8,9 As such, only a very limited set of compounds have demonstrated bioactivity that is derived from directly engaging RNA. Of particular interest is targeting microRNA (miRNA) precursors, small noncoding RNAs that regulate gene expression.10 Inhibition of miRNA function could therefore enhance protein production. Such activities are limited for small molecules as the most common mode of action is inhibition of protein function by protein targeted probes.
Recently, an approach dubbed Inforna has enabled the sequence-based design of small molecules targeting RNA.11,12 This approach uses a database of RNA fold–small molecule interactions that are defined by a library versus library selection approach named two-dimensional combinatorial screening (2DCS).13 Rational design is initiated by inputting an RNA sequence that is converted to a structure or by using an entire transcriptome or the composite of RNAs a cell produces. This structure(s) is mined against the Inforna database to identify a lead small molecule that targets a functional site in the RNA. One perceived pitfall of small molecules that target RNA is their lack of selectivity due to RNA’s limited structural diversity; that is, multiple RNAs could have a motif that a small molecule can bind in cells. Transcriptome-wide RNA fold analysis, however, has shown that several RNA motifs can be unique to specific noncoding RNA.14
One advantage of Inforna is that it defines potential RNA motifs that bind a given small molecule with similar affinities. By searching for these motifs in the human transcriptome, off-targets can be quickly identified. In some cases, Inforna has identified lead RNA motif–small molecule interactions that are unique to a singular miRNA. In other cases, small molecules can target motifs found in multiple RNAs.11,15 Previously, we have shown that the presence of a motif in a cellular RNA alone does not determine if a small molecule will affect the target.16 Rather, bioactivity is influenced by the location of the motif (functional vs nonfunctional site) and the expression levels of the RNA, among other factors.16
The focus of this study is to determine how to engineer selectivity into a small molecule that binds two different RNA motifs similarly. Fortuitously, these studies also show that selectively modulating miRNA expression can result in the increase of production of a second messenger and affect downstream biology. We identified a small molecule (named Targaprimir-515/885; 1) that binds with similar affinity to motifs in the Drosha processing sites of the microRNA (miR)- 885 (5′UCU3′/3′AUA5′) and miR-515 (5′UUC3′/3′GCG5′) hairpin precursors.11 In cells, 1 inhibited the biogenesis of both miRNAs to a similar extent. Interestingly, Inforna identified a secondary binding site for 1 adjacent to the Drosha processing site in the miR-515 hairpin precursor that is not present in miR-885. By precisely displaying two copies of 1 on a display scaffold,17,18 we designed a dimer that selectively binds and inhibits miR-515; that is, it does not bind the miR-885 hairpin precursor or inhibit its biogenesis. Cellular inhibition of miR-515 biogenesis increased sphingosine 1-phosphate (S1P) second messenger production, triggering migratory and proliferative characteristics and enhancing human epidermal growth factor receptor 2 (HER2) levels. These studies provide a novel approach to induce otherwise insensitive cancer to be rendered sensitive to a targeted therapeutic based on their RNA expression profiles.
RESULTS
Previously, we reported the identification of Targaprimir-515/ 885 (1) as a lead compound for motifs in the Drosha processing sites of pri-miR-515 (5′UCA3′/ 3′AUU5′) and pri-miR-885 (5′UCU3′/ 3′AUA5′) by the sequence-based approach Inforna11 (Figure 1). Targaprimir-515/885 indicates the compound targets (“targ”) the primary (pri-)miRNA form (“primir”; Drosha site) of miR-515 and miR-885.11 Likewise, the name Targaprimir-515 indicates a small molecule that selectively targets pri-miR-515’s Drosha site and inhibits its biogenesis. Indeed, 1 was validated to have on-target effects in MCF-7 cells, as determined by reduced levels of mature miR-515 and miR-885 by RT-qPCR upon compound treatment.11
Figure 1.
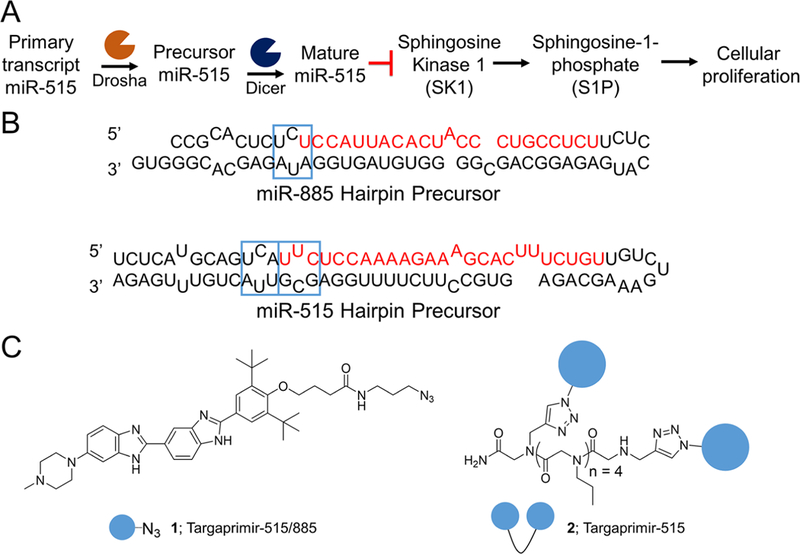
Targaprimir-515/885 (1) and Targaprimir-515 (2) target the Drosha sites in pri-miR-515. (A) Pathway of miR-515 affecting sphingosine kinase 1 (SK1), sphingosine 1-phosphate (S1P), triggering cell proliferation. (B) Secondary structures of the miR-885 and miR-515 hairpin precursors, with Drosha processing sites and 1-binding sites indicated with blue boxes. (C) Structures of 1 and 2, which have four propylamine spacers between 1 RNA-binding modules.
Given the dual targeting nature of 1 and the likelihood that other small molecules target multiple RNAs, we sought to develop approaches to engineer selectivity for one target over another. That is, these studies provide a test case for the molecular recognition of small molecules targeting RNA, as examples of motif overlap between RNA targets to which selective compounds are desired could be commonplace as the field advances.
Design of Compounds Selective for pri-miR-515
By analyzing the secondary structures of the miR-515 and miR-885 hairpin precursors, Inforna predicted that 1 should also bind the 5′UUC3′/ 3′GCG5′ motif adjacent to the CU internal loop, a secondary binding site for 1 that was not present in miR-885 (Figure 1B). Thus, we pursued a fragment assembly approach and designed homodimeric compounds displaying two 1 RNA-binding modules (Figure 1C and Figure S1A). Previously, fragment assembly has been used to selectively target other RNAs and affect downstream biology, such as the CUG RNA repeat expansions that cause myotonic dystrophy type 1 and in the hairpin precursor of oncogenic miR-96.19–21 Using this proven strategy will allow us to study if it can allow programmable differentiation between RNAs with degenerate sites.
A library of dimeric compounds was synthesized by using a peptidomimetic scaffold that displays two alkynyl submono-mers (Figure S1A).18,22,23 The azide-containing 1 RNA-binding modules were then coupled to the peptoid backbone by using Cu-catalyzed azide–alkyne click chemistry.24,25 To alter the distance between the RNA-binding modules, different numbers of propylamine spacers were placed between alkynyl submonomers.
The library of dimeric assembled fragments was then tested for inhibiting Drosha processing of pri-miR-515 in vitro. These studies showed that the dimer with four propylamine spacers between RNA-binding modules was the most potent, inhibiting ∼80% of processing at 1 μM (Figure S1B). Previously, it has been shown that 2–4 propylamine modules are optimal to span the distance between two base pairs separating RNA 1 × 1 nucleotide internal loops; those data are mirrored here.18 Given the bioactivity of the dimer with four propylamine spacers (vide inf ra), we named the compound Targaprimir-515 (2), indicating selective modulation of miR-515 (Figure 1B). Additionally, these studies mapped the binding site of 2 to the pri-miRNA’s Drosha processing site, as expected.
Binding Affinity and Selectivity of 1 and 2.
Next, the binding affinities of dimeric 2 and monomeric 1 were measured (Figure S2A and Table S1). Not surprisingly, neither binds DNA as steric bulk in the benzyl group inhibits DNA binding.26,27 As expected, 1 binds the Drosha sites in pri-miR-885 (RNA 1) and pri-miR-515 (RNA 2) similarly, with Kd’s of 9.0 ± 1.0 μM and 12 ± 2.1 μM, respectively. The affinity of 1 for the RNA motif adjacent to the Drosha site in pri-miR-515 (RNA 3) is similar, with a Kd of 7.5 ± 0.7 μM. Binding of 1 to an RNA that displays both the Drosha site in pri-miR-515 and the adjacent RNA motif (RNA 4) affords a Kd of 15 ± 1.9 μM (Table S1). Most interestingly, dimeric fragment display of 1, that is, compound 2, ablated binding to the RNA with a singular binding site (Kd > 100 μM) but increased affinity for the RNA that contains both binding sites (the Drosha site + adjacent motif), with a Kd of 0.06 ± 0.006 μM (Table S1). The power of fragment assembly28 is illustrated by comparing the affinities of 1 and 2 for RNA 4: Affinity and selectivity are enhanced by ∼250-fold and >3200-fold, respectively. Importantly, 2 was tested for binding to pri-miR-515, pri-miR-21, pri-miR-107, and tRNA. Saturable binding was only observed for pri-miR-515 with a Kd of 900 nM; Kd’s for the other targets were not measurable (Figure S2B). These series of measurements demonstrated 2’s selectivity for the RNA target for which it was designed.
To understand why dimeric display ablated binding of 2 to RNAs with a singular binding site, a series of studies were completed. We first investigated the effect of the peptoid scaffold (1a, Figure S2C and Table S1) and the triazole unit (1b, Figure S2C and Table S1) on the binding of monomer 1 to RNA 4 (contains two binding sites for 1). Only a modest effect on affinity was observed for either modification (Table S1), indicating they do not significantly contribute to binding affinity. Self-structure has previously been observed to impede binding and enhance selectivity with nucleic acids.29 That is, the small molecule’s intramolecular structure would have to be disrupted for effective binding; the penalty for disruption may be overcome by binding two sites simultaneously but not by binding a singular site. To determine if 2 is self-structured, thermal melting experiments were completed. Indeed, a change in absorbance as a function of temperature was observed (Figure S3A). As the melting temperature (51 ± 0.9 °C) is independent of concentration (8-fold range), 2 adopts an intramolecular structure (Figure S3B). No similar effect was observed for 1. The melting curves for 2 were fit to provide thermodynamic parameters30 yielding a ∆G°37 of −1.2 ± 0.17 kcal/mol (≈10-fold in an equilibrium binding constant), ∆H°37 of −28 ± 3.4 kcal/mol, and ∆S°37 of −85 ± 10 e.u. (Figure S3B). Self-structure only accounts for a modest amount (≈10-fold) of the enhanced selectivity of 2 for pri-miR-515 over pri-miR-885 model RNAs, indicating there are additional contributing factors such as binding cooperativity or pre-organization of the RNA-binding modules by the peptoid backbone.31
In Vitro Chemical Cross-Linking and Isolation by Pull Down (Chem-CLIP) to Assess Selectivity.
We further assessed the in vitro selectivity of 1 and 2 by using chemical cross-linking and isolation by pull down (Chem-CLIP). Chem-CLIP is a target profiling approach for small molecules and can be applied in vitro or in cells.16,32–35 Briefly, a small molecule is appended with purification (biotin) and cross-linking (chlor-ambucil; CA) modules. The cross-linked RNA-small molecule complexes can then be purified by using streptavidin resin. Competitive Chem-CLIP (C-Chem-CLIP) is a complemetary approach in which binding of the parent compound can be assessed directly by competing for binding of the RNA targets with the Chem-CLIP probe.
To enable Chem-CLIP for these studies, a derivative of Targaprimir-515/885 was synthesized, Targaprimir-515/885-CA-Biotin (3) (Figure 2A). A control compound lacking the RNA-binding module was also synthesized (4) (Figure 2A). The ability of the two compounds to react with the miR-515 and miR-885 hairpin precursors was assessed in vitro. These studies showed that only 3 reacted with the targets and reacted with them to similar extents, as expected based on the similar binding affinity of the parent compound (1) (Figure S4). That is, 3 underwent a proximity-based reaction due to the presence of the RNA-binding module. A series of C-Chem-CLIP experiments were then completed with 1 and 2 to compete off reaction of the RNAs with 3. Interestingly, 1 (monomeric Targaprimir-515/885) competed off pull-down to both targets similarly, while 2 (dimeric Targaprimir-515) only significantly competed off binding to the miR-515 hairpin precursor (Figure 2B), mirroring the noncovalent binding results (Table S1).
Figure 2.
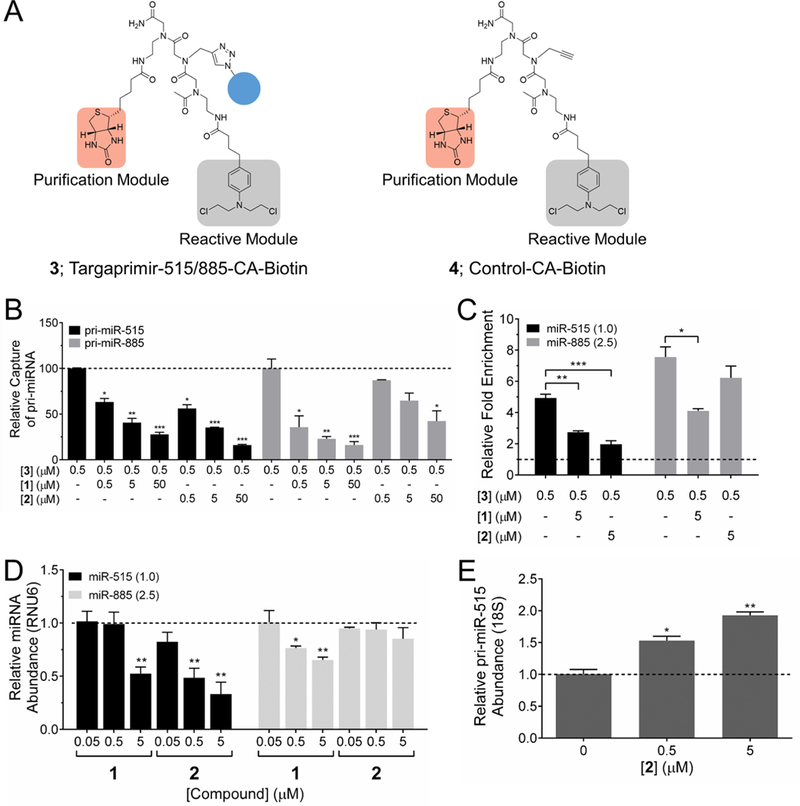
Studying target engagement via Chem-CLIP and C-Chem-CLIP and the effects of compounds on miRNA biogenesis in MCF-7 cells. (A) Structures of Targaprimir-515/885-CA-Biotin (3), which is comprised of the RNA-binding module 1, a biotin purification module and a cross-linking chlorambucil (CA) module, and control compound Control CA-Biotin (4), which lacks the RNA-binding module. (B) C-Chem-CLIP of pri-miR-515 and pri-miR-885 by using increasing concentrations of 1 or 2 to compete with 3 (0.5 μM) after 16 h of incubation. Data represent mean ± s.e.m. (n ≥ 3). *p < 0.05, **p < 0.01, ***p < 0.001 compared to Chem-CLIP pull-down samples without competitor, as determined by a two-tailed Student t test. (C) Treatment of cells with 3 affords enrichment of miR-515 and miR-885 in the pulled down fraction. Addition of 1 competes off reaction of 3 with miR-515 and miR-885, while 2 only competes off reaction of 3 with miR-515. Both results indicate on-target effects in cells after 24 h of treatment. Above the dotted line indicates enriched levels of the measured miRNA in the pulled down fraction versus the levels of the miRNA before pull-down. Relative expression levels of miRNAs are shown in parentheses. *p < 0.05, **p < 0.01, ***p < 0.001 compared to Chem-CLIP samples, as determined by a two-tailed Student t test. (D) RT-qPCR analysis of miR-515 and miR-885 production upon compound treatment after 48 h. 1 reduces the levels of mature miR-515 and miR-885 similarly, while 2 only reduces levels of miR-515. Dotted line represents levels of miRNA in untreated samples. Data represent mean ± s.e.m. (n ≥ 3). *p < 0.05, **p < 0.01, compared to untreated samples, as determined by a two-tailed Student t test. (E) RT-qPCR analysis of the effect of 2 on pri-miR-515 levels after 48 h. Data represent mean ± s.e.m. (n ≥ 3). *p < 0.05, **p < 0.01 compared to untreated samples, as determined by a two-tailed Student t test.
Compounds 1 and 2 Bind the Desired Targets in MCF-7 Cells: Chem-CLIP and C-Chem-CLIP
Given the above in vitro activity of the compounds, we used Chem-CLIP and C-Chem-CLIP to study target engagement in MCF-7 breast cancer cells by using probe compound 3, which is freely cell-permeable and nontoxic to cells (Figure S5). Given the well-known differences in RNA folding in vitro and in cells,36–39 such cellular profiling is of great importance. Further, artifacts have been observed for RNA-protein interactions detected via noncovalent pull-down due to re-association of proteins during the complex isolation.40
To investigate target engagement of 3 in MCF-7 cells, we measured the enrichment of miR-515 and miR-885 before and after pull-down by RT-qPCR. Indeed, 3 enriched levels of miR-515 and miR-885 by 5- and 7-fold, respectively, in the pulled down fraction as compared to the target levels before pull-down (Figure 2C). Importantly, enrichment of miR-515 and miR-885 by 3 is significantly greater than background RNA pulled down by 4, a control Chem-CLIP probe lacking RNA-binding modules (Figure S6). Thus, proximity-based reaction occurs both in vitro and in cells.
To analyze target engagement of 1 and 2 themselves, a C-Chem-CLIP experiment was performed by treating cells with the unreactive, parent compounds, followed by treatment with 3. The pull-down of miR-515 by 3 was inhibited by ∼50% at 5 μM of 1, which correlates well with the IC50 of 1 for reduction of mature miR-515 (Figure 2C). As expected, compound 2 (5 μM) competed off reaction of 3 with miR-515 to a greater extent, as 2 has a greater affinity for binding to pri-miR-515 than 1 (Figure 2C). Notably, pull-down of miR-885 is significantly competed off by 1 and not significantly competed off by 2, indicating the selectivity of 2 for miR-515 over miR-885 (Figure 2C). Evidently, the in vitro enhancement in binding selectivity is also observed in cells, as measured by C-Chem-CLIP.
Cellular Activity As Studied by miRNA Levels
Given the favorable in vitro and cellular C-Chem-CLIP data for 1 and 2, we evaluated their biological activities and selectivities in MCF-7 cells, in which both miRNAs are expressed at measurable levels.41,42 Following compound treatment, mature levels of miR-515 and miR-885 were measured by RT-qPCR. As expected, 1 decreased levels of both miR-515 and miR-885 similarly with IC50’s of ∼2 μM (Figure 2D). In contrast, dimeric 2 only significantly affected miR-515 with an IC50 of ∼0.2 μM (Figure 2D). These results illustrate two important points: (i) The enhanced in vitro binding affinity correlated with target selectivity in cells, as 2 does not reduce levels of miR-885; and (ii) 2 is >10-fold more potent than 1 for reduction of mature miR-515 levels. To investigate compound mode of action, we measured levels of pri-miR-515 by RT-qPCR upon treatment with 2 (Figure 2E). An increase in pri-miR-515 levels was observed upon treatment, supporting the hypothesis that 2 reduced mature miR-515 levels by inhibition of pri-miRNA processing. Importantly, 2 also inhibited the production of both the 5p and the 3p strands of miR-515, further supporting the compound affecting biogenesis (Figure S7).
Compound 2 was also benchmarked against oligonucleo-tides targeting mature miR-515. The cellular activity and selectivity of a Vivo-Morpholino antisense oligonucleotide (Gene Tools, LLC) that targets the miR-515–5p, the more abundant of the two mature miRNAs in cells (Anti-515–5p Vivo-Morpholino), was studied. Vivo-Morpholino oligonucleo-tides contain an octa-guanidinium dendrimer that confers cellular permeability. The oligonucleotide reduced levels of mature miR-515 in MCF-7 cells with an IC50 of ∼6 μM (Figure S8A). Both 2 and the Anti-515–5p Vivo-Morpholino show similar selectivity profiles among miRNAs predicted to target the 3′ UTR of SK1 mRNA, a known miR-515–5p target, by TargetScan41,43 (Figure S8B).
The presence of two degenerate RNA motifs in miR-515 and miR-885 does not mean the ligand binding capacity of motifs are exclusive to these two miRNAs. Therefore, we studied the effect of 2 on structurally similar RNAs containing the motifs found in the Drosha sites of miR-885 and miR-515 (dubbed RNA isoforms).16 Both 2 and the Anti-515–5p Vivo-Morpholino only affected miR-515 levels, indicating that both compounds target miR-515 even among structurally similar RNAs. In addition, a profiling experiment was completed to study the effect of 2 on all miRNAs expressed at measurable levels in MCF-7 cells (Figure 3A). A volcano plot is used to represent these data, as both the confidence and the fold-change can be readily assessed. As expected, both the oligonucleotide and 2 affected levels of miR-515–5p to the greatest extent. In addition to miR-515–5p, however, the oligonucleotide affects other miRNAs significantly including miR-525–5p, miR-23b-5p, and miR-200b-3p, suggesting that at the concentration used, 2 has selectivity that rivals or exceeds that of Anti-515–5p Vivo-Morpholino (Figure 3A and Figure S9A; p < 0.01). These off-target binding events are traced to binding to miRNAs without perfect complementarity, as indicated by isothermal titration calorimetry (ITC) binding studies (Figure S9B–G).
Figure 3.
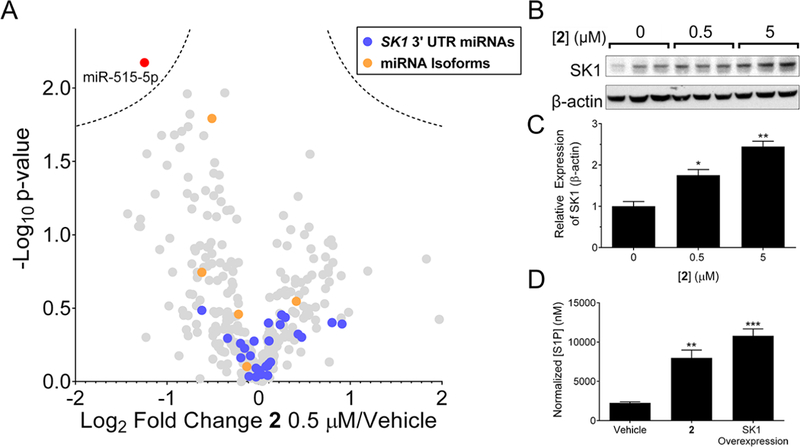
Evaluation of downstream effects upon miR-515 knockdown by 2. (A) Volcano plot representing fold change and p-values of samples treated with 0.5 μM of 2 compared to untreated samples after 48 h of treatment. Data represent mean; dotted lines represent a false discovery rate of 1% and an S0 of 0.1, indicating an adjusted p-value of 0.01; p-values were determined by a two-tailed Student t test when compared to untreated samples. Red point, effect on miR-515; blue points, miRNAs predicted by TargetScan to bind to the SK1 3′ UTR; orange points, RNA isoforms to miR-515 hairpin precursor; and, gray points, all other expressed miRNAs in MCF-7 cells. (B) Representative Western blot image of SK1 protein as a function of compound concentration after 48 h of treatment. (C) Quantification of SK1 protein expression relative to loading control β-actin. (D) Effect of 2 (0.5 μM) or SK1 overexpression on S1P second messenger levels as measured by ELISA after 48 h of treatment. Data represent mean ± s.e.m. (n ≥ 3). *p < 0.05, **p < 0.01 compared to untreated samples, as determined by a two-tailed Student t test.
Comparison to Compounds Designed to Target Other Noncoding RNAs
Various other monomeric and dimeric compounds that have structures related, yet different, to 1 and 2 have been shown to modulate the biological activity of noncoding RNAs in cells. For example, 2H-4KNMeS (5),21 Targaprimir-96 (6),19 and Targapremir-210 (7)16 have each been shown to target and affect the biology of r(CUG) repeat expansions that cause myotonic dystrophy 1, miR-96 that is oncogenic, and miR-210 that contributes to metastasis in various cancers, respectively. To assess the cellular selectivity of these compounds, each was tested for affecting miR-515 levels. As expected, only 2 affected miR-515 levels in MCF-7 cells (Figure S10). Thus, the specific identity of the RNA-binding modules and the spacing between them influences the cellular targeting profile of a given compound. Further, these studies demonstrate the utility of each probe compound to affect and study their cognate cellular target.
Cellular Activity of 1 and 2: Downstream Protein Levels (SK1), Generation of a Second Messenger (S1P), and Phenotype
It has previously been shown that miR-515 represses sphingosine kinase 1 (SK1) protein levels and hence levels of the second messenger sphingosine 1-phosphate (S1P) (Figure 1A).41 The S1P second messenger mediates pro- survival and growth signals leading to migration.44 Indeed, various anti-inflammatories in clinical trials inhibit enzymes that metabolize S1P or agonize S1P receptors.45–48 We therefore studied the effect of miR-515 inhibition by 2 on SK1 protein expression, production of S1P, and the migratory properties of cells (Figure 1A). Application of 2 at concentrations that inhibit miR-515 biogenesis resulted in de-repression of SK1, enhancing levels by ∼1.8-fold and ∼2.5-fold when 0.5 or 5 μM of compound, respectively, was added to MCF-7 cells (Figure 3B,C, and Figure S11). SK1 protein catalyzes the last step in the cellular biosynthesis of S1P second messenger (Figure 1A). Thus, de-repression of SK1 by 2 should increase the levels of the second messenger S1P. Indeed, addition of 0.5 μM of 2 to MCF-7 cells or plasmid overexpression of SK1 enhanced S1P levels by ∼4-fold and ∼5-fold, respectively, as measured by ELISA (Figure 3D).
The expression of S1P is associated with cellular proliferation and migration in many cells including cancer cells.49 To study the effect of 2 on this phenotype, we completed a cellular migration assay. Previously, MCF-7 cells have been used as a negative control in traditional cell migration assays, due to their reduced migratory properties.50 Upon treatment with 0.5 μM of 2, the migration of MCF-7 cells was enhanced by ∼2.5-fold (Figure 4). Importantly, treating with siRNA targeting SK1 mRNA ablates the enhanced migration with 2-treatment, further supporting that the stimulated migration of MCF-7 cells by 2 is SK1 pathway-dependent (Figure 4A,B). These results were recapitulated upon chemical inhibition by SKI-178, a selective SK1 inhibitor (Figure 4C,D).51 Migration studies were also completed in MDA-MB-231 TNBC cells, and similar results were obtained (Figure S12). Each of these studies shows that 2 is a useful and selective cellular probe to modulate SK1 and S1P biology.
Figure 4.
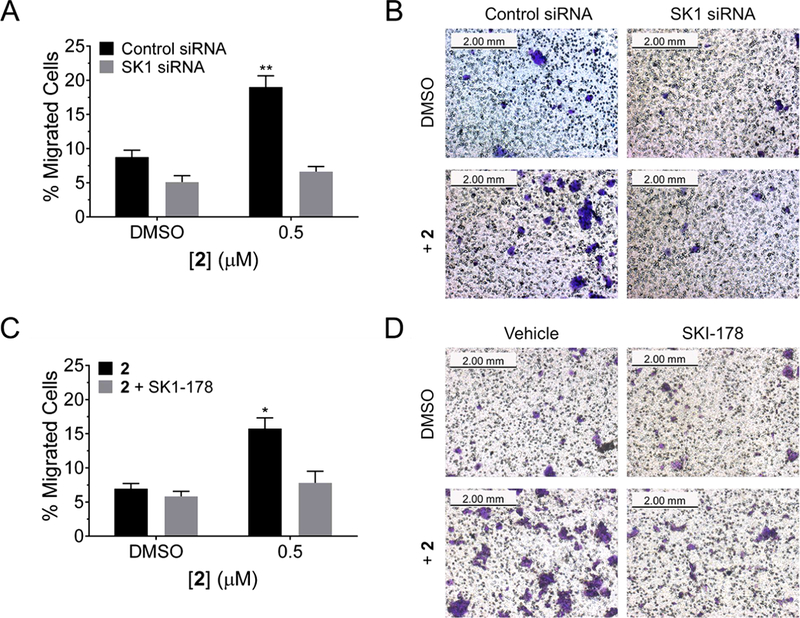
Enhanced migration of MCF-7 cells is observed with 2 treatment. (A) Quantification of cell migration, with and without SK1 siRNA knockout. Enhanced migration of crystal violet stained MCF-7 cells was observed, indicating phenotypic modification through an SK1-mediated pathway. (B) Representative images of cell migration with 2 and/or SK1 siRNA treatment after 16 h. (C) Quantification of cell migration with and without treatment with 2 (0.5 μM) and/or SKI-178 (1 μM), a selective SK1 inhibitor. Enhanced migration of crystal violet stained MCF-7 cells is observed, indicating phenotypic modification through an SK1-mediated pathway. (D) Representative images of cell migration with 2 and/or SKI-178 treatment after 16 h. Data represent mean ± s.e.m. (n ≥ 3, 4 fields of view). *p < 0.05 compared to untreated samples, as determined by a two-tailed Student t test.
Sphingosine kinase 2 (SK2) has significant homology to SK1 and also functions to modulate the S1P pathway, therefore the effect of 2 on SK2 was also studied.52 The SK2 protein was not significantly abundant both in protein and transcript levels in MCF-7 cells, as measured by Western blotting and RT-qPCR, respectively (Figure S13A,B). No effect on SK2 was observed with compound treatment or with SK1-targeted siRNA transfection, further demonstrating the selectivity of 2 to affect SK1 (Figure S13A).
Reduction of Compound Activity upon Induction of miR-515
To further study that 2 elicited its effect via the miR-515-SK1 circuit, a doxycycline-inducible miR-515 system in MCF-7 cells was established. Cells were transiently transfected with an inducible pri-miR-515 expressing plasmid (pmR i −51 5) or the corresponding empty vector (pmRi_empty) and induced with doxycycline for 24 h. Upon doxycycline treatment, mature and pri-miR-515 levels are 6-fold and 16-fold greater than MCF-7 cells without induction, respectively (Figure S14A–C). An overexpression of pri-miR-515 ablated 2’s activity, miR-497 levels, a miRNA not regulated by 2 or the SK1 pathway, were unaffected by 2 treatment with or without induction of pri-miR-515 (Figure S14B–D). As expected, 2 also did not enhance the migration of MCF-7 cells in which pri-miR-515 was overexpressed (Figure S14E). Taken together, these data indicate that the observed modulation of miR-515 levels and increased migration of MCF-7 are caused by 2.
Alternate Pathways Affected by miR-515 Biogenesis
In addition to SK1, miR-515–5p has been reported to target the 3′ UTRs of Aromatase, frizzled class 5 receptor (FZD5), and glial cell missing 1 (GCM1) in a trophoblast cell line.53 Among these potential targets, only FZD5 is expressed endogenously in MCF-7 at detectable levels, with an abundance ∼50% that of SK1, as studied via RT-qPCR (Figure S15A). The FZD5 protein is a receptor involved in the wingless/integrated (Wnt) signaling pathway and enhances cell proliferation and migration in cancer cells.54,55 Upon treatment with 5 μM of 2, MCF-7 cells had a ∼1.5-fold greater expression of FZD5, as observed by Western blotting (Figure S15B). The de-repression of FZD5 by miR-515 inhibition was followed by a subsequent increase in cell proliferation and migration of MCF-7 cells (Figure S15C,D), which were ablated upon treatment with a FZD5-targeting siRNA, indicating a potential role for miR-515 and FZD5 in these processes.
Studying the Global Proteome Response to Application of 2 to MCF-7 Cells
To investigate the overall effect of 2 on the proteome, newly synthesized proteins were analyzed by global proteomics using incorporation of homopropargyl-glycine (HPG) as a clickable methionine analog56 and subsequent click-conjugation to biotin azide, enrichment with streptavidin, and analysis by LC-MS/MS (Figure 5A). Compared to vehicle control, cells treated with 0.5 or 1 μM of 2 had ∼1.2 and ∼1.4-fold (p < 0.01) higher SK1 expression, respectively, in agreement with results from Western blotting (Figure 5B). Overall, out of ∼4300 proteins analyzed, we observed 180 proteins with upregulated expression (>50% increase) with 1 μM of 2 (Figure 5C, Figure S16, and Supporting Information), including increased synthesis of multiple members of critical pro-proliferative signaling path-ways such as PI3K-AKT, HER2, and TGFβ (Figure 5C and Figure S16) that are associated with a cancer phenotype induced via S1P production.57–60 Notably, upon treatment with 1 μM of 2, a ∼4-fold increase in HER2 was observed in the normally HER2-deficient MCF-7 cell line, indicating increased cell survival and proliferation. The protein SK2 was not observed in the global proteomics studies (Supporting Information), correlating with our previous RT-qPCR and Western blot measurements (Figure S13A). Overall, these data demonstrate that the modest elevation of SK1 expression upon 2 treatment resulted in a significant proliferative shift.
Figure 5.
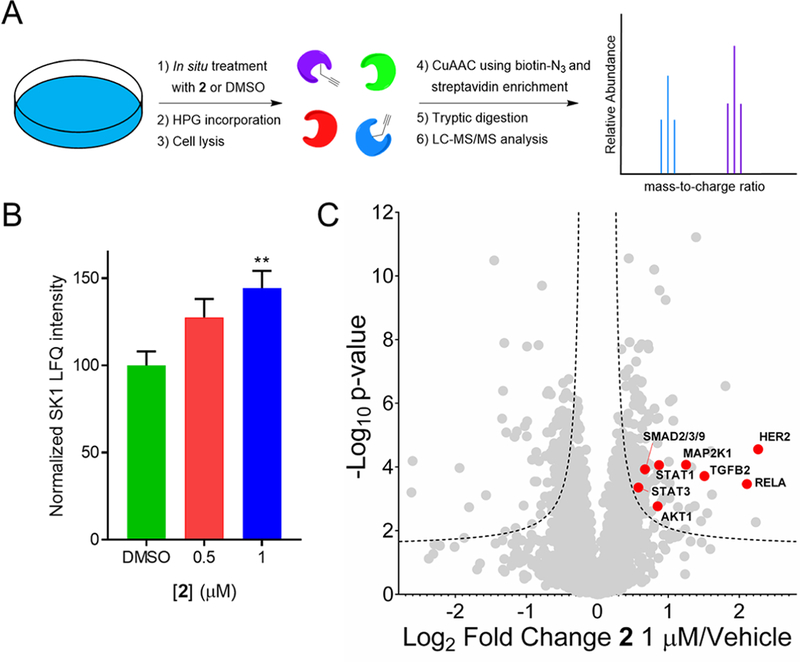
Effect of Targaprimir-515 (2) on protein expression in MCF-7 cells evaluated by global proteomics. (A) General scheme showing profiling of newly synthesized proteins using incorporation of homopropargylglycine (HPG) into the proteome. (B) Label-free quantification (LFQ) intensity of SK1 upon treatment with 0.5 or 1 μM 2 for 48 h. Data represent mean ± s.e.m (n = 6). **p < 0.01 compared to DMSO samples, as determined by a two-tailed Student t test. (C) Changes in protein expression caused by treatment with 1 μM 2 for 48 h. LC-MS/MS and MaxQuant analysis showed an upregulation of 4% of proteins (180/4378). Dotted lines represent a false discovery rate of 1% and an S0 of 0.1, indicating an adjusted p-value of 0.01. HER2 is the most upregulated protein (∼4-fold) with 2 treatment. Pathway analysis of these proteins revealed a role in cellular growth and proliferation, as expected upon SK1 pathway activation.
To further support global proteomics data, RNA-Seq was run on an earlier time point (24 h) to study the transcriptome-wide effect of 2 treatment. Differentially expressed genes between the treated and untreated samples were identified using quantification and analysis from Kallisto and Sleuth packages in R (Figure S14). The majority of genes were not significantly affected by compound treatment (17992/18044 genes; 99.7%), demonstrating limited off-target effects and suggesting that modest changes in the transcriptome with 2 treatment can result in a large effect on the proteome. This has been previously demonstrated in many cases for the biological impacts of miRs.61,62 Importantly, SK1 and HER2 transcript levels were increased by 17% and 6% after only 24 h, respectively, comparable with RT-qPCR (Figure S17).
To further functionally annotate the RNA-Seq data set, outcomes from the differential expression analysis with adjusted p-values <0.05 were analyzed using Ingenuity Pathway Analysis (Qiagen). This analysis identified on-target pathways being upstream regulators (ERBB2 [HER2], p-value of overlap = 0.03; TGFB1, p-value of overlap = 0.02) and specific gene networks associated with increased cellular proliferation of breast cancer cell lines (p-value = 0.02) and decreased apoptosis of breast cancer cell lines (p-value = 0.006), indicating that TGP-515 treatment does effect on-target cellular proliferation pathways. Thus, the RNA-seq data set corroborated the effects that are observed in neoprotein synthesis analysis on the proteome (Table S2).
Compound 2 Sensitizes MCF-7 to Herceptin and Kadcyla via SK1 Induction
Herceptin is a monoclonal antibody used to treat approximately 30% of breast cancer cases that are positive for staining of the HER2 receptor (HER2+).63 The MCF-7 cells used here are classified as HER2 negative (HER2–). Upon treatment with 2, HER2 levels were increased by 1.7-fold as determined by ELISA of cell lysates and 1.6-fold as determined by immunostaining and analysis by flow cytometry, indicating expression is enhanced on the cell surface (Figure 6A,B). The observation that reduction of miR-515 levels led to induction of HER2 suggested that 2 could render MCF-7 cells HER2+ and hence sensitize them to Herceptin.
Figure 6.
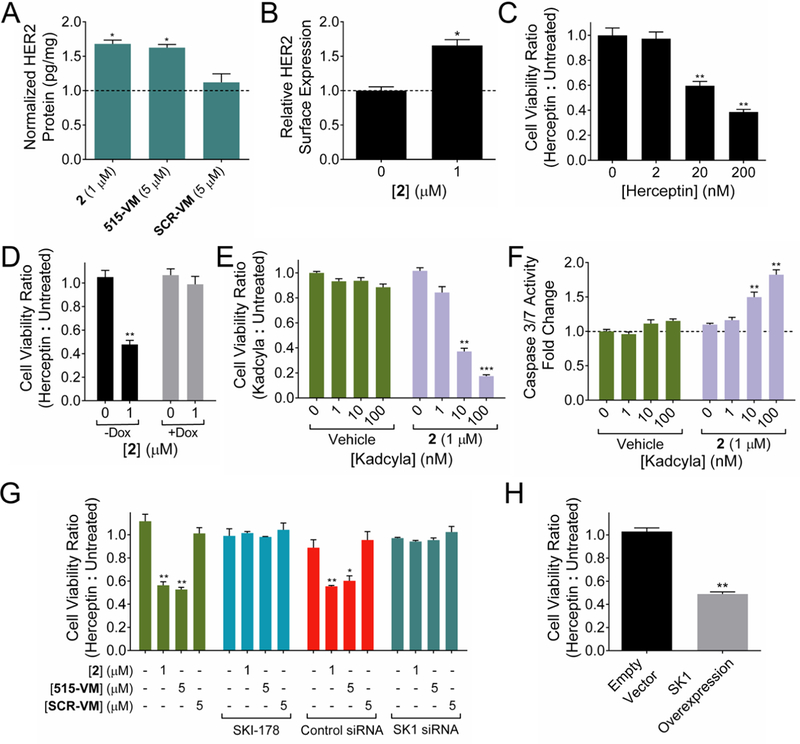
Addition of Targaprimir-515 (2) sensitizes MCF-7 cells to Herceptin and Kadcyla by stimulating the expression of HER2. (A) Addition of 2 to MCF-7 cells for 48 h enhances HER2 protein expression as measured via ELISA. Dotted line represents HER2 protein expression in untreated cells. (B) Addition of 2 to MCF-7 cells enhances cell surface expression of HER2 via flow cytometry. Dotted line represents HER2 surface expression in untreated cells. (C) 2 sensitizes MCF-7 cells to Herceptin-mediated loss of cell viability in a dose-dependent fashion. “Cell Viability Ratio (Herceptin:Untreated)” is the ratio between the cell viability of Herceptin treated cells and untreated cells. (D) Forced overexpression of miR-515 on a doxycycline inducible plasmid ablated Herceptin (20 nM) sensitivity in the presence of doxycycline (+Dox) but not in its absence (−Dox). (E) 2 stimulated Kadcyla-mediated cell death in otherwise insensitive MCF-7 cells. (F) Increased apoptotic activity in MCF-7 cells treated with 2 and Kadcyla as measured by Caspase 3/7 activity. Dotted line represents apoptotic activity in untreated cells. (G) Addition of SKI-178, a SK1 inhibitor, or a siRNA targeting SK1, ablated Herceptin sensitivity, whereas a scrambled control did not. 515-VM, Anti-515–5p Vivo-Morpholino; SCR-VM, scrambled control Vivo-Morpholino. (H) Transfection of SK1 plasmid into MCF-7 enhanced Herceptin (20 nM) sensitivity. Measurements were taken after 24 h incubation with 2, followed by 48 h of either Herceptin or Kadcyla treatment. *p < 0.05, **p < 0.01, ***p < 0.001 compared to untreated or vehicle samples, as determined by a two-tailed Student t test.
To test this hypothesis, MCF-7 cells were pretreated with 1 μM of 2, followed by treatment with Herceptin. Indeed, cells pretreated with 2 had decreased cellular viability in a Herceptin dose-dependent manner (Figure 6C). We next tested the effect of Herceptin sensitization by 2 using MCF-7 cells expressing pri-miR-515 on a doxycycline-inducible promoter. A side-by-side comparison of induced and non-induced cells was completed, the expectation of which is that increased expression of pri-miR-515 should decrease 2’s ability to induce Herceptin sensitivity as measured by cell viability. Notably, 2 was only able to sensitize cells expressing endogenous levels of pri-miR-515 to Herceptin treatment (Figure 6D). In contrast, cells induced to express increased levels of pri-miR-515 relative to wild-type MCF-7 were insensitive to Herceptin either in the presence or absence of 2 (Figure 6D). Likewise, MCF-10A healthy breast epithelial cells that do not express miR-515 at appreciable levels were not sensitized to Herceptin by 2 treatment (Figure S18). Collectively, these studies suggest that 2 is a precision sensitizer of HER2– breast cancer cells to Herceptin. Further, Herceptin sensitivity can be traced to inhibition of miR-515 biogenesis by 2.
Kadcyla is an antibody drug conjugate consisting of Herceptin conjugated to emtansine that targets HER2+ cells and triggers apoptosis via delivery of the emtansine cytotoxin payload.64 Not surprisingly, like Herceptin, MCF-7 cells are insensitive to Kadclya treatment. However, treatment of MCF-7 cells with 2 rendered them sensitive to Kadcyla, as measured via apoptosis. Significant induction of apoptosis and decreased cellular viability were observed with as little as 10 nM of Kadcyla, while vehicle treated cells were unaffected (Figure 6E,F). Notably, sensitization to Kadcyla was also observed when MDA-MB-231 TNBC and HepG2 heptatocellular carcinoma cells (both HER2–) were pretreated with 2 at 8 μM and 1 μM, respectively (Figure S19). As treatments for TNBC and other HER2– cancers are limited to less selective therapeutic options, the use of 2 to induce increased HER2 expression to render these cells sensitive to current HER2-targeting therapies is a valuable application of a miR-515 inhibiting small molecule.
We next explored if 2’s effect on HER2 expression was direct. That is, if miR-515 regulates HER2 by binding to its 3′ UTR, then chemical inhibition of miR-515 biogenesis by 2 would act to directly increase protein expression. To test this hypothesis, a luciferase reporter containing the miR-515–5p binding site in the HER2 3′ UTR was used. In contrast to our luciferase studies with luciferase fused to the 3′ UTR of SK1, no effect was observed in transiently transfected cells expressing the HER2 3′ UTR upon treatment with 2, excluding a direct effect on HER2 translation (Figure S18A). Rather, increased HER2 levels were due to downstream signaling from the SK1 pathway (Figure S20A). In support of this hypothesis, HER2 mRNA levels were only significantly upregulated after 48 h of 2 treatment, while SK1 mRNA levels were increased after both 24 and 48 h (Figure S20B).
To further investigate the pathway of HER2 induction and hence Herceptin sensitivity, SK1 was inhibited with the molecule inhibitor SKI-17851 or knocked down with an siRNA. These studies indicated that the 2-mediated Herceptin sensitivity was indeed dependent on the SK1 pathway (Figure 6G), as treatment with SKI-178 or siRNA both ablated 2’s sensitizing effect. To further confirm that the de-repression of SK1 was responsible for the increased Herceptin sensitivity of MCF-7 cells, SK1 was overexpressed in MCF-7 cells (Figure S21), and the Herceptin sensitivity measured without 2-treatment. A similar sensitivity to Herceptin was observed (Figure 6H). Collectively, these loss- and gain-of-function experiments with SK1 support that the Herceptin sensitivity gained by treatment with 2 is dependent on miR-515 and its ability to regulate expression of SK1.
DISCUSSION
This study has several implications, ranging from design of cell-permeable chemical probes for recognition of noncoding RNAs to using proteomics and RNA-seq and various validation approaches to study RNA-targeting small molecules and to developing targeted cancer therapies. The design and discovery of small molecules that target human RNAs and elicit a biological effect has been a long-standing problem in chemical biology. Our lead identification strategy, Inforna, has provided compounds that target RNAs in cells and inhibit their function in various disease indications. These studies suggest that other high priority, disease-causing RNA could be targetable as more data are available defining the RNA motifs that bind small molecules, providing design rules.9,65–68
The selectivity of a small molecule for its target is an important consideration in the design of chemical probes. Although RNA is perceived to lack structural diversity, this study provides a framework to identify potential off-targets computationally (Inforna) and shows how to design selectivity for the desired target. Further, our previous studies targeting the miR-210 precursor showed that cellular selectivity is dependent upon not only the identity of the targetable site but also its location within the RNA target, that is, in a functional region such as a nuclease processing site.16 In addition, the relative expression levels of on- and off-targets govern occupancy in cells.16 Here, the miR-515 and miR-885 hairpin precursors are expressed at similar levels and have structural homology and similar monomeric ligand binding capacity. The designer dimer that targets pri-miR-515 not only avidly binds this RNA but also discriminates against pri-miR-885 in vitro and in cells. Indeed, 2 binds >200-fold more avidly to pri-miR-515 than 1 does and inhibits miR-515 biogenesis >10-fold more potently in cells, providing a nanomolar active compound. There are few compounds that are known to affect the biological activity of human RNAs in patient-derived disease models. The ability to design these molecules to target RNA purposefully suggests that RNA-targeted small molecule lead medicines may be able to be broadly developed. Furthermore, we have shown that compounds are selective when viewed against all miRs, the whole transcriptome, and the whole proteome in this cell line.
One potential barrier to development of designer dimer RNA-binding compounds could be their lack of optimized drug-like properties (i.e., lipophilicity, pharmacokinetics, molecular weight, etc.). Indeed, the drug-likeness of larger molecular weight RNA-binding compounds, such as 2, can continue to be improved, however, this does not detract from their use as effective chemical probes nor as RNA targeting lead medicine modalities. Oligonucleotide-based therapeutics are much higher in molecular weight than 2 and yet have been transformative medicines, while antibodies such as Herceptin and Kadcyla are given via intravenous delivery. Interestingly, the molecular weight of FDA-approved small molecule medicines has steadily increased for the past several years and newer technologies, such as those seen in the heterobifunctional, proteolysis targeting chimera (PROTAC) field, have changed the paradigm of what modalities and properties constitute effective medicines.69,70
An additional implication of this study is the mechanism by which HER2 is expressed by inhibiting miR-515 biogenesis and enhancing S1P levels. Both global neoprotein synthesis and miRNA profiling studies support the assertion that 2 is selective. Those studies are bolstered by siRNA knock down and chemical inhibition of SK1 and by forced expression of SK1, indicating a miR-515-SK1-HER2 circuit operates in breast cancer cells. Various studies have shown a link between HER proteins and SK1, although the nature of that link appears to be cell-type specific.71–75 One study showed that a negative feedback loop operates in HER2+ MCF-7 cells, created by forced expression of HER2+ from a plasmid.75 HER2 increased SK1 levels, which in turn downregulated HER2 and inhibited a migratory phenotype. HER2 and SK1 likely operate in an oncogene addictive mechanism. HER2 increases SK1, producing S1P and enhanced cellular proliferation. HER2, however, also decreases expression of the estrogen receptor (ER), which would be deleterious to ER+ MCF-7 cells. Interestingly, this negative feedback loop between HER2 and SKI does not operate in WT, HER2– MCF-7 cells.75 Collectively, these studies, both in WT and HER2+ MCF-7 cells,75 and our own presented herein suggest that there is a threshold for HER2 levels and the migratory and proliferative properties of breast cancer cells.
Targeted therapeutics have transformed treatment options for cancer. Treatments for cancers for which there are no targeted therapeutics include surgery, radiation, and chemo-therapy that can have undesirable side effects. Here, we have shown that inducing SK1 expression with a selective small molecule increases expression of HER2 on the cell surface in HER2– breast cancer cells. Indeed, MCF-7, MDA-MB-231, and HepG2 cancer cells were all sensitized to Herceptin and Kadcyla upon compound treatment, while MCF-10A heathy breast epithelial cells were not affected. These results suggest two precision medicine approaches: (i) selectively affecting disease-causing targets that are aberrantly expressed in cells; and (ii) a secondary level of targeted therapeutics in which a small molecule induces expression of a target to render cells susceptible to approved precision medicines. In our case, a careful balance must be struck, as induction of SK1 and S1P enhances invasive properties; thus one would only want to induce expression to a level that would cause sensitization. This study and others show that small molecule chemical probes can target RNA and be designed from sequence to deliver selective compounds that can aid in elucidating and studying important biology.
MATERIALS AND METHODS
Cell culture
MCF-7 cells (HTB-22, ATCC) cells were cultured in DMEM medium with 4.5 g/L glucose (Corning) supplemented with 10% FBS (Sigma), 1× Glutagro (Corning), and 1× Antibiotic-Antimycotic (Corning) (growth medium). MDA-MB-231 (HTB-26, ATCC) cells were cultured in RPMI 1640 medium with L-glutamine and 25 mM HEPES (Corning) supplemented with 10% FBS (Sigma) and 1× Antibiotic-Antimycotic (Corning). The MCF-10A (CRL-10317, ATCC) cells were cultured in DMEM/F12 50/50 with L-glutamine and 15 mM HEPES (Corning), supplemented with 10% FBS (Sigma), 20 ng/mL human epidermal growth factor (Pepro Tech Inc.), 0.5 mg/mL hydrocortisone (Pfaltz & Bauer), 100 ng/mL cholera toxin (Sigma-Aldrich), 10 μg/mL insulin (Sigma-Aldrich), and 1× Antibiotic-Antimycotic (Corning). Cells were treated with small molecules (Synthetic Methods), Scramble Control, or Anti-515–5p Vivo-Morpholino (Gene Tools, LLC) for 24 or 48 h unless otherwise indicated by dilution in media. Cells were transfected for siRNA knockdown experiments with a control siRNA (Control siRNA-A; sc-37007, Santa Cruz Biotechnology), a sphingosine kinase 1 (SK1) siRNA (SphK1 siRNA (h); sc-44114, Santa Cruz Biotechnology), or a Frizzled 5 (FZD5) siRNA (FZD5 Silencer siRNA; 139070, Invitrogen) using the Lipofectamine RNAiMAX reagent, per the manufacturer’s protocol. Cells were maintained at 37 °C with 5% CO2.
RNA Isolation and RT-qPCR
Total RNA was extracted from cells using a Quick-RNA MiniPrep (Zymo Research) per the manufacturer’s protocol. Approximately 200–600 ng of total RNA was used in subsequent reverse transcription reactions using a miScript II RT Kit (Qiagen) per the manufacturer’s recommended protocols. The RT-qPCR primers (Table S3) were purchased from Eurofins or Integrated DNA Technologies (IDT) and used without further purification. The RT-qPCR samples were prepared using Power SYBR Green PCR Master Mix (Applied Biosystems) and completed on a 7900HT Fast Real Time PCR System (Applied Biosystems). The RNA expression levels were normalized with U6 small nuclear RNA or 18S as housekeeping genes.
In Vitro Chemical Cross-Linking and Isolation by Pull Down (Chem-CLIP) and Competitive Chemical Cross-Linking and Isolation by Pull Down (C-Chem-CLIP)
DMEM growth medium was heat inactivated at 95 °C for 15 min and then cooled to room temperature. Approximately 10,000 counts of 32P 5′-end labeled miR-515 primary transcript (pri-miR-515) or miR-885 primary transcript (pri-miR-885) was folded in growth medium at 60 °C for 5 min. After cooling to room temperature, dilutions of Targaprimir-515/885-CA-Biotin (3) or Control CA-Biotin (4) were added and incubated at 37 °C overnight (∼16 h). Alternatively, for C-Chem-CLIP, dilutions of competing non-cross-linking parent compounds, 1 or 2, were incubated with RNA for 45 min before adding 3 or 4.
A 300 μL slurry of streptavidin-agarose beads (Sigma-Aldrich) was washed three times with 1× PBS and resuspended in 1× PBS. A 20 μL aliquot of the slurry was then added to each sample, which were then incubated for 0.5–1 h at room temperature. The samples were centrifuged, and the supernatant containing unbound RNA was transferred to a new tube. The beads were then washed three times with 1× PBS supplemented with 0.1% (v/v) Tween-20 and centrifuged, with each wash supernatant being added to the tube containing unbound RNA. The amounts of radioactivity in the supernatant and on the beads were quantified with a Beckman Coulter LS6500 Liquid Scintillation Counter.
Cellular Chem-CLIP
The MCF-7 cells were grown to ∼70% confluency as monolayers in 100 mm dishes. The cells were treated with 0.5 μM of 3 or 4 for 48 h. Total RNA was extracted using a Quick-RNA MiniPrep Kit (Zymo Research) per the manufacturer’s protocol. Approximately 20–30 μg of total RNA was then incubated with 100 μL of streptavidin-agarose beads (Sigma-Aldrich) and shaken for 1 h at room temperature. The solution was removed and beads washed six times with 300 μL of 1× PBS. The RNA bound to beads was released by heating at 65 °C for 20 min in 1× Elution Buffer (95% formamide, 10 mM EDTA, pH 8.2). Eluted RNA was then purified with a Quick-RNA MiniPrep Kit (Zymo Research) and used for subsequent RNA isolation and RT-qPCR as described above (RNA Isolation and RT-qPCR).
Relative fold enrichment of the measured RNA before and after pulldown was measured using eq 1:
| (1) |
where ∆Ct before pulldown is the difference between the Ct values for the RNA of interest and a housekeeping gene (U6 small nuclear RNA) in total RNA from cells and Ct after pulldown is the difference between the Ct values for the RNA of interest and the same housekeeping gene in RNA after pulldown.
Cellular C-Chem-CLIP
Cellular C-Chem-CLIP assays were performed as described above (Cellular Chem-CLIP), except cells were treated with 5 μM of competitors 1 or 2 and incubated for 15 min at room temperature before treating with 0.5 μM of 3.
Flow Cytometry
MCF-7 cells were grown to ∼70% confluency in 6-well plates and incubated with 1, 2, or 3 for 24 h. Cells were then detached with Accutase (Innovative Cell Technologies, Inc.) and washed twice with 1× PBS. Cells were then suspended in 1× PBS with or without 1 μg/mL propidium iodide. For HER2 staining, a similar protocol was used as described above, except cells were resuspended in 1× Flow Cytometry Buffer (50 mM HEPES, pH 7.4, 700 mM NaCl and 12.5 mM CaCl2) and incubated with an APC-linked HER2 antibody (hErbB2 APC Mab, FAB1129A; R&D Systems Inc.) for 30 min at room temperature. Cells were washed twice with 1× Flow Cytometry Buffer and finally resuspended in 300 μL of 1× Flow Cytometry Buffer before performing flow cytometry. Flow cytometry was performed with a BD LSRII (BD Biosciences) with at least 10,000 events used for analysis.
Sphingosine Kinase 1 (SK1), Sphingosine Kinase 2 (SK2), and Frizzled-5 (FZD5) Western Blot
The MCF-7 cells were grown to ∼70% confluency in 6-well plates. Cells were incubated with 0.5 or 5 μM of 2 for 48 h. Total protein was extracted using M-PER Mammalian Protein Extraction Reagent (Pierce Biotechnology) per the manufacturer’s protocol and quantified using a Micro BCA Protein Assay Kit (Pierce Biotechnology). A 20 μg aliquot of total protein was resolved on a 10% SDS-polyacrylamide gel and then transferred to a PVDF membrane. The membrane was then blocked in 5% (w/v) nonfat dry milk dissolved in 1× TBST (1× TBS with 0.1% Tween-20 (v/v)) for 0.5 h at room temperature. The membrane was then incubated with 1:1000 SK1 primary antibody (Anti-SPHK1 antibody, ab71700, Abcam) in 1× TBS containing 5% nonfat dry milk overnight at 4 °C. Alternatively, to measure SK2, the membrane was incubated with 1:1000 SK2 primary antibody (Anti-SPHK2 antibody, ab37977, Abcam), and to measure FZD5, the membrane was incubated with 1:1000 FZD5 primary antibody (Frizzled5 Rabbit mAb; D2H2, Cell Signaling Technology). The membrane was washed three times for 5 min each with 1× TBST and then incubated with 1:2000 antirabbit IgG horseradish peroxidase conjugate (7074, Cell Signaling Technology) in 1× TBS containing 5% nonfat dry milk for 1 h at room temperature. After washing three times for 5 min each with 1× TBST, protein levels were quantified by chemiluminescence with SuperSignal West Pico Chemiluminescent Substrate (Pierce Bio-technology) per the manufacturer’s protocol. The membrane was stripped using 1× Stripping Buffer (200 mM glycine, pH 2.2, 1% Tween-20 and 0.1% SDS), followed by washing in 1× TBS. Then, the membrane was blocked and probed for β-actin following the same procedure described above using 1:2000 β-actin primary antibody (A5441, Sigma-Aldrich). ImageJ software (National Institutes of Health) was used to quantify band intensities.
Sphingosine-1-phosphate (S1P) ELISA
The MCF-7 cells were grown to 80% confluency in T-75 flasks. Cells were treated for 12 h in serum starved media with or without 0.5 μM 2. Alternatively, MCF-7 cells were batch transfected with an SK1 overexpression plasmid (OHu19985D, GenScript) using Lipofectamine 2000 as recommen-ded by the manufacturer. Cells were washed with 1× PBS and then lysed with 250 μL of 1× lysis buffer (20 mM PIPES, 150 mM NaCl, 1 mM EGTA, 1% (v/v) Triton X-100, 1.5 mM MgCl2, 0.1% SDS, 1 mM sodium orthovanadate, 1× Mammalian Protease Inhibitor Cocktail III (Research Products International, pH 7)). The concentration of total protein was determined using a Micro BCA Protein Assay Kit (Pierce Biotechnology). The diluted cell lysates were then analyzed for S1P levels using a Sphingosine-1-Phosphate Assay Kit, S1P-ELISA (Echelon Biosciences Inc.) per the manufacturer’s protocol. The S1P concentration per well was normalized by μg of total protein.
HER2 ELISA
MCF-7 cells were grown to ∼60% confluency in 6-well dishes. Cells were treated for 48 h with or without 1 μM of 2. Cells were then detached with 0.25% Trypsin-EDTA solution (Life Technologies) and washed with twice with 1× PBS. Cells were then resuspended at 1 × 10⁷ cells/mL in Cell Lysis Buffer 2 (R&D Systems) per the manufacturer’s protocol. The concentration of total protein was determined using a Micro BCA Protein Assay Kit (Pierce Biotechnology). Cell lysates were then analyzed for HER2 levels using the Human EbB2/HER2 Quantikine ELISA kit (R&D Systems) per the manufacturer’s protocol. The HER2 concentration per well was normalized by μg of total protein.
Migration Assay
MCF-7 or MDA-MB-231 cells were serum starved for 12 h in DMEM or RPMI medium without FBS, respectively. Samples of 5 × 10⁴ cells were seeded into Hanging Cell Culture Inserts for 24 well plates with uncoated membranes with 8.0 μm pores (Millicell) in serum starved media. Cells were cultured or treated in serum starved media with 2 or SKI-178 at the appropriate concentrations and allowed to migrate toward complete growth media in the bottom well for 8 h. The media was vacuum aspirated, and both hanging cell culture insert and bottom wells were washed twice with 1× PBS, gently shaking to mix. Excess liquid and cells inside the insert were removed with cotton swabs, after which 400 μL of 4% paraformaldehyde was placed into the bottom well and incubated for 20 min at room temperature. The wells and inserts were washed twice with 1× PBS and then treated with 400 μL of 0.1% crystal violet solution for 20 min at room temperature. Then wells and inserts were washed twice with water. Then wells and inserts were washed once with 1× PBS and dried with cotton swabs to remove extra stain and cells inside the inset. Migration inserts were air-dried and then analyzed by microscopy using a Leica DMI3000 B upright fluorescent microscope. Four different fields of view from each captured image were counted for crystal violet stained or unstained cells. Percentage of cells migrated was calculated with eq 2:
| (2) |
where stained cells and unstained cells represent cells counted with or without crystal violet stain observed, respectively.
Treatment with 2, HPG Incorporation, and Pulldown of Newly Synthesized Proteins for Mass Spectrometry
MCF-7 cells were seeded (7.5 × 10⁴ cells/mL) in 10 cm dishes and incubated overnight. Cells were washed once with 1× PBS and treated with either DMSO or 2 (1 μM) for 48 h in medium with 10% fetal calf serum (FCS) at 37 °C. The cells were serum starved for 1 h at 37 °C in DMEM without FCS, L-cystine, and L-methionine. Subsequently, the cells were incubated with DMEM containing 0.2 mM L-cystine (Sigma-Aldrich) and 1 mM L-homopropargylglycine (Click Chemistry Tools) for 5 h at 37 °C. The cells were washed twice with 1× PBS, harvested by scraping, centrifuged at 1500×g for 5 min at 4 °C, and resuspended in 1× PBS. Cells were lysed by sonication, and the protein concentration of the lysate was determined using a Bradford assay (Bio-Rad). Lysates (2.33 mg/mL, 0.43 mL) were subjected to click chemistry using biotin azide (catalog no.: 1265–100, Click Chemistry Tools, 100 μM, 50× stock in DMSO), tris(2- carboxyethyl)phosphine hydrochloride (TCEP) (1 mM, 50× fresh stock in water), tris[(1-benzyl-1H-1,2,3-triazol-4-yl)methyl]amine (TBTA) (100 μM, 16× stock in DMSO:t-Butanol 1:4), and copper(II) sulfate (1 mM, 50× stock in water) for 1 h at room temperature. Protein was precipitated by adding MeOH (4 vol.), CHCl3 (1 vol.), and water (3 vol.) to the reaction mixture, and the turbid mixture was centrifuged for 5 min at 20000×g at 4 °C, yielding a protein layer between the aqueous and organic layers. The protein layer was isolated, dried, and solubilized in 2% SDS in 1× PBS via sonication. The protein was centrifuged at 4700×g for 5 min, and the soluble fraction was transferred to a new tube. Next, 1× PBS was added to give a final SDS concentration of 0.2%, and then 150 μL of streptavidin agarose beads (ProteoChem) were added. The mixture was rotated overnight at room temperature. The beads were washed with 1% SDS in 1× PBS (1 × 10 mL), 1× PBS (3 × 10 mL), and water (3 × 10 mL). After resuspension in 6 M urea in 1× PBS (500 μL), the beads were reduced with 10 mM neutralized TCEP (20× fresh stock in water) for 30 min at room temperature and then alkylated with 25 mM iodoacetamide (400 mM fresh stock in water) for 30 min at room temperature in the dark. Beads were pelleted by centrifugation at 1400×g for 2 min and resuspended in 150 μL of 2 M urea, 1 mM CaCl2 (100× stock in water), and trypsin (Thermo Scientific, 1.5 μL of 0.5 μg/μL) in 50 mM NH4HCO3. The digestion was performed for 6 h at 37 °C. Samples were acidified to a final concentration of 5% acetic acid, desalted over a self-packed C18 spin column, and dried. Samples were analyzed by LC-MS/MS (see below), and the MS data were processed with MaxQuant (see below).
LC-MS/MS Analysis
Peptides were resuspended in water with 0.1% formic acid (FA) and analyzed using EASY-nLC 1200 nano-UHPLC coupled to Q Exactive HF-X Quadrupole-Orbitrap mass spectrometer (Thermo Scientific). The chromatography column consisted of a 30 cm long, 75 μm i.d. microcapillary capped by a 5 μm tip and packed with ReproSil-Pur 120 C18-AQ 2.4 μm beads (Dr. Maisch GmbH). LC solvents were 0.1% FA in H2O (Buffer A) and 0.1% FA in 90% MeCN:10% H2O (Buffer B). Peptides were eluted into the mass spectrometer at a flow rate of 300 nL/min over a 240 min linear gradient (5–35% Buffer B) at 65 °C. Data were acquired in data-dependent mode (top-20, NCE 28, R = 7500) after full MS scan (R = 60000, m/z 400–1300). Dynamic exclusion was set to 10 s, peptide match set to prefer, and isotope exclusion was enabled.
MaxQuant Analysis
The MS data were analyzed with MaxQuant76 (V1.6.1.0) and searched against the human proteome (Uniprot) and a common list of contaminants (included in MaxQuant). The first peptide search tolerance was set at 20 ppm; 10 ppm was used for the main peptide search, and fragment mass tolerance was set to 0.02 Da. The false discovery rate for peptides, proteins, and sites identification was set to 1%. The minimum peptide length was set to six amino acids, and peptide requantification, label-free quantification (MaxLFQ), and “match between runs” were enabled. The minimal number of peptides per protein was set to 2. Methionine oxidation was searched as a variable modification, and carbamidomethylation of cysteines was searched as a fixed modification.
RNA-Seq and Pathway Analysis
MCF-7 cells were treated as described above for 24 h with 2 (1 μM), and total RNA was extracted using a miRNeasy Mini Kit (Qiagen) with on-column DNase I treatment. Total RNA was quantified using a Qubit 2.0 Fluorometer (Invitrogen), and their quality was assessed using an Agilent Technologies 2100 Bioanalyzer RNA nano chip. Only samples with RNA integrity number > 8.0 were used. Depletion of rRNA on 500 ng of total RNA was completed using probes provided by the NEBNext rRNA depletion module (catalog no.: E6310L, New England Biosciences), according to the manufacturer’s recommendations. A NEBNext Ultra II Directional RNA kit (catalog no.: E7760, New England Biosciences) was used for library preparation according to the manufacturer’s instructions. RNA samples were then chemically fragmented in a divalent cation buffer with heating at 94 °C for 15 min. Random hexamer priming and reverse transcription were used to convert the fragmented RNA to the first strand of cDNA. The second strand was synthesized by removing the RNA template and incorporating dUTP in place of dTTP, which was then end repaired and adenylated at the 3′ end. A corresponding T nucleotide on the hairpin loop adaptor was used to ligate to the double-stranded cDNA. Uracil-specific excision reagent (USER) enzyme was then used to remove the dUTP in the loop as well as other incorporated U’s in the second strand. Degradation of the second strand preserves the directional sequencing of the original RNA. The adaptor ligated DNA was PCR amplified with Illumina barcoding primers to generate the final libraries, where only library fragments with both 5′ and 3′ adaptors would be enriched in the final PCR step. After validation on a Bioanalyzer DNA chip, the final libraries were normalized to 2 nM, pooled equally, and sequenced on a Nextseq 500 v2.5 flow cell at 1.8 pM final concentration using 2 × 40 bp paired-end chemistry. Approximately 20–25 million reads were generated per sample with a base quality score > Q30 (<1 error per 1000 bp). Transcript abundance from these samples was quantified using Kallisto. Gene-level RNA-Seq differential expression analysis was performed using the Sleuth package in R. Outcomes from the differential expression analysis with adjusted p-values <0.05 were then uploaded into Ingenuity Pathway Analysis (IPA; Qiagen) for Upstream Regulators and Diseases and Functions analysis.
Herceptin and Kadcyla Sensitivity Experiments
MCF-7 or MCF-10A cells were plated into clear bottom, tissue culture treated, white 96-well plates (3903, Corning). At ∼60% confluency, cells were treated with 2, Anti-515–5p or Scramble Control Vivo-Morpholino, sphingosine kinase 1 inhibitor SKI-178, or with DMSO vehicle control in growth medium. After overnight incubation, Herceptin (Anti-her2 trastuzumab Ab; 501494437, BioVision Inc.) or Kadcyla (T-DM1 biosimilar; Levena Biopharma) was added to the growth medium. After an additional 48 h, cell viability was measured using CellTiter-Glo 2.0 (G9242, Promega Corp), or apoptotic stimulation was measured using the Caspase-Glo 3/7 Assay (G8091, Promega Corp), per the manufacturer’s protocol. Alternatively, MCF-7 cells were seeded into 60 mm dishes and: (i) batch transfected with SK1 siRNA, as described above; (ii) batch transfected with an SK1 overexpression plasmid (OHu19985D, GenScript); or (iii) batch transfected with the empty pcDNA3.1+/C-(K)DYK vector, all using Lipofectamine 2000 as per the manufacturer’s protocol. After transfection, cells were plated into 96-well plates.
Supplementary Material
ACKNOWLEDGMENTS
This work was funded by the RJ Scheller Graduate Student Fellowship and the ACS Medicinal Chemistry Division Predoctoral Fellowship to M.G.C. and the National Institutes of Health (5R01GM097455) to M.D.D. We also thank Alan and Susan Fuirst and Frenchman’s Creek Women for Cancer Research for gifts that made this research possible. We thank the Genomics Core at Scripps Research for library preparation and sequencing and Kamalakannan Vishnu for support with RNA-Seq data analysis. We thank Liz Phinney for preliminary experiments.
Footnotes
Notes
The authors declare no competing financial interest.
ASSOCIATED CONTENT
Supporting Information
The Supporting Information is available free of charge on the ACS Publications website at DOI: 10.1021/jacs.8b10558.
Supplementary methods, details of chemical synthesis, PCR amplification and RNA transcription, nucleic acid binding assays, in vitro Drosha processing assays, melting temperature experiments, flow cytometry assays to evaluate cell viability and compound uptake, Chem- CLIP validation experiments, miR-515–5p and miR-515– 3p inhibition, calorimetry experiments, compound and oligonucleotide selectivity studies, control SK1 and SK2 Western blots, migration in MDA-MB-231 cells, primiR- 515 induction experiments, Frizzled 5 studies, pathway analysis for proteomics, differential gene expression analysis, MCF-10A, MDA-MB-231, and HepG2 studies, HER2 mRNA studies, a table of binding affinities, a table of RNA-Seq pathway analysis results, and a table of primers used (PDF) Gene and protein names (XLSX)
REFERENCES
- (1).The Encode Project Consortium. Identification and analysis of functional elements in 1% of the human genome by the ENCODE pilot project. Nature 2007, 447 (7146), 799–816. [DOI] [PMC free article] [PubMed] [Google Scholar]
- (2).Siegfried NA; Busan S; Rice GM; Nelson JA; Weeks KM RNA motif discovery by SHAPE and mutational profiling (SHAPE-MaP). Nat. Methods 2014, 11 (9), 959–65. [DOI] [PMC free article] [PubMed] [Google Scholar]
- (3).Guttman M; Amit I; Garber M; French C; Lin MF; Feldser D; Huarte M; Zuk O; Carey BW; Cassady JP; Cabili MN; Jaenisch R; Mikkelsen TS; Jacks T; Hacohen N; Bernstein BE; Kellis M; Regev A; Rinn JL; Lander ES Chromatin signature reveals over a thousand highly conserved large non-coding RNAs in mammals. Nature 2009, 458 (7235), 223–7. [DOI] [PMC free article] [PubMed] [Google Scholar]
- (4).Visone R; Croce CM MiRNAs and cancer. Am. J. Pathol 2009, 174 (4), 1131–8. [DOI] [PMC free article] [PubMed] [Google Scholar]
- (5).Hopkins AL; Groom CR The druggable genome. Nat. Rev. Drug Discovery 2002, 1, 727. [DOI] [PubMed] [Google Scholar]
- (6).Blount KF; Breaker RR Riboswitches as antibacterial drug targets. Nat. Biotechnol 2006, 24 (12), 1558–64. [DOI] [PubMed] [Google Scholar]
- (7).Poehlsgaard J; Douthwaite S The bacterial ribosome as a target for antibiotics. Nat. Rev. Microbiol 2005, 3 (11), 870–81. [DOI] [PubMed] [Google Scholar]
- (8).Connelly CM; Moon MH; Schneekloth JS The Emerging Role of RNA as a Therapeutic Target for Small Molecules. Cell Chem. Biol 2016, 23 (9), 1077–1090. [DOI] [PMC free article] [PubMed] [Google Scholar]
- (9).Donlic A; Hargrove AE Targeting RNA in mammalian systems with small molecules. Wiley Interdiscip. Rev. RNA 2018, 9 (4), No. e1477. [DOI] [PMC free article] [PubMed] [Google Scholar]
- (10).He L; Hannon GJ MicroRNAs: small RNAs with a big role in gene regulation. Nat. Rev. Genet 2004, 5 (7), 522–31. [DOI] [PubMed] [Google Scholar]
- (11).Velagapudi SP; Gallo SM; Disney MD Sequence-based design of bioactive small molecules that target precursor microRNAs. Nat. Chem. Biol 2014, 10 (4), 291–7. [DOI] [PMC free article] [PubMed] [Google Scholar]
- (12).Childs-Disney JL; Wu M; Pushechnikov A; Aminova O; Disney MD A small molecule microarray platform to select RNA internal loop-ligand interactions. ACS Chem. Biol 2007, 2 (11), 745–54. [DOI] [PubMed] [Google Scholar]
- (13).Velagapudi SP; Luo Y; Tran T; Haniff HS; Nakai Y; Fallahi M; Martinez GJ; Childs-Disney JL; Disney MD Defining RNA-small molecule affinity landscapes enables design of a small molecule inhibitor of an oncogenic noncoding RNA. ACS Cent. Sci 2017, 3 (3), 205–216. [DOI] [PMC free article] [PubMed] [Google Scholar]
- (14).Liu B; Childs-Disney JL; Znosko BM; Wang D; Fallahi M; Gallo SM; Disney MD Analysis of secondary structural elements in human microRNA hairpin precursors. BMC Bioinf 2016, 17, 112. [DOI] [PMC free article] [PubMed] [Google Scholar]
- (15).Velagapudi SP; Disney MD Two-dimensional combinatorial screening enables the bottom-up design of a micro-RNA-10b inhibitor. Chem. Commun 2014, 50 (23), 3027–9. [DOI] [PMC free article] [PubMed] [Google Scholar]
- (16).Costales MG; Haga CL; Velagapudi SP; Childs-Disney JL; Phinney DG; Disney MD Small molecule inhibition of microRNA-210 reprograms an oncogenic hypoxic circuit. J. Am. Chem. Soc 2017, 139 (9), 3446–3455. [DOI] [PMC free article] [PubMed] [Google Scholar]
- (17).Lee MM; Childs-Disney JL; Pushechnikov A; French JM; Sobczak K; Thornton CA; Disney MD Controlling the specificity of modularly assembled small molecules for RNA via ligand module spacing: targeting the RNAs that cause myotonic muscular dystrophy. J. Am. Chem. Soc 2009, 131 (47), 17464–72. [DOI] [PMC free article] [PubMed] [Google Scholar]
- (18).Childs-Disney JL; Tsitovich PB; Disney MD Using modularly assembled ligands to bind RNA internal loops separated by different distances. ChemBioChem 2011, 12, 2143–2146. [DOI] [PMC free article] [PubMed] [Google Scholar]
- (19).Velagapudi SP; Cameron MD; Haga CL; Rosenberg LH; Lafitte M; Duckett DR; Phinney DG; Disney MD Design of a small molecule against an oncogenic noncoding RNA. Proc. Natl. Acad. Sci. U. S. A 2016, 113 (21), 5898–5903. [DOI] [PMC free article] [PubMed] [Google Scholar]
- (20).Wong C-H; Nguyen L; Peh J; Luu LM; Sanchez JS; Richardson SL; Tuccinardi T; Tsoi H; Chan WY; Chan HYE; Baranger AM; Hergenrother PJ; Zimmerman SC Targeting Toxic RNAs that Cause Myotonic Dystrophy Type 1 (DM1) with a Bisamidinium Inhibitor. J. Am. Chem. Soc 2014, 136 (17), 6355–6361. [DOI] [PMC free article] [PubMed] [Google Scholar]
- (21).Rzuczek SG; Colgan LA; Nakai Y; Cameron MD; Furling D; Yasuda R; Disney MD Precise small-molecule recognition of a toxic CUG RNA repeat expansion. Nat. Chem. Biol 2017, 13 (2), 188–193. [DOI] [PMC free article] [PubMed] [Google Scholar]
- (22).Lee MM; Pushechnikov A; Disney MD Rational and modular design of potent ligands targeting the RNA that causes myotonic dystrophy 2. ACS Chem. Biol 2009, 4, 345–355. [DOI] [PMC free article] [PubMed] [Google Scholar]
- (23).Pushechnikov A; Lee MM; Childs-Disney JL; Sobczak K; French JM; Thornton CA; Disney MD Rational design of ligands targeting triplet repeating transcripts that cause RNA dominant disease: application to myotonic muscular dystrophy type 1 and spinocerebellar ataxia type 3. J. Am. Chem. Soc 2009, 131 (28), 9767–79. [DOI] [PMC free article] [PubMed] [Google Scholar]
- (24).Chan TR; Hilgraf R; Sharpless KB; Fokin VV Polytriazoles as copper(I)-stabilizing ligands in catalysis. Org. Lett 2004, 6 (17), 2853–5. [DOI] [PubMed] [Google Scholar]
- (25).Kolb HC; Finn MG; Sharpless KB Click chemistry: diverse chemical function from a few good reactions. Angew. Chem., Int. Ed 2001, 40 (11), 2004–2021. [DOI] [PubMed] [Google Scholar]
- (26).Velagapudi SP; Seedhouse SJ; French J; Disney MD Defining the RNA internal loops preferred by benzimidazole derivatives via 2D combinatorial screening and computational analysis. J. Am. Chem. Soc 2011, 133 (26), 10111–8. [DOI] [PMC free article] [PubMed] [Google Scholar]
- (27).Sando S; Narita A; Aoyama Y Light-up Hoechst-DNA aptamer pair: generation of an aptamer-selective fluorophore from a conventional DNA-staining dye. ChemBioChem 2007, 8 (15), 1795–803. [DOI] [PubMed] [Google Scholar]
- (28).Gestwicki JE; Cairo CW; Strong LE; Oetjen KA; Kiessling LL Influencing receptor-ligand binding mechanisms with multivalent ligand architecture. J. Am. Chem. Soc 2002, 124 (50), 14922–33. [DOI] [PubMed] [Google Scholar]
- (29).Roberts RW; Crothers DM Specificity and stringency in DNA triplex formation. Proc. Natl. Acad. Sci. U. S. A 1991, 88 (21), 9397–401. [DOI] [PMC free article] [PubMed] [Google Scholar]
- (30).Schroeder SJ; Turner DH Optical Melting Measurements of Nucleic Acid Thermodynamics. Methods Enzymol 2009, 468, 371–387. [DOI] [PMC free article] [PubMed] [Google Scholar]
- (31).Mammen M; Choi S-K; Whitesides GM Polyvalent Interactions in Biological Systems: Implications for Design and Use of Multivalent Ligands and Inhibitors. Angew. Chem., Int. Ed 1998, 37 (20), 2754–2794. [DOI] [PubMed] [Google Scholar]
- (32).Childs-Disney JL; Disney MD Approaches to validate and manipulate RNA targets with small molecules in cells. Annu. Rev. Pharmacol. Toxicol 2016, 56, 123–40. [DOI] [PMC free article] [PubMed] [Google Scholar]
- (33).Yang WY; Wilson HD; Velagapudi SP; Disney MD Inhibition of non-ATG translational events in cells via covalent small molecules targeting RNA. J. Am. Chem. Soc 2015, 137 (16), 5336–45. [DOI] [PMC free article] [PubMed] [Google Scholar]
- (34).Guan L; Disney MD Covalent small molecule-RNA complex formation enables cellular profiling of small molecule-RNA interactions. Angew. Chem., Int. Ed 2013, 52 (38), 10010–3. [DOI] [PMC free article] [PubMed] [Google Scholar]
- (35).Wang J; Schultz PG; Johnson KA Mechanistic studies of a small-molecule modulator of SMN2 splicing. Proc. Natl. Acad. Sci. U. S. A 2018, 115 (20), E4604–E4612. [DOI] [PMC free article] [PubMed] [Google Scholar]
- (36).Lee B; Flynn RA; Kadina A; Guo JK; Kool ET; Chang HY Comparison of SHAPE reagents for mapping RNA structures inside living cells. RNA 2017, 23 (2), 169–174. [DOI] [PMC free article] [PubMed] [Google Scholar]
- (37).Wan Y; Qu K; Zhang QC; Flynn RA; Manor O; Ouyang Z; Zhang J; Spitale RC; Snyder MP; Segal E; Chang HY Landscape and variation of RNA secondary structure across the human transcriptome. Nature 2014, 505 (7485), 706–9. [DOI] [PMC free article] [PubMed] [Google Scholar]
- (38).Ding Y; Tang Y; Kwok CK; Zhang Y; Bevilacqua PC; Assmann SM In vivo genome-wide profiling of RNA secondary structure reveals novel regulatory features. Nature 2014, 505, 696. [DOI] [PubMed] [Google Scholar]
- (39).Mathews DH; Disney MD; Childs JL; Schroeder SJ; Zuker M; Turner DH Incorporating chemical modification constraints into a dynamic programming algorithm for prediction of RNA secondary structure. Proc. Natl. Acad. Sci. U. S. A 2004, 101 (19), 7287–92. [DOI] [PMC free article] [PubMed] [Google Scholar]
- (40).Mili S; Steitz JA Evidence for re-association of RNA-binding proteins after cell lysis: implications for the interpretation of immunoprecipitation analyses. RNA 2004, 10 (11), 1692–4. [DOI] [PMC free article] [PubMed] [Google Scholar]
- (41).Pinho FG; Frampton AE; Nunes J; Krell J; Alshaker H; Jacob J; Pellegrino L; Roca-Alonso L; de Giorgio A; Harding V; Waxman J; Stebbing J; Pchejetski D; Castellano L Down-regulation of microRNA-515–5p by the estrogen receptor modulates sphingosine kinase 1 and breast cancer cell proliferation. Cancer Res 2013, 73 (19), 5936–48. [DOI] [PubMed] [Google Scholar]
- (42).Xiong J; Yu D; Wei N; Fu H; Cai T; Huang Y; Wu C; Zheng X; Du Q; Lin D; Liang Z An estrogen receptor alpha suppressor, microRNA-22, is downregulated in estrogen receptor alpha-positive human breast cancer cell lines and clinical samples. FEBS J 2010, 277 (7), 1684–94. [DOI] [PubMed] [Google Scholar]
- (43).Lewis BP; Burge CB; Bartel DP Conserved seed pairing, often flanked by adenosines, indicates that thousands of human genes are microRNA targets. Cell 2005, 120 (1), 15–20. [DOI] [PubMed] [Google Scholar]
- (44).Kunkel GT; Maceyka M; Milstien S; Spiegel S Targeting the sphingosine-1-phosphate axis in cancer, inflammation and beyond. Nat. Rev. Drug Discovery 2013, 12 (9), 688–702. [DOI] [PMC free article] [PubMed] [Google Scholar]
- (45).Mandala S; Hajdu R; Bergstrom J; Quackenbush E; Xie J; Milligan J; Thornton R; Shei GJ; Card D; Keohane C; Rosenbach M; Hale J; Lynch CL; Rupprecht K; Parsons W; Rosen H Alteration of lymphocyte trafficking by sphingosine-1-phosphate receptor agonists. Science 2002, 296 (5566), 346–9. [DOI] [PubMed] [Google Scholar]
- (46).Nguyen-Tran DH; Hait NC; Sperber H; Qi J; Fischer K; Ieronimakis N; Pantoja M; Hays A; Allegood J; Reyes M; Spiegel S; Ruohola-Baker H Molecular mechanism of sphingosine-1-phosphate action in Duchenne muscular dystrophy. Dis. Models & Mech 2014, 7 (1), 41–54. [DOI] [PMC free article] [PubMed] [Google Scholar]
- (47).Ceccom J; Loukh N; Lauwers-Cances V; Touriol C; Nicaise Y; Gentil C; Uro-Coste E; Pitson S; Maurage CA; Duyckaerts C; Cuvillier O; Delisle M-B Reduced sphingosine kinase-1 and enhanced sphingosine 1-phosphate lyase expression demonstrate deregulated sphingosine 1-phosphate signaling in Alzheimer’s disease. Acta Neuropathol. Commun 2014, 2 (1), 12. [DOI] [PMC free article] [PubMed] [Google Scholar]
- (48).Means CK; Brown JH Sphingosine-1-phosphate receptor signalling in the heart. Cardiovasc. Res 2008, 82 (2), 193–200. [DOI] [PMC free article] [PubMed] [Google Scholar]
- (49).Pyne NJ; Pyne S Sphingosine 1-phosphate and cancer. Nat. Rev. Cancer 2010, 10 (7), 489–503. [DOI] [PubMed] [Google Scholar]
- (50).Thompson EW; Paik S; Brunner N; Sommers CL; Zugmaier G; Clarke R; Shima TB; Torri J; Donahue S; Lippman ME; Martin GR; Dickson RB Association of increased basement membrane invasiveness with absence of estrogen receptor and expression of vimentin in human breast cancer cell lines. J. Cell. Physiol 1992, 150 (3), 534–44. [DOI] [PubMed] [Google Scholar]
- (51).Hengst JA; Wang X; Sk UH; Sharma AK; Amin S; Yun JK Development of a sphingosine kinase 1 specific small- molecule inhibitor. Bioorg. Med. Chem. Lett 2010, 20 (24), 7498–502. [DOI] [PubMed] [Google Scholar]
- (52).Spiegel S; Milstien S Functions of the Multifaceted Family of Sphingosine Kinases and Some Close Relatives. J. Biol. Chem 2007, 282 (4), 2125–2129. [DOI] [PubMed] [Google Scholar]
- (53).Zhang M; Muralimanoharan S; Wortman AC; Mendelson CR Primate-specific miR-515 family members inhibit key genes in human trophoblast differentiation and are upregulated in preeclamp-sia. Proc. Natl. Acad. Sci. U. S. A 2016, 113 (45), E7069–E7076. [DOI] [PMC free article] [PubMed] [Google Scholar]
- (54).Schambony A; Wedlich D Wnt Signaling and Cell Migration; Landes Bioscience: Austin, TX, 2013. [Google Scholar]
- (55).Liu F; Liu Y; Shen J; Zhang G; Han J MicroRNA-224 inhibits proliferation and migration of breast cancer cells by down-regulating fizzled 5 expression. Oncotarget 2016, 7 (31), 49130–49142. [DOI] [PMC free article] [PubMed] [Google Scholar]
- (56).Kiick KL; Weberskirch R; Tirrell DA Identification of an expanded set of translationally active methionine analogues in Escherichia coli. FEBS Lett 2001, 502 (1–2), 25–30. [DOI] [PubMed] [Google Scholar]
- (57).Safarian F; Khallaghi B; Ahmadiani A; Dargahi L Activation of S1P(1) receptor regulates PI3K/Akt/FoxO3a pathway in response to oxidative stress in PC12 cells. J. Mol. Neurosci 2015, 56 (1), 177–87. [DOI] [PubMed] [Google Scholar]
- (58).Miller AV; Alvarez SE; Spiegel S; Lebman DA Sphingosine Kinases and Sphingosine-1-Phosphate Are Critical for Transforming Growth Factor β-Induced Extracellular Signal-Regu-lated Kinase 1 and 2 Activation and Promotion of Migration and Invasion of Esophageal Cancer Cells. Mol. Cell. Biol 2008, 28 (12), 4142–4151. [DOI] [PMC free article] [PubMed] [Google Scholar]
- (59).Hinohara K; Kobayashi S; Kanauchi H; Shimizu S; Nishioka K; Tsuji E; Tada K; Umezawa K; Mori M; Ogawa T; Inoue J; Tojo A; Gotoh N ErbB receptor tyrosine kinase/NF-kappaB signaling controls mammosphere formation in human breast cancer. Proc. Natl. Acad. Sci. U. S. A 2012, 109 (17), 6584–9. [DOI] [PMC free article] [PubMed] [Google Scholar]
- (60).Watson C; Long JS; Orange C; Tannahill CL; Mallon E; McGlynn LM; Pyne S; Pyne NJ; Edwards J High Expression of Sphingosine 1-Phosphate Receptors, S1P1 and S1P3, Sphingosine Kinase 1, and Extracellular Signal-Regulated Kinase-1/2 Is Associated with Development of Tamoxifen Resistance in Estrogen Receptor-Positive Breast Cancer Patients. Am. J. Pathol 2010, 177 (5), 2205–2215. [DOI] [PMC free article] [PubMed] [Google Scholar]
- (61).Baek D; Villen J; Shin C; Camargo FD; Gygi SP; Bartel P The impact of microRNAs on protein output. Nature 2008, 455, 64. [DOI] [PMC free article] [PubMed] [Google Scholar]
- (62).Selbach M; Schwanhausser B; Thierfelder N; Fang Z; Khanin R; Rajewsky N Widespread changes in protein synthesis induced by microRNAs. Nature 2008, 455, 58. [DOI] [PubMed] [Google Scholar]
- (63).Slamon DJ; Leyland-Jones B; Shak S; Fuchs H; Paton V; Bajamonde A; Fleming T; Eiermann W; Wolter J; Pegram M; Baselga J; Norton L Use of chemotherapy plus a monoclonal antibody against HER2 for metastatic breast cancer that overexpresses HER2. N. Engl. J. Med 2001, 344 (11), 783–92. [DOI] [PubMed] [Google Scholar]
- (64).Lewis Phillips GD; Li G; Dugger DL; Crocker LM; Parsons KL; Mai E; Blattler WA; Lambert JM; Chari RVJ; Lutz RJ; Wong WLT; Jacobson FS; Koeppen H; Schwall RH; Kenkare-Mitra SR; Spencer SD; Sliwkowski MX Targeting HER2-Positive Breast Cancer with Trastuzumab-DM1, an Antibody− Cytotoxic Drug Conjugate. Cancer Res 2008, 68 (22), 9280–9290. [DOI] [PubMed] [Google Scholar]
- (65).Morgan BS; Forte JE; Hargrove AE Insights into the development of chemical probes for RNA. Nucleic Acids Res 2018, 46 (16), 8025–8037. [DOI] [PMC free article] [PubMed] [Google Scholar]
- (66).Wong CH; Nguyen L; Peh J; Luu LM; Sanchez JS; Richardson SL; Tuccinardi T; Tsoi H; Chan WY; Chan HY; Baranger AM; Hergenrother PJ; Zimmerman SC Targeting toxic RNAs that cause myotonic dystrophy type 1 (DM1) with a bisamidinium inhibitor. J. Am. Chem. Soc 2014, 136 (17), 6355–61. [DOI] [PMC free article] [PubMed] [Google Scholar]
- (67).Shortridge MD; Walker MJ; Pavelitz T; Chen Y; Yang W; Varani G A Macrocyclic Peptide Ligand Binds the Oncogenic MicroRNA-21 Precursor and Suppresses Dicer Processing. ACS Chem. Biol 2017, 12 (6), 1611–1620. [DOI] [PMC free article] [PubMed] [Google Scholar]
- (68).Ofori LO; Hilimire TA; Bennett RP; Brown NW Jr.; Smith HC; Miller BL High-affinity recognition of HIV-1 frameshift-stimulating RNA alters frameshifting in vitro and interferes with HIV-1 infectivity. J. Med. Chem 2014, 57 (3), 723–32. [DOI] [PMC free article] [PubMed] [Google Scholar]
- (69).Shultz MD, Two Decades under the Influence of the Rule of Five and the Changing Properties of Approved Oral Drugs. J. Med. Chem 2018. DOI: 10.1021/acs.jmedchem.8b00686 [DOI] [PubMed] [Google Scholar]
- (70).An S; Fu L Small-molecule PROTACs: An emerging and promising approach for the development of targeted therapy drugs. EBioMedicine 2018, 36, 553–562. [DOI] [PMC free article] [PubMed] [Google Scholar]
- (71).Doll F; Pfeilschifter J; Huwiler A The epidermal growth factor stimulates sphingosine kinase-1 expression and activity in the human mammary carcinoma cell line MCF7. Biochim. Biophys. Acta, Mol. Cell Biol. Lipids 2005, 1738 (1–3), 72–81. [DOI] [PubMed] [Google Scholar]
- (72).Meyer zu Heringdorf D; Lass H; Kuchar I; Alemany R; Guo Y; Schmidt M; Jakobs KH Role of sphingosine kinase in Ca(2+) signalling by epidermal growth factor receptor. FEBS Lett 1999, 461 (3), 217–22. [DOI] [PubMed] [Google Scholar]
- (73).Rani CS; Wang F; Fuior E; Berger A; Wu J; Sturgill TW; Beitner-Johnson D; LeRoith D; Varticovski L; Spiegel S Divergence in signal transduction pathways of platelet-derived growth factor (PDGF) and epidermal growth factor (EGF) receptors. Involvement of sphingosine 1-phosphate in PDGF but not EGF signaling. J. Biol. Chem 1997, 272 (16), 10777–83. [DOI] [PubMed] [Google Scholar]
- (74).Sarkar S; Maceyka M; Hait NC; Paugh SW; Sankala H; Milstien S; Spiegel S Sphingosine kinase 1 is required for migration, proliferation and survival of MCF-7 human breast cancer cells. FEBS Lett 2005, 579 (24), 5313–7. [DOI] [PubMed] [Google Scholar]
- (75).Long JS; Edwards J; Watson C; Tovey S; Mair KM; Schiff R; Natarajan V; Pyne NJ; Pyne S Sphingosine kinase 1 induces tolerance to human epidermal growth factor receptor 2 and prevents formation of a migratory phenotype in response to sphingosine 1-phosphate in estrogen receptor-positive breast cancer cells. Mol. Cell. Biol 2010, 30 (15), 3827. [DOI] [PMC free article] [PubMed] [Google Scholar]
- (76).Cox J; Mann M MaxQuant enables high peptide identification rates, individualized p.p.b.-range mass accuracies and proteome-wide protein quantification. Nat. Biotechnol 2008, 26 (12), 1367–1372. [DOI] [PubMed] [Google Scholar]
Associated Data
This section collects any data citations, data availability statements, or supplementary materials included in this article.