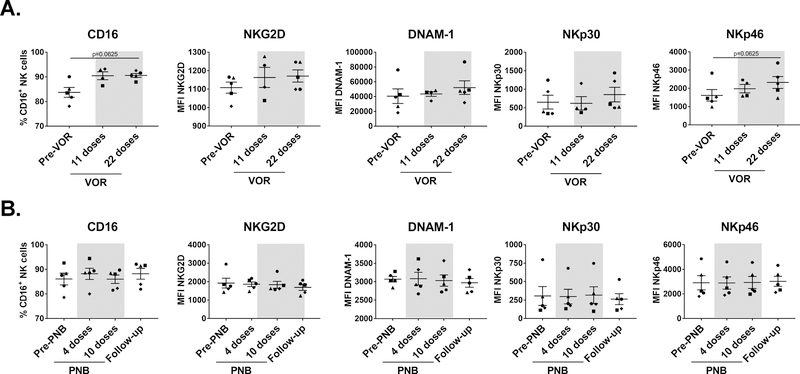
Fig. 3. Expression of activating receptors on NK cells.
NK cells were negatively isolated from thawed PBMC and stained with a panel of monoclonal antibodies to analyze the expression of activating receptors. A. VOR treatment: NKp30, DNAM-1 and NKG2D expression did not change during treatment, but expression of CD16 and NKp46 was increased to some extent after VOR administration. B. PNB treatment: No changes were observed during PNB treatment. Each symbol represents cells from a different study participant. Wilcoxon matched-pairs signed rank test.

