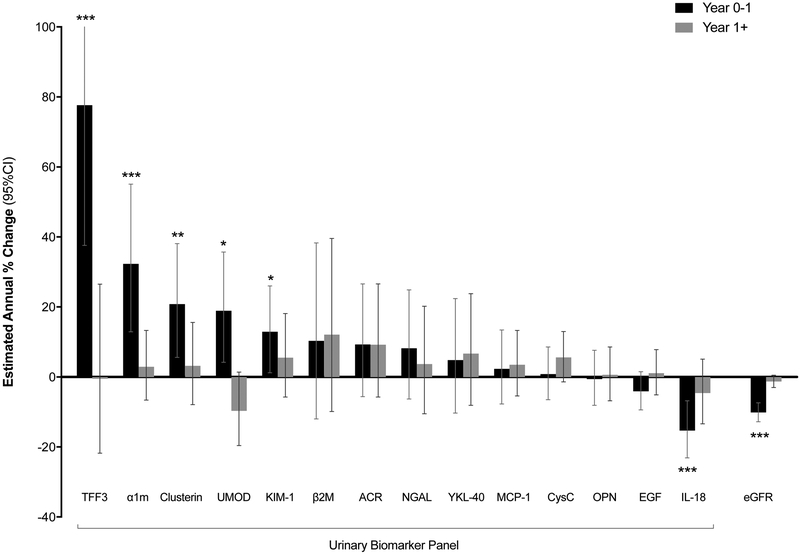
Figure 2. Association of TDF initiation with changes in urinary biomarker concentrations.
The black bars (“year 0-1”) denote the relative percent changes in concentrations of each biomarker that occurred during the first year of TDF use. The white bars (“year 1+”) denote the annual percent changes in concentrations of each biomarker that occurred after year 1. Error bars denote the 95% confidence intervals (CIs). Estimated annual percent changes were calculated from separate linear mixed models using all 198 participants, controlling for time on TDF (using linear spline with cutpoint at year 1) and urine creatinine. The y-axis is truncated at 100%. The 95% CI upper bound for change of TFF3 is truncated and extends to 129.1%. * p < 0.05. ** p < 0.01. *** p < 0.001. Numeric values of percent changes for each biomarker, 95% CI, and p-values are presented in Supplementary Table 2. Full names for each biomarker are as follows: trefoil factor 3 (TFF3), α1-microglobulin (α1m), clusterin, uromodulin (UMOD), kidney injury molecule-1 (KIM-1), β2-microglobulin (β2M), albumin-creatinine ratio (ACR), neutrophil gelatinase-associated lipocalin (NGAL), anti-chitinase-3-like protein 1 (YKL-40), monocyte chemoattractant protein-1 (MCP-1), cystatin C (CysC), osteoponin (OPN), epidermal growth factor (EGF), and interleukin-18 (IL-18). eGFR = estimated glomerular filtration rate.

