

Abstract
Introduction
Fractures are a common reason for admission to hospital around the world. Varying incidences have been reported but these are mainly based on small studies from individual centres. The aim of our study was to analyse fracture admissions in England over a ten-year period.
Methods
Data were collated from the Hospital Episodes Statistics database. Since 2004, data have been collected for all admitted patients in England using the International Classification of Diseases codes for the primary diagnosis. Data were analysed for the ten-year period between 2004–2005 and 2013–2014.
Results
There were 2,489,052 fracture admissions in England over the 10-year study period. The risk of admission for fracture was 47.84 per 10,000 population. The rate of fracture admission has remained stable. Hip fractures were the most common fracture requiring hospitalisation (n=641,263), followed by distal radius fractures (n=406,313), ankle fractures (n=332,617) and hand fractures (n=244,013). Hip fractures accounted for 58% of hospital bed days, ankle fractures for 10%, and femoral shaft fractures and subtrochanteric femoral fractures for 5% each. The number of bed days per year for hip fractures has reduced from 1,549,939 bed days in 2004–2005 to 1,319,642 in 2013–2014.
Conclusions
This study provides an updated picture of the incidence of fractures that required hospital admission over a ten-year period in England. It may be used as a platform from which the effect of modern patient treatment pathways can be monitored.
Keywords: Fracture, Hospital admission, Fracture incidence
Fractures are a common reason for admission to hospital around the world. Varying incidences have been reported but these are mainly based on small studies from individual centres.
It is important to know the incidence of fractures (especially the number of patients admitted to hospital) to allow adequate resource allocation for the most common fractures and to inform research opportunities to improve outcomes.1–3 The most accurate analysis of fracture incidence has been established from national hip fracture registries, with several countries collecting data. In England, Wales and Northern Ireland, there are approximately 65,000 hip fractures per year.4 Previous studies have noted wide variations in reported fracture incidences, ranging from 98 to 132.7 per 10,000 population.5,6
There are very few studies analysing hospital admissions for fractures. The limited number of studies raise questions regarding the trends for such admissions, namely whether the incidence of admissions is truly increasing, and whether the volume and management of fractures presents an increasing burden to limited healthcare resources. The aim of our study was to analyse the number of fracture admissions in England over a ten-year period
Methods
Data on all admitted patients in England between 2004–2005 and 2013–2014 were collected from the Hospital Episodes Statistics database. The data were analysed using the International Classification of Diseases (ICD) codes for the primary diagnosis. The numbers of admissions and finished consultant episodes (FCEs) for fracture cases were calculated. A FCE is defined as a continuous period of admitted patient care under one consultant within one healthcare provider whereas an admission lasts from when a patient is admitted to hospital until he or she is discharged to the community. It is important to note that a patient may be coded as having several FCEs during a single period of hospitalisation. The FCE data were further stratified according to patient age.
Owing to the considerable variation in coding, multiple ICD codes were combined to give an accurate representation of different types of fracture admissions; for example, the codes S82.3, S82.4, S82.5, S82.6 and S82.8 were used to identify ankle fractures (Table 1). Some codes were excluded because of the indeterminate nature of the code (eg S52.7 [multiple fractures of forearm], S62.8 [fracture of other and unspecified parts of wrist and hand], S72.7 [multiple fractures of femur], S72.8 [fractures of other parts of femur] and S72.9 [fracture of femur, part unspecified]). These data were included in the overall number of fracture admissions but not used in the fracture specific analysis. Pelvic fractures were also excluded owing to the large number of pubic fractures that were admitted for reasons other than fracture treatment (ie social/care admissions to medical wards).
Table 1.
International Classification of Diseases (ICD) codes used for fractures
| Fracture | ICD codes |
| Clavicle | S42.0 Fracture of clavicle |
| Proximal humerus | S42.2 Fracture of upper end of humerus |
| Humerus shaft | S42.3 Fracture of shaft of humerus |
| Distal humerus and elbow | S42.4 Fracture of lower end of humerus S52.0 Fracture of upper end of ulna S52.1 Fracture of upper end of radius |
| Ulna/radius shaft | S52.2 Fracture of shaft of ulna S52.3 Fracture of shaft of radius S52.4 Fracture of shafts of both ulna and radius |
| Distal radius | S52.5 Fracture of lower end of radius S52.6 Fracture of lower end of both ulna and radius S52.8 Fracture of other parts of forearm |
| Carpal bones | S62.0 Fracture of navicular [scaphoid] bone of hand S62.1 Fracture of other carpal bone(s) |
| Hand | S62.2 Fracture of first metacarpal bone S62.3 Fracture of other metacarpal bone S62.4 Multiple fractures of metacarpal bones S62.5 Fracture of thumb S62.6 Fracture of other finger S62.7 Multiple fractures of fingers |
| Hip (intracapsular + extracapsular) | S72.0 Fracture of neck of femur S72.1 Pertrochanteric fracture |
| Femur shaft (subtrochanteric + shaft) | S72.2 Subtrochanteric fracture S72.3 Fracture of shaft of femur |
| Distal femur | S72.4 Fracture of lower end of femur |
| Patella | S82.0 Fracture of patella |
| Proximal tibia | S82.1 Fracture of upper end of tibia |
| Tibia shaft | S82.2 Fracture of shaft of tibia |
| Ankle | S82.3 Fracture of lower end of tibia S82.4 Fracture of fibula alone S82.5 Fracture of medial malleolus S82.6 Fracture of lateral malleolus S82.8 Fractures of other parts of lower leg |
| Foot | S92.0 Fracture of calcaneus S92.1 Fracture of talus S92.2 Fracture of other tarsal bone(s) S92.3 Fracture of metatarsal bone S92.4 Fracture of great toe S92.5 Fracture of other toe S92.7 Multiple fractures of foot S92.9 Fracture of foot, unspecified |
General population data for England were obtained from the Office for National Statistics7 to calculate fracture incidence rates per 10,000 population. Fracture data were analysed using Excel® (Microsoft, Redmond, WA, US).
Results
There were 2,489,052 fracture admissions in England during the 10-year period studied (Fig 1). The highest annual number of admissions occurred in 2009–2010 (n=264,940).
Figure 1.

Number of fracture admissions per year
The risk of admission for fracture over the 10-year period was 47.84 per 10,000 population. The rate of fracture admission has remained relatively stable between 44.53 and 50.76 per 10,000 population per year.
The most common fracture requiring hospital admission was a hip fracture (27%, n=641,263). This was followed by distal radius fractures (17%, n=406,313), ankle fractures (14%, n=332,617) and hand fractures (10%, n=244,013).
There were 3,025,018 FCEs in the 10-year study period. The number of FCEs increased steadily over the years, with 261,556 recorded in 2004–2005 and 324,770 in 2013–2014.
The number of hospital admissions and FCEs for each fracture type can be compared in Figure 2. The largest difference by far is in the hip fracture cohort.
Figure 2.

Number of admissions and finished consultant episodes (FCEs) by fracture type
The frequency of the different types of fractures in different age groups is shown in Figures 3–6. More detailed information on the three most common types of fracture for each age group is given in Table 2.
Figure 3.

Number of finished consultant episodes (FCEs) for fracture patients aged ≤14 years
Figure 6.
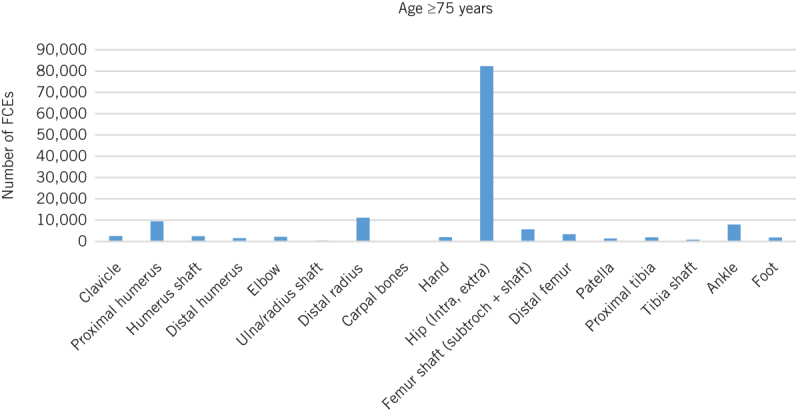
Number of finished consultant episodes (FCEs) for fracture patients aged ≥75 years
Table 2.
The three most common types of fracture by age
| Age | Fracture type | Finished consultant episodes |
| ≤14 years | Distal radius | 121,340 (35%) |
| Distal humerus | 47,032 (14%) | |
| Hand | 31,389 (9%) | |
| 15–59 years | Ankle | 216,619 (24%) |
| Hand | 191,530 (21%) | |
| Distal radius | 141,259 (15%) | |
| 60–74 years | Hip | 128,537 (30%) |
| Distal radius | 80,340 (19%) | |
| Ankle | 72,146 (17%) | |
| ≥75 years | Hip | 728,714 (61%) |
| Distal radius | 104,545 (9%) | |
| Proximal humerus | 72,279 (6%) |
Figure 4.

Number of finished consultant episodes (FCEs) for fracture patients aged 15–59 years
Figure 5.

Number of finished consultant episodes (FCEs) for fracture patients aged 60–74 years
Hospital admissions for clavicle, carpal and proximal humerus fractures increased significantly over the study period. There were 3,065 clavicle fracture admissions in 2004–2005, rising to 7,280 in 2013–2014. For carpal fractures, there were 744 and 1,382 admissions respectively while for proximal humerus fractures, the respective numbers were 7,568 and 12,869. The percentage change in the number of fracture admissions over the study period for each type of fracture is shown in Figure 7.
Figure 7.

Percentage change in number of fracture admissions from 2004–2005 to 2013–2014 by fracture type
Over the ten-year study period, hip fractures accounted for 58% of hospital bed days (n=14,233,813), ankle fractures for 10% (n=2,578,111), femoral shaft fractures for 5% (n=1,311,141) and subtrochanteric femoral fractures for 5% (n=1,167,966) (Fig 8). The number of bed days for hip fracture patients reduced dramatically from 1,549,939 bed days in 2004–2005 to 1,319,642 in 2013–2014. This is despite a rise in the number of admissions from 78,998 to 101,897.
Figure 8.

Percentage of inpatient bed days by fracture type
Discussion
A recent study found the incidence of fractures to be 116.3 per 10,000 people aged over 50 years.8 This figure included all fractures that were documented on the Clinical Practice Research Datalink database. A further study of patients over the age of 50 years at a university hospital reported an incidence of 98 per 10,000 suffering an appendicular skeletal fracture.9
Previous studies have noted variable rates of fracture incidence. Court-Brown et al calculated a fracture incidence of 132.78 per 10,000 people per year5 and Donaldson et al found an incidence of 360 per 10,000.6 There have also been many other studies from several countries looking at fracture incidences in various defined populations.10–12 The results of our study indicated that 47.84 fractures per 10,000 required hospital admission, leading us to conclude that more than 50% of fractures were managed without hospitalisation.
Previous studies have assessed the incidence of fractures over time. Court-Brown et al compared the incidence estimated from a study of fractures in Dundee, Scotland, and Oxford, England, in 1954–1958 with that from a similar cohort of fractures in Edinburgh, Scotland, in 2010–-2011.5 The incidence increased by 50% between the two time periods. Lyritis et al showed a 100% increase in the incidence of hip fractures between 1977 and 2002.13 Our study demonstrated a slight increase in the annual number of hospital admissions but this was found to have plateaued near the end of the study period.
Hip fractures represent a large burden on the National Health Service, with an acute care cost of almost £400 million.14 Unsurprisingly, hip fractures account for the most fracture admissions and by far the most bed days. A promising development is that the number of bed days per year that result from these fractures has reduced by over 200,000 in 10 years, highlighting the effects of optimisation of care in the hip fracture pathways. This finding is corroborated by independent data from the National Hip Fracture Database, which shows a decreasing average length of stay.4 The fact that the difference between the number of hospital admissions and FCEs for hip fractures is so much larger than for all the other fracture types (Fig 2) suggests that a significant number of hip fractures are sustained in hospital and that initiatives to reduce the incidence of inpatient falls should continue to be supported.
A further reason maybe that due to the long length of stay and mulitidisciplinary management, these patients may be registered under several different consultants during there admission.
Wrist and ankle fractures represent a further burden of hospital admissions. It may be that recent guidance for these injuries, supported by contemporary research, moves the inertia of care away from hospital towards more ambulatory/functional pathways delivered in the community.15,16
The number of admitted proximal humerus fractures has increased by 70% over ten years. This may reflect an increased incidence in an elderly population but it could also represent increased surgical management of these injuries.
Study limitations
This study has several limitations. It did not look at the actual incidence of fractures, only those requiring hospitalisation. For this reason, it is not an absolute indicator of fracture incidence as it is subject to variations in treatment strategies and patient pathways. Furthermore, it was not possible to determine the number of patients who received surgical management for their fracture as hospital admission is not a reliable surrogate marker for surgery. One cannot therefore draw any conclusions regarding management trends.
It is also the case that several codes are fairly ambiguous, an example being S62.8 (fracture of other and unspecified parts of wrist and hand). These patients were included in our overall figures for admission due to fracture but were excluded from our fracture specific analysis as it was not clear what anatomical injury had been sustained.
Pelvic fractures were not included in this study. This was because of the large number of pelvic fractures that undergo non-operative treatment and are admitted under medical wards. A community cohort study reported that almost 60% of patients with a pelvic fracture require an inpatient stay but most of these patients do not undergo surgical treatment.17
Despite these limitations, this is the first study to look at the incidence of patients admitted to hospital in England for fractures. The findings add to our current knowledge on the incidence of fractures and lead the way for more detailed analysis of the incidence of specific fractures as well as trends in incidence and fracture management.
Conclusions
This study provides an updated picture of the incidence of fractures that required hospital admission over a ten-year period in England. It may be used as a platform from which the effect of modern patient treatment pathways can be monitored.
References
- 1.Aitken SA, Hutchison JD, McQueen MM, Court-Brown CM. The importance of epidemiological fracture data: injury epidemiology for the non-epidemiologist. Bone Joint J 2014; : 863–867. [DOI] [PubMed] [Google Scholar]
- 2.Clement ND, Aitken S, Duckworth AD et al. Multiple fractures in the elderly. J Bone Joint Surg Br 2012; : 231–236. [DOI] [PubMed] [Google Scholar]
- 3.Court-Brown CM, Clement ND, Duckworth AD et al. The spectrum of fractures in the elderly. Bone Joint J 2014; : 366–372. [DOI] [PubMed] [Google Scholar]
- 4.Royal College of Physicians National Hip Fracture Database (NHFD) Annual Report 2015. London: RCP; 2015. [Google Scholar]
- 5.Court-Brown CM, Biant L, Bugler KE, McQueen MM. Changing epidemiology of adult fractures in Scotland. Scott Med J 2014; : 30–34. [DOI] [PubMed] [Google Scholar]
- 6.Donaldson LJ, Reckless IP, Scholes S et al. The epidemiology of fractures in England. J Epidemiol Community Health 2008; : 174–180. [DOI] [PubMed] [Google Scholar]
- 7.Office for National Statistics Estimates of the population for the UK, England and Wales, Scotland and Northern Ireland. https://www.ons.gov.uk/peoplepopulationandcommunity/populationandmigration/populationestimates/datasets/populationestimatesforukenglandandwalesscotlandandnorthernireland (cited December 2018).
- 8.Curtis EM, van der Velde R, Moon RJ et al. Epidemiology of fractures in the United Kingdom 1988–2012: variation with age, sex, geography, ethnicity and socioeconomic status. Bone 2016; : 19–26. [DOI] [PMC free article] [PubMed] [Google Scholar]
- 9.Ong T, Sahota O, Marshall L. Epidemiology of appendicular skeletal fractures: a cross-sectional analysis of data from the Nottingham Fracture Liaison Service. J Orthop Sci 2015; : 517–521. [DOI] [PubMed] [Google Scholar]
- 10.Abrahamsen B, Jørgensen NR, Schwarz P. Epidemiology of forearm fractures in adults in Denmark: national age- and gender-specific incidence rates, ratio of forearm to hip fractures, and extent of surgical fracture repair in inpatients and outpatients. Osteoporos Int 2015; : 67–76. [DOI] [PubMed] [Google Scholar]
- 11.Dimai HP, Svedbom A, Fahrleitner-Pammer A et al. Epidemiology of proximal humeral fractures in Austria between 1989 and 2008. Osteoporos Int 2013; : 2,413–2,421. [DOI] [PubMed] [Google Scholar]
- 12.Siggeirsdottir K, Aspelund T, Jonsson BY et al. Epidemiology of fractures in Iceland and secular trends in major osteoporotic fractures 1989–2008. Osteoporos Int 2014; : 211–216. [DOI] [PubMed] [Google Scholar]
- 13.Lyritis GP, Rizou S, Galanos A, Makras P. Incidence of hip fractures in Greece during a 30-year period: 1977–2007. Osteoporos Int 2013; : 1,579–1,585. [DOI] [PubMed] [Google Scholar]
- 14.National Clinical Guideline Centre The Management of Hip Fracture in Adults. London: NCGC; 2011. [Google Scholar]
- 15.British Orthopaedic Association; British Orthopaedic Foot and Ankle Society BOAST 12: The Management of Ankle Fractures. London: BOA; 2016. [Google Scholar]
- 16.British Orthopaedic Association; British Society for Surgery of the Hand BOAST 12: The Management of Distal Radius Fractures. London: BOA; 2017. [Google Scholar]
- 17.Prieto-Alhambra D, Avilés FF, Judge A et al. Burden of pelvis fracture: a population-based study of incidence, hospitalisation and mortality. Osteoporos Int 2012; : 2,797–2,803. [DOI] [PubMed] [Google Scholar]