

Abstract
Background/Aim:
The GALAD score is a serum biomarker-based model that predicts the probability of having hepatocellular carcinoma (HCC) in patients with chronic liver disease. We aimed to assess the performance of the GALAD score in comparison to liver ultrasound for detection of HCC.
Methods:
A single center cohort of 111 HCC and 180 controls with cirrhosis or chronic hepatitis B and a multicenter cohort of 233 early HCC and 412 cirrhosis patients from the Early Detection Research Network (EDRN) Phase 2 HCC Study were analyzed.
Results:
The area under the ROC curve (AUC) of the GALAD score for HCC detection was 0.95 [95% confidence interval (CI): 0.93–97], which was higher than the AUC of ultrasound (0.82, P<0.01). At a cut off of −0.76, the GALAD score had a sensitivity of 91% and a specificity of 85% for HCC detection. The AUC of the GALAD score for early stage HCC detection remained high at 0.92 [95%CI: 0.88–0.96] (cut off −1.18, sensitivity 92%, specificity 79%). The AUC of the GALAD score for HCC detection was 0.88 (95% CI, 0.85–0.91) in the EDRN cohort. The combination of GALAD and ultrasound (GALADUS score) further improved the performance of the GALAD score in the single center cohort, achieving an AUC of 0.98 [95%CI: 0.96–0.99] (cut off –0.18, sensitivity 95%, specificity 91%).
Conclusions:
The performance of the GALAD score was superior to ultrasound for HCC detection. The GALADUS score further enhanced the performance of the GALAD score.
Impact:
The GALAD score was validated in the US.
Keywords: biomarker, liver cancer, liver ultrasonography
Introduction
Hepatocellular carcinoma (HCC) has been rising in incidence and mortality rates in the United States. HCC is a leading cause of cancer related death in many parts of the world and liver cancer is the second global cause of cancer related years of life lost after lung cancer.(1) The increasing disease burden from HCC has been attributed to the rise in prevalence of chronic liver diseases that put patients at risk of developing HCC.(2) Most HCCs occur in patients with cirrhotic liver disease, whose annual rate of liver cancer incidence is 1–5%.(3) About a quarter of cirrhosis patients die from HCC as the tumors are frequently detected at an advanced symptomatic stage at which effective treatment options are limited.(3–5) In order to achieve early detection of HCC in asymptomatic patients, HCC surveillance is recommended for high risk patients in order to improve outcomes.(6–8) A number of studies have shown that HCC surveillance is associated with earlier detection of HCCs and improved outcomes of patients with HCC.(9–11)
Liver ultrasound is a standard HCC surveillance test, and biannual liver sonography has been the strategy recommended by the American Association for the Study of Liver Diseases (AASLD), the European Association for the Study of the Liver (EASL), and the Asian Pacific Association for the Study of the Liver (APASL).(6–8,12) However, the sensitivity of ultrasound for HCC detection has been reported to be 40–80%.(9,13) The sensitivity of ultrasound for HCC detection can be compromised by severity of liver disease, particular etiologies of liver disease (NASH or alcohol) and high BMI.(14) For this reason, up to 30–40% of tumors detected under surveillance are beyond early stage HCC.(9,15,16) Given the limited performance of ultrasound as a surveillance test, alpha-fetoprotein (AFP) is often used in addition to ultrasound and a recent study from Taiwan showed that the use of AFP in addition to ultrasound significantly improves the sensitivity of surveillance compared to US alone without significant loss of specificity.(17) However, serum AFP level is affected by hepatic inflammation. Elevation of AFP in the absence of HCC can be often seen in the presence of enhanced hepatocyte destruction and regeneration, particularly in patients with chronic viral hepatitis. Pregnant woman or patients with gonadal tumors may have falsely elevated AFP, which limits its utility as a surveillance test.(18,19)
Recently, the GALAD score was proposed as a statistical model for estimating the likelihood of the presence of HCC in individual patients with chronic liver disease.(20,21) The GALAD score is derived from Gender, Age, AFP-L3, AFP and Des-carboxy-prothrombin (DCP) and was shown to be a highly accurate model for the detection of HCC. (20,21) Prior studies have shown that biomarker performance varies with geographic region, being influenced by differences in the etiologic and patient factors in different regions. For example, AFP was shown to be a highly effective surveillance test in Alaska and Asia where HBV is a major etiology. 22 Performance of AFP was suboptimal in studies from Western countries where HCV is the leading etiology.(22,23) The performance of the GALAD score has been validated in the UK, Germany, Japan and Hong Kong, but has not as yet been evaluated in the US. Further, the performance of the GALAD score in comparison to ultrasound remains to be determined.
The aim of this study was 1) to investigate the performance of the GALAD score for the detection of HCC in US cohorts, 2) to compare the performance of the GALAD score to liver ultrasound, 3) to develop a novel risk score model combining the GALAD score and liver ultrasound results.
Methods
Patients in the Mayo Test Cohort
The study was approved by the Mayo Clinic Institutional Review Board. Individuals who gave research authorization and written informed consent were included in the current study. For the test cohort, eligible patients were identified using the Mayo Clinic institutional clinical database.
The control group consisted of patients who were candidates for HCC surveillance, namely those with cirrhosis or chronic hepatitis B without HCC seen at Mayo Clinic between October 2013 and October 2016, 1) who were tested for AFP, AFP-L3% and DCP as part of their regular clinical care, or 2) had provided stored serum with research consent authorization for the measurement of AFP, AFP-L3% and DCP. Control patients were required to have at least 6 months of follow up after GALAD score assessment to confirm the absence of HCC or have a negative contrast enhanced multiphasic CT, MRI, or liver biopsy at the time of GALAD score assessment.
The case group consisted of patients with newly diagnosed HCC in the setting of cirrhosis or chronic hepatitis B during the same study period, 1) who were tested for AFP, AFP-L3% and DCP as part of their regular clinical care, or 2) had provided stored serum with research consent authorization for the measurement of AFP, AFP-L3% and DCP at the time of tumor diagnosis. Any patients who were on warfarin were excluded as warfarin can elevate the DCP level in the absence of HCC.
Clinical information
Demographic and clinical characteristics of patients were abstracted closest to the time of blood collection within a maximum time window of three months. Cirrhosis was defined by 1) histology, or 2) findings characteristic of cirrhosis or portal hypertension in cross-sectional imaging studies (nodular configuration of the liver or signs of portal hypertension such as intraabdominal or esophageal varices, splenomegaly, dilated portal vein, or ascites) and/or thrombocytopenia (platelets <150K).(10,24)
HBV infection as the underlying cause of the liver disease was confirmed based on positive HBsAg. HCV was confirmed by HCV RNA or anti-HCV with chronic liver disease. Alcohol was considered as a cause of HCC when a patient had a documented history of alcoholic liver disease or significant history of alcohol abuse or alcohol addiction.(25) NAFLD or NASH was diagnosed with radiologic or histologic evidence of fatty infiltration or inflammation in the setting of risk factors for fatty liver disease (metabolic syndrome) without any history of significant alcohol intake (<20 g per day) at HCC diagnosis or at any time before HCC diagnosis.(26) When more than one etiology were identified in a patient (e.g. alcohol abuse and HCV), one was chosen using the best judgement of the clinician as the factor contributing most to the patient’s liver dysfunction. The diagnosis of HCC was made by dynamic contrast CT or MRI of the liver or biopsy based on the guidelines of the AASLD.(7)
Ultrasound (US) results at the time of blood collection were abstracted from medical records in order to compare the performance of GALAD to US. A positive ultrasound result was defined by the presence of a solid hepatic lesion. Serum biomarkers were measured using the WAKO μTASWako i30 Immunoanalyzer.
Multicenter EDRN Cohort
Data from the National Cancer Institute Early Detection Research Network (EDRN) phase 2 biomarker case-control study for HCC were obtained for further multicenter evaluation of the performance of the GALAD score in the US. New biomarkers are typically evaluated through 5 different phases of biomarker development (Phase 1, preclinical exploratory studies; Phase 2, clinical assay development and validation with case-control studies; Phase 3, retrospective longitudinal repository studies; Phase 4, prospective screening studies; Phase 5, randomized cancer control studies).(27) The aim of a phase 2 biomarker study is to develop a novel clinical assay and validate it in the setting of a case and control study design.
Briefly, the study included 233 consecutive early stage HCC patients and 412 cirrhosis controls without HCC seen between February 2005 and August 2007 at seven tertiary referral centers in the US.(28) The presence of cirrhosis was defined by histology or clinical evidence of portal hypertension in subjects with chronic liver disease. Subjects in the control group had an US, CT, or MRI showing no evidence of a hepatic mass within 6 months prior to enrollment. Patients with an AFP ≥20 ng/mL at enrollment were also required to have a CT or MRI showing no mass suggestive of HCC within the 3 months prior to enrollment or up to 2 weeks after consent. All controls were assessed by AFP and imaging 6 months after enrollment to ensure that they did not have HCC. Serum AFP was measured by automated systems (Wako, Mountain View, CA) at the time of enrollment prior to HCC specific treatment.
Statistical analysis
The Chi-square test or Fisher`s Exact test were used to compare categorical variables and the Student T or Wilcoxon Rank sum test for continuous variables. The GALAD score was calculated as −10.08 + 1.67 × [Gender (1 for male, 0 for female)] + 0.09 × [Age] + 0.04 × [AFP-L3%] + 2.34 × log[AFP] + 1.33 × log[DCP].(20) A web-based calculator is available at: http://www.mayoclinic.org/medical-professionals/model-end-stage-liver-disease/galad. The area under the Receiver Operating Characteristics Curve (AUC) was calculated to assess the performance of the GALAD score for the detection of HCC. Subgroup analyses were performed to investigate the performance of the GALAD score in subgroups of patients with different gender, age, AFP, etiologies, BMI, cirrhosis status, hepatic dysfunction, and tumor stage.
Youden’s index was used to find the optimal GALAD cut offs from which sensitivity, specificity, and their corresponding 95% confidence intervals (CI) were calculated and compared with that of liver US.(29) The GALADUS score was developed combining GALAD and liver ultrasound for the detection of HCC using multivariable logistic regression analysis containing all variables in the GALAD score and liver ultrasound.
As the GALAD and GALADUS are constructed based on tests performed on the same individuals, statistical analysis on differences between curves should take into account the correlated nature of the data. Therefore, the comparison of the AUCs was performed using Delong test, which is a nonparametric statistical test comparing the areas under two or more correlated receiver operating curves.(30)
Statistical analysis was carried out using SAS 9.4 (SAS Institute, Cary NC) and R version 3.0.2 (R Foundation, Vienna, Austria).
Results
Clinical Characteristics of Mayo Test Cohort
A total of 291 patients (111 cases, 180 controls) were eligible and analyzed. Demographic and clinical characteristics of the patients were summarized in Table 1. The proportion of males was higher among HCC patients (78%) than patients in the control group (53%) (P<0.01). HCC patients were older than patients in the control group (64 vs 57, P<0.01). HCV was the leading etiology of HCC (43%) while NASH was the most common etiology of liver disease in the control group (27%) (P<0.01). A small number of patients did not have liver cirrhosis (2 HCCs, 26 controls) in the setting of HBV etiology.
Table 1.
Clinical characteristics of Mayo Clinic cohort
| HCC (N=111) |
Control (N=180) |
p value | |
|---|---|---|---|
| Age, mean (SD) | 63.9 (8.6) | 57.1 (11.6) | <0.01 |
| Age < 60 | 32 (28.8%) | 91 (50.6%) | |
| Age ≥ 60 | 79 (71.2%) | 89 (49.4%) | |
| Gender | <0.01 | ||
| Female | 25 (22.5%) | 84 (46.7%) | |
| Male | 86 (77.5%) | 96 (53.3%) | |
| Race | 0.39 | ||
| White | 86 (77.5%) | 148 (82.2%) | |
| Asian | 8 (7.2%) | 14 (7.8%) | |
| Non-White/Asian | 17 (15.3%) | 18 (10.0%) | |
| Child-Pugh | 0.56 | ||
| Missing | 4 | 19 | |
| A | 78 (72.9%) | 112 (69.6%) | |
| B-C | 29 (27.1%) | 49 (30.4%) | |
| Etiology | <0.01 | ||
| HCV | 48 (43.2%) | 33 (18.3%) | |
| HBV | 11 (9.9%) | 27 (15.0%) | |
| Alcohol | 14 (12.6%) | 37 (20.6%) | |
| NASH | 30 (27.0%) | 49 (27.2%) | |
| Others | 8 (7.2%) | 34 (18.9%) | |
| Cirrhosis | 109 (98.2%) | 154 (85.6%) | <0.01 |
| BMI | 0.72 | ||
| ≤30 | 58 (52.3%) | 96 (55.8%) | |
| 30–35 | 26 (23.4%) | 41 (23.8%) | |
| >35 | 27 (24.3%) | 35 (20.3%) | |
| Platelet count, median [IQR] | 99.0 [70.0, 195.0] | 130.0 [93.0, 180.0] | 0.023 |
| ALT, median [IQR] | 51.0 [36.5, 85.0] | 32.0 [22.0, 49.0] | <0.01 |
| ALT < 40 | 37 (33.3%) | 119 (67.2%) | |
| ALT ≥ 40 | 74 (66.7%) | 58 (32.8%) | |
| FIB-4, median [IQR] | 7.0 [4.2, 10.0] | 3.5 [1.9, 6.1] | <0.01 |
| AFP, median [IQR] | 39.8 [7.4, 462.0] | 3.3 [2.2, 5.5] | <0.01 |
| AFP < 20 | 47 (42.3%) | 176 (97.8%) | |
| AFP ≥ 20 | 64 (57.7%) | 4 (2.2%) | |
| DCP, median [IQR] | 9.5[2.2, 151.0] | 0.6 [0.3, 2.0] | <0.01 |
| L3, median [IQR] | 12.8 [6.9, 32.3] | 1.0 [1.0, 9.2] | <0.01 |
| Ascites | 0.77 | ||
| 0 (no ascites) | 76 (68.5%) | 117 (65.4%) | |
| 1 (controlled ascites) | 28 (25.2%) | 47 (26.3%) | |
| 2 (refractory ascites) | 7 (6.3%) | 15 (8.4%) | |
| GALAD_Z, mean (SD) | 3.8 (4.4) | −2.6 (1.9) | <0.01 |
| US Lesion | <0.01 | ||
| Missing | 21 | 7 | |
| Negative | 10 (11.1%) | 136 (78.6%) | |
| Positive | 80 (88.9%) | 37 (21.4%) | |
| Tumor Stage | NA | ||
| Very Early (BCLC 0) | 16 (14.5%) | ||
| Early (BCLC A) | 44 (39.6%) | ||
| Non-early (BCLC B-D) | 51 (45.9%) |
As expected, the mean GALAD score was higher in HCC patients than in control patients (3.8 vs. −2.6, P<0.01). More than half of the HCC patients had very early (n=16, 14%) or early stage (n=44, 40%) HCC at diagnosis based on the BCLC staging classification.
Performance of GALAD for the detection of HCC in comparison to liver ultrasound
The AUC of the GALAD score for HCC detection was 0.95 [95% confidence interval (CI): 0.93–0.97] (Table 2; Figure 1 A). At an optimal cut off of −0.76, the GALAD score had a sensitivity of 91% and a specificity of 85% for HCC detection. The AUC of the GALAD score was higher than that of ultrasound for HCC detection (0.95 vs 0.82, P<0.01).
Table 2.
Performance of GALAD within subgroups of Mayo Clinic cohort
| Sensitivity (95% CI) | Specificity (95% CI) | AUC (95% CI)† | ||||||
|---|---|---|---|---|---|---|---|---|
| Subgroups | GALAD Cut off |
GALAD | US | GALAD | US | GALAD | US | P* |
| Overall | −0.76 | 0.91 (0.84, 0.96) | 0.89 (0.81, 0.95) | 0.85 (0.79, 0.90) | 0.79 (0.72, 0.84) | 0.95 (0.93, 0.97) | 0.82 (0.77, 0.87) | <0.01 |
| Gender | ||||||||
| Men | 0.27 | 0.84 (0.74, 0.91) | 0.87 (0.77,0.94) | 0.92 (0.84, 0.96) | 0.80 (0.71,0.88) | 0.95 (0.92,0.97) | 0.83 (0.77,0.89) | <0.001 |
| Women | −1.04 | 0.88 (0.69, 0.97) | 0.95 (0.76,1.00) | 0.95 (0.88, 0.99) | 0.77 (0.66,0.85) | 0.94 (0.88,1.00) | 0.80 (0.71,0.88) | 0.001 |
| Age | ||||||||
| Age<60 | −1.41 | 0.97 (0.84, 1.00) | 0.89 (0.71,0.98) | 0.89 (0.81, 0.95) | 0.78 (0.67,0.86) | 0.98 (0.96,1.00) | 0.80 (0.72,0.87) | <0.001 |
| Age≥60 | 0.34 | 0.82 (0.72, 0.90) | 0.89 (0.78,0.95) | 0.91 (0.83, 0.96) | 0.80 (0.70,0.88) | 0.93 (0.89,0.97) | 0.84 (0.77,0.89) | 0.006 |
| AFP | ||||||||
| AFP<20 | −1.18 | 0.89 (0.77, 0.96) | 0.87 (0.72,0.96) | 0.81 (0.74, 0.86) | 0.79 (0.72,0.85) | 0.90 (0.86,0.95) | 0.80 (0.74,0.85) | <0.01 |
| AFP≥20 | 3.91 | 0.69 (0.56, 0.80) | 0.90 (0.79,0.97) | 1.00 (0.28, 1.00) | 0.75 (0.19,0.99) | 0.87 (0.72,1.00) | 0.89 (0.78,0.96) | 0.37 |
| Etiology | ||||||||
| HCV | −0.53 | 0.94 (0.83, 0.99) | 0.92 (0.80, 0.98) | 0.85 (0.68, 0.95) | 0.74 (0.55, 0.88) | 0.95 (0.90, 1.00) | 0.85 (0.74, 0.92) | 0.02 |
| HBV | −1.68 | 1.00 (0.62, 1.00) | 1.00 (0.47, 1.00) | 1.00 (0.82, 1.00) | 0.85 (0.66, 0.96) | 1.00 (1.00, 1.00) | 0.88 (0.73, 0.97) | 0.01 |
| Alcohol | −1.18 | 1.00 (0.68, 1.00) | 0.77 (0.46, 0.95) | 0.73 (0.56, 0.86) | 0.70 (0.53, 0.84) | 0.93 (0.86, 0.99) | 0.72 (0.58, 0.84) | <0.01 |
| NASH | −0.85 | 0.87 (0.69, 0.96) | 0.85 (0.66, 0.96) | 0.84 (0.70, 0.93) | 0.83 (0.70, 0.93) | 0.89 (0.81, 0.97) | 0.84 (0.74, 0.91) | 0.18 |
| Others | 0.27 | 1.00 (0.52, 1.00) | 1.00 (0.19, 1.00) | 1.00 (0.85, 1.00) | 0.80 (0.61, 0.92) | 1.00 (1.00, 1.00) | 0.82 (0.65, 0.93) | <0.01 |
| BMI | ||||||||
| ≤30 | 0.34 | 0.867 (0.75, 0.94) | 0.91 (0.79, 0.98) | 0.95 (0.88, 0.98) | 0.75 (0.65, 0.83) | 0.97 (0.95, 0.99) | 0.80 (0.72, 0.86) | <0.01 |
| 30–35 | 0.11 | 0.88 (0.70, 0.98) | 0.89 (0.67, 0.99) | 0.95 (0.83, 0.99) | 0.75 (0.59, 0.87) | 0.97 (0.93, 1.00) | 0.80 (0.67, 0.89) | <0.01 |
| >35 | −1.42 | 0.89 (0.71, 0.98) | 0.85 (0.65, 0.96) | 0.80 (0.63, 0.92) | 0.88 (0.73, 0.97) | 0.87 (0.78, 0.97) | 0.87 (0.75, 0.94) | 0.50 |
| Ascites | ||||||||
| 0 (no ascites) | −0.18 | 0.95 (0.87, 0.99) | 0.91 (0.81, 0.96) | 0.91 (0.84, 0.96) | 0.78 (0.69, 0.85) | 0.97 (0.95, 0.99) | 0.83 (0.76, 0.88) | <0.01 |
| 1 (controlled ascites) | −0.27 | 0.95 (0.75, 0.97) | 0.85 (0.62, 0.97) | 0.85 (0.72, 0.94) | 0.81 (0.67, 0.91) | 0.96 (0.92, 1.00) | 0.82 (0.71, 0.90) | <0.01 |
| 2 (refractory ascites) | −0.20 | 1.00 (0.42, 1.00) | 0.83 (0.36, 1.00) | 1.00 (0.70, 1.00) | 0.73 (0.45, 0.92) | 1.00 (1.00, 1.00) | 0.76 (0.53, 0.92) | 0.01 |
| Child Pugh | ||||||||
| A | −0.85 | 0.92 (0.84, 0.97) | 0.94 (0.85, 0.98) | 0.84 (0.76, 0.90) | 0.77 (0.67, 0.84) | 0.94 (0.91, 0.98) | 0.83 (0.76, 0.88) | <0.01 |
| B-C | 0.42 | 0.83 (0.64, 0.94) | 0.74 (0.52, 0.90) | 0.96 (0.86, 1.00) | 0.77 (0.62, 0.88) | 0.95 (0.91, 0.99) | 0.76 (0.64, 0.85) | <0.01 |
| ALT | ||||||||
| < 40 | −1.01 | 0.95 (0.82, 0.99) | 0.84 (0.66, 0.95) | 0.86 (0.78, 0.91) | 0.84 (0.76, 0.90) | 0.95 (0.92, 0.99) | 0.84 (0.77, 0.89) | <0.01 |
| ≥ 40 | 0.38 | 0.84 (0.73, 0.91) | 0.92 (0.81, 0.97) | 0.95 (0.86, 0.99) | 0.67 (0.53, 0.79) | 0.94 (0.91, 0.98) | 0.80 (0.71, 0.87) | <0.01 |
| Tumor stage | ||||||||
| Very Early (BCLC 0) | −1.70 | 1.00 (0.70, 1.00) | 0.67 (0.35, 0.90) | 0.72 (0.64, 0.78) | 0.79 (0.72, 0.84) | 0.91 (0.85, 0.96) | 0.78 (0.71, 0.84) | <0.01 |
| Early (BCLC 0-A) | −1.18 | 0.92 (0.82, 0.97) | 0.92 (0.81, 0.98) | 0.79 (0.73, 0.85) | 0.79 (0.72,0.84) | 0.92 (0.88, 0.96) | 0.82 (0.76, 0.87) | <0.01 |
| Non early (BCLC B-D) | 0.27 | 0.92 (0.81, 0.98) | 0.85 (0.69, 0.94) | 0.94 (0.90, 0.97) | 0.79 (0.72,0.85) | 0.99 (0.97, 1.00) | 0.80 (0.74, 0.85) | <0.01 |
p-value looking at difference in AUC between GALAD and US;
For the calculation of AUC the continuous GALAD score is used (whereas for sensitivity and specificity we used the GALAD cutoff)
Figure 1.
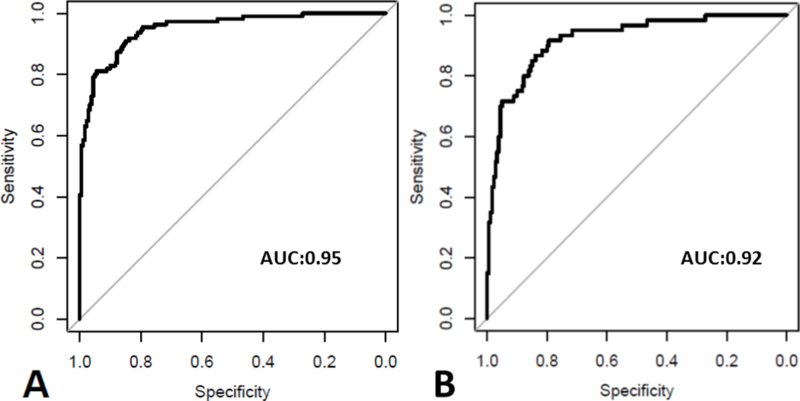
The ROC of GALAD scores for HCC diagnosis in each subgroup (Mayo cohort) X- axis: Specificity; Y-axis: Sensitivity, 1A- The ROC of GALAD score for detection of HCC, 1B- The ROC of GALAD score for detection of early stage HCC
The AUC for GALAD remained high in subgroups of patients with different gender, age, AFP level, and HCC etiologies (Table 2). For instance, the GALAD score had a sensitivity of 89% and a specificity of 81% for AFP negative tumor detection at a cut off of −1.18 and the ROC of the GALAD score was higher than that of ultrasound (0.90 vs. 0.80, P<0.01). On the other hand, the AUC of ultrasound for HCC detection was low at 0.72 in patients with alcohol etiology. Ascites and High CTP class compromised the performance of ultrasound, but did not affect the performance of the GALAD score (Table 2).
When the analysis was limited to early stage HCC (BCLC 0-A), the AUC for the GALAD score remained high at 0.92 [95%CI: 0.88–0.96] (best cut off −1.18, sensitivity 92%, specificity 79%) (Table 2; Figure 1 B). The AUC of the GALAD score was higher than that of ultrasound for detection of early stage (0.92 vs 0.82, P<0.01) and very early stage HCC (0.91 vs 0.78, P<0.001). Overall results remain excellent when the analysis was limited to cirrhotic cases and controls only (109 HCC; 154 controls) or after frequency matching of the Child Pugh Score between cases and controls (105 HCC; 105 controls) (Supplementary Table 1, 2).
When the GALAD score cut off was set at −0.63, the best cut-off of GALAD score reported in the previous study, the performance of GALAD score remains excellent (Supplementary Table 3). The GALAD score had a sensitivity of 89% and a specificity of 86% for HCC detection with a sensitivity of 82% and a specificity of 86% for early stage and a sensitivity of 73% and a specificity of 86% for very early stage tumor detection.
Performance of GALAD for the detection of early stage HCC in the Multicenter EDRN cohort
A total of 412 patients with cirrhosis without HCC and 233 patients with early stage HCC, 10 of whom had very early stage tumor, included in the EDRN cohort were analyzed. The clinical characteristics of the patients are summarized in Supplementary Table 4. The AUC of the GALAD score for HCC detection was 0.88 [95% CI: 0.85–91] (Table 3). At a cut off of −0.17, the GALAD score had a sensitivity of 76% and a specificity of 86% for HCC detection. The AUC of the GALAD score for detection of very early stage was 0.86 [95% CI: 0.76–96] (Table 3) The AUC of GALAD remained excellent in subgroups of patients with different HCC etiologies (Table 3; Figure 2). When the GALAD score cut off was set at −0.63, the GALAD score had a sensitivity of 79% and a specificity of 79% for HCC detection (Table 3).
Table 3.
Cutoffs for GALAD score at the Maximum Sensitivity and Specificity in the Receiver Operating Characteristic Curve in the EDRN multicenter cohort
| Subgroups | GALAD Cut off |
Sensitivity (95% CI) | Specificity (95% CI) | GALAD Cut off |
Sensitivity (95% CI) | Specificity (95% CI) | AUC (95% CI) |
|---|---|---|---|---|---|---|---|
|
Overall
(233 HCCs, 412 controls ) |
−0.17 | 76% (70%−82%) | 86% (82%−89%) | −0.63 | 79% (74%−84%) | 79% (75%−83%) | 0.88 (0.85–0.91) |
| Etiology Subgroup | |||||||
| Alcohol (24HCCs, 48 controls ) |
0.82 | 71% (49%−87%) | 92% (80%−98%) | −0.63 | 83% (67%−96%) | 67% (54%−79%) | 0.89 (0.81–0.97) |
| HBV (46HCCs, 23 controls ) |
−1.25 | 83% (69%−92%) | 100% (85%−100%) | −0.63 | 72% (59%−85%) | 100% (100%−100%) | 0.94 (0.88–0.99) |
| HCV (122HCCs, 240 controls ) |
−0.17 | 79% (70%−85%) | 85% (80%−89%) | −0.63 | 82% (75%−88%) | 77% (72%−82%) | 0.89 (0.86–0.92) |
| Non-Viral/Alcohol* (41HCCs, 101 controls ) |
−0.16 | 78% (62%−89%) | 93% (86%−97%) | −0.63 | 78% (63%−90%) | 85% (78%−92%) | 0.88 (0.81–0.96) |
| AFP | |||||||
| AFP<20 (95HCCs, 360 controls ) |
−1.27 | 77% (67%−85%) | 73% (68%−78%) | −0.63 | 55% (44%−64%) | 85% (81%−88%) | 0.80 (0.75–0.85) |
| AFP20 (137HCCs, 48 controls ) |
2.39 | 72% (63%−79%) | 90% (77%−97%) | −0.63 | 96% (93%−99%) | 38% (25%−52%) | 0.87 (0.81–0.93) |
| Tumor stage | |||||||
| Very Early (BCLC 0) (10HCCs, 412 controls ) |
−0.16 | 80% (44%−97%) | 86% (83%−89%) | −0.63 | 80% (50%−100%) | 79% (75%−83%) | 0.86 (0.76–0.96) |
Non-Viral/Alcohol refers to all other etiologies combined other than alcohol, HBV and HCV.
Figure 2.
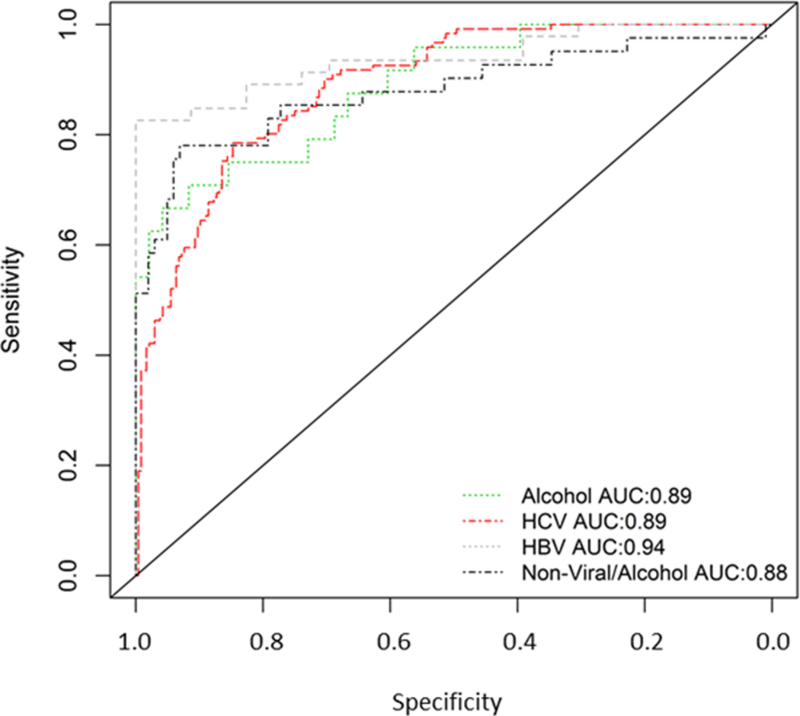
The ROC of GALAD scores for HCC diagnosis in each subgroups of patients with different etiologies (EDRN cohort), X- axis: Specificity; Y-axis: Sensitivity
Proposal of GALADUS score in the Mayo Test Cohort
Next, we evaluated whether the combination of liver ultrasound and GALAD score further enhances the performance of HCC detection compared to the performance of either test alone. Combining GALAD and liver ultrasound significantly improved the performance of the model (Supplementary Table 5). The new model was named GALADUS score and the equation is as follows: GALADUS = −12.79 + 0.09*age + 1.74* (1 for male, 0 for female) + 2.44*log10(AFP) + 0.04*AFPL3 + 1.39*log10(DCP) + 3.56* (1 for positive ultrasound, 0 for negative ultrasound). The AUC of the GALADUS score for HCC detection was 0.98 [95% CI: 0.96–0.99] (Figure 3A). At the GALADUS cutoff of −0.179, the sensitivity was 95% with a specificity of 0.91%. When the analysis was limited to early stage HCC (BCLC 0-A), the AUC for the GALADUS score remained high at 0.97 [95%CI: 0.95–0.99] (best cut off −0.5, sensitivity 88%, specificity 94%) (Figure 3B).
Figure 3.
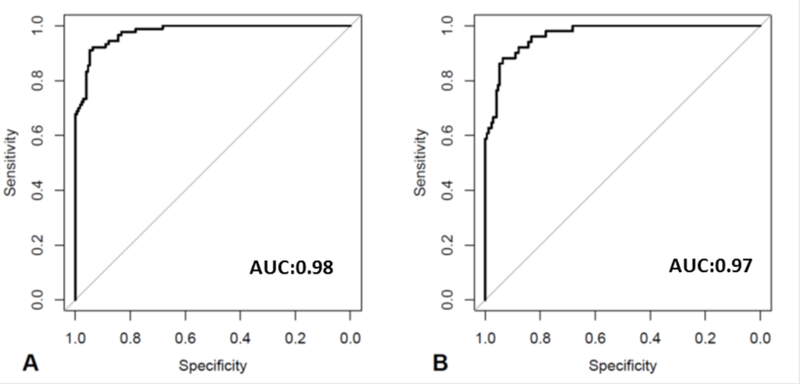
The ROC of GALADUS scores for HCC diagnosis, X- axis: Specificity; Y-axis: Sensitivity, 3A- The ROC of GALADUS score for detection of HCC, 3B- The ROC of GALADUS score for detection of early stage HCC
Discussion
In the current study, the excellent performance of the GALAD score for the detection of HCC was confirmed for the first time in a US cohort. First, the performance of the GALAD score was shown to be superior to that of ultrasound. The performance of the GALAD score remained excellent for the detection of early stage HCC including tumors with negative AFP. Gender, age group, underlying etiology of HCC, and severity of liver dysfunction did not affect the performance of the GALAD score, while the performance of ultrasound was hampered in patients with poorly controlled ascites or Child Pugh class of B or C cirrhosis. The outstanding performance of the GALAD score was confirmed in an independent multicenter US cohort of early stage HCC and cirrhosis patients, confirming the utility of the GALAD score as an excellent tool for HCC detection. Finally, we proposed the GALADUS score, which combines the GALAD score and liver ultrasound for the detection of HCC and showed improved performance over liver ultrasound or GALAD score alone, although the minimal improvement of the AUC of GALDUS over GALAD may not be clinically relevant.
The GALAD score was first developed from a single UK center using a statistical model that could determine the risk of HCC in individual patients with chronic liver diseases using objective measures, particularly serological tumor markers.(20) The AUC of the GALAD score for detection of all HCCs was 0.97, with an AUC of 0.96 for detection of early stage HCC and an AUC of 0.98 for detection of advanced stage HCC.(20) In a German cohort, the GALAD score achieved a sensitivity of 92% and a specificity of 90% at the cut off of −0.63. The GALAD score was subsequently validated in a larger multi-center, multi-continent study.(21) This study included 2,430 patients with HCC and 4,404 with chronic liver disease recruited from Germany, Japan, and Hong Kong. Similar to the original study, the overall AUCs of GALAD for HCC detection were 0.93 (95% CI, 0.92–0.94) and 0.94 (95% CI, 0.93–0.96) for the Japanese and German validation cohorts, respectively. Similar to our study results, the GALAD score provided a sensitivity of 88% and specificity of 88% at the cut off of −0.68 in the German cohort.(21) Another study of 98 patients from Italy (44 chronic liver disease patients and 54 HCC patients) reported that the overall AUC of GALAD for HCC detection was 0.98.(31)
Liver ultrasound is a standard HCC surveillance test endorsed by several societies including AASLD, EASL, and APASL.(6,7,12) However, there are several major limitations of ultrasound as a surveillance test for HCC.(9) The performance of ultrasound in surveillance is highly dependent on the skill of the sonographer. In addition, detecting an early HCC nodule can be challenging, particularly in a patient with a nodular cirrhotic liver.
A recent single center study of 941 patients with cirrhosis showed that 20% of ultrasounds in those patients were inadequate for excluding HCC.(14) Similar to our current study, decreased performance of ultrasound for detection of HCC was independently demonstrated in patients with alcohol induced liver cirrhosis (OR 2.11, 95% CI 1.33–3.37) or patients with advanced stages of liver disease (Child-Pugh class B or C cirrhosis; OR 1.93, 95% CI 1.32–2.81). The GALAD score may therefore serve as an invaluable surveillance test in these subgroups as its performance did not significantly decrease with etiology or severity of liver disease. Furthermore, use of the GALAD score may decrease the risk of surveillance-related physical harms by identifying patients with false positive ultrasound results and may maximize the potential benefit by identifying patients with false negative ultrasound results. (16)
From the public or global heath standpoint, the GALAD score can be used in the parts of the world where medical resources are limited and liver ultrasound is not widely available or easily affordable. The GALAD score is easily calculated and may serve as an excellent screening test, thus increasing the uptake and compliance with surveillance and consequently improving the effectiveness of the surveillance program.
Our current study has several limitations. Given the retrospective design of this phase 2 biomarker study, the results could have been affected by unmeasured potential biases. As the study was performed on subjects seen at major referral centers, the results could be susceptible to referral bias. In order to minimize the concerns related to single center study designs, we also analyzed data from the NCI EDRN Phase 2 HCC biomarker and confirmed the excellent performance of the GALAD score for HCC detection in this multicenter US cohort. A recent interim report of a randomized controlled trial (ultrasound + biomarker vs. ultrasound alone) showed that addition of three biomarkers (AFP, AFP L3% and DCP) increased the sensitivity of HCC surveillance in comparison to ultrasound alone, although number of new HCC cases was small (n=20).(32) Similarly, an interim analysis of a small phase 3 biomarker study showed that a GALAD score >1.95 had a sensitivity of 90% 6 months prior to HCC diagnosis. Similar to the previous study, the small number of incident cases (n=14) is a major limitation.(33) Both studies have been reported in abstract form. A larger phase three prospective multicenter Early Detection Research Network - HCC Early Detection Strategy study (HEDS) is currently underway to identify novel biomarkers for HCC. We plan to further validate the performance of GALAD and GALADUS scores in comparison to ultrasound in this large prospective cohort of cirrhotic patients in which the optimum cut-offs of the GALAD and GALADUS scores will be further defined. We expect that the optimum cut off of the GALAD/GALADUS score will vary depending on the baseline characteristics of the at risk population as it does for AFP. The small sample size in the current study prohibited robust analysis to propose a specific cut off for each subgroup. Nonetheless, our data clearly showed that the performance of the GALAD score remains excellent at a cut off of −0.63, the best cut-off for the GALAD score reported in the previous study. Therefore, this would be a reasonable cut off to use until more robust data become available.
In conclusion, the excellent performance of the GALAD score was shown for the first time in the US. In addition, in this first study comparing the performance of the GALAD score to ultrasound, we showed that the GALAD score has superior performance to ultrasound for HCC detection. The GALAD score is complementary to ultrasound for the detection of HCC and it will be particularly important in group of patients with advanced stage hepatic dysfunction or obesity who are at risk for false negative ultrasound. Finally, we proposed the GALADUS score incorporating the GALAD score and liver ultrasound result, which was shown to be superior to either ultrasound or GALAD score alone. Although the benefit of GALADUS over GALAD was minimal in this case-control study, any change in clinical practice would require US + GALAD vs US alone in a prospective setting and judgment as to the relative values of the two approaches (individually) or as a combination (as in GALADUS) should await the outcome of such study. Further evaluation of the GALAD and GALADUS scores will be performed in a larger phase three prospective multicenter cohort biomarker study, where their utility for detection of early HCC will be tested in the setting of HCC surveillance. Future studies should investigate the cost-effectiveness of GALAD or GALADUS over liver ultrasound with/without AFP before its wide implementation in clinical practice.
Supplementary Material
Acknowledgments
Funding: This publication was supported by Grant Number T32 DK07198 from the National Institute of Diabetes and Digestive and Kidney Diseases (NIDDK) (to JY) and CA165076 from the National Cancer Institute (NCI), the Mayo Clinic Center for Cell Signaling in Gastroenterology (NIDDK P30DK084567), the Mayo Clinic Cancer Center (CA15083), and the Mayo Clinic Center for Translational Science Activities (NIH/NCRR CTSA Grant Number UL1 TR000135)(to LRR). Biomarker assays were performed by Wako Diagnostics. Its contents are solely the responsibility of the authors and do not necessarily represent the official views of the NIH.
Abbreviations:
- AASLD
American Association for the Study of Liver Diseases
- AFP
alpha-fetoprotein
- APASL
Asian Pacific Association for the Study of the Liver
- EDRN
Early Detection Research Network
- EASL
European Association for the Study of the Liver
- HCC
Hepatocellular carcinoma
- US
Ultrasound
Footnotes
Conflict of Interest:
LRR has received grant funding from BTG, Gilead Sciences and Wako Diagnostics; HY is an employee of Wako Diagnostics. No other potential conflict of interest for the rest of authors.
Reference
- 1.Fitzmaurice C, Allen C, Barber RM, Barregard L, Bhutta ZA, Brenner H, et al. Global, Regional, and National Cancer Incidence, Mortality, Years of Life Lost, Years Lived With Disability, and Disability-Adjusted Life-years for 32 Cancer Groups, 1990 to 2015: A Systematic Analysis for the Global Burden of Disease Study. JAMA oncology 2017;3(4):524–48 doi 10.1001/jamaoncol.2016.5688. [DOI] [PMC free article] [PubMed] [Google Scholar]
- 2.Ryerson AB, Eheman CR, Altekruse SF, Ward JW, Jemal A, Sherman RL, et al. Annual Report to the Nation on the Status of Cancer, 1975–2012, featuring the increasing incidence of liver cancer. Cancer 2016;122(9):1312–37 doi 10.1002/cncr.29936. [DOI] [PMC free article] [PubMed] [Google Scholar]
- 3.Yang JD, Roberts LR. Hepatocellular carcinoma: A global view. Nat Rev Gastroenterol Hepatol 2010;7(8):448–58 doi 10.1038/nrgastro.2010.100. [DOI] [PMC free article] [PubMed] [Google Scholar]
- 4.Yang JD, Kim B, Sanderson SO, St Sauver JL, Yawn BP, Pedersen RA, et al. Hepatocellular carcinoma in olmsted county, Minnesota, 1976–2008. Mayo Clinic proceedings 2012;87(1):9–16 doi 10.1016/j.mayocp.2011.07.001. [DOI] [PMC free article] [PubMed] [Google Scholar]
- 5.Yang JD, Mannalithara A, Piscitello AJ, Kisiel JB, Gores GJ, Roberts LR, et al. Impact of Surveillance for Hepatocellular Carcinoma on Survival in Patients with Compensated Cirrhosis. Hepatology (Baltimore, Md) 2017. doi 10.1002/hep.29594. [DOI] [PMC free article] [PubMed] [Google Scholar]
- 6.EASL-EORTC clinical practice guidelines: management of hepatocellular carcinoma. J Hepatol 2012;56(4):908–43 doi 10.1016/j.jhep.2011.12.001. [DOI] [PubMed] [Google Scholar]
- 7.Bruix J, Sherman M. Management of hepatocellular carcinoma: an update. Hepatology 2011;53(3):1020–2 doi 10.1002/hep.24199. [DOI] [PMC free article] [PubMed] [Google Scholar]
- 8.Omata M, Cheng AL, Kokudo N, Kudo M, Lee JM, Jia J, et al. Asia-Pacific clinical practice guidelines on the management of hepatocellular carcinoma: a 2017 update. Hepatology international 2017;11(4):317–70 doi 10.1007/s12072-017-9799-9. [DOI] [PMC free article] [PubMed] [Google Scholar]
- 9.Yang JD, Kim WR. Surveillance for hepatocellular carcinoma in patients with cirrhosis. Clin Gastroenterol Hepatol 2012;10(1):16–21 doi 10.1016/j.cgh.2011.06.004. [DOI] [PubMed] [Google Scholar]
- 10.Yang JD, Harmsen WS, Slettedahl SW, Chaiteerakij R, Enders FT, Therneau TM, et al. Factors that affect risk for hepatocellular carcinoma and effects of surveillance. Clinical gastroenterology and hepatology : the official clinical practice journal of the American Gastroenterological Association 2011;9(7):617–23.e1 doi 10.1016/j.cgh.2011.03.027. [DOI] [PubMed] [Google Scholar]
- 11.Singal AG, Pillai A, Tiro J. Early detection, curative treatment, and survival rates for hepatocellular carcinoma surveillance in patients with cirrhosis: a meta-analysis. PLoS medicine 2014;11(4):e1001624 doi 10.1371/journal.pmed.1001624. [DOI] [PMC free article] [PubMed] [Google Scholar]
- 12.Tan CH, Low SC, Thng CH. APASL and AASLD Consensus Guidelines on Imaging Diagnosis of Hepatocellular Carcinoma: A Review. Int J Hepatol 2011;2011:519783 doi 10.4061/2011/519783. [DOI] [PMC free article] [PubMed] [Google Scholar]
- 13.Singal AG, Conjeevaram HS, Volk ML, Fu S, Fontana RJ, Askari F, et al. Effectiveness of hepatocellular carcinoma surveillance in patients with cirrhosis. Cancer Epidemiol Biomarkers Prev 2012;21(5):793–9 doi 10.1158/1055-9965.epi-11-1005. [DOI] [PMC free article] [PubMed] [Google Scholar]
- 14.Simmons O, Fetzer DT, Yokoo T, Marrero JA, Yopp A, Kono Y, et al. Predictors of adequate ultrasound quality for hepatocellular carcinoma surveillance in patients with cirrhosis. Alimentary pharmacology & therapeutics 2017;45(1):169–77 doi 10.1111/apt.13841. [DOI] [PMC free article] [PubMed] [Google Scholar]
- 15.Singal AG, Conjeevaram HS, Volk ML, Fu S, Fontana RJ, Askari F, et al. Effectiveness of hepatocellular carcinoma surveillance in patients with cirrhosis. Cancer Epidemiol Biomarkers Prev 2012;21(5):793–9 doi 10.1158/1055-9965.EPI-11-1005. [DOI] [PMC free article] [PubMed] [Google Scholar]
- 16.Atiq O, Tiro J, Yopp AC, Muffler A, Marrero JA, Parikh ND, et al. An assessment of benefits and harms of hepatocellular carcinoma surveillance in patients with cirrhosis. Hepatology 2016. doi 10.1002/hep.28895. [DOI] [PMC free article] [PubMed] [Google Scholar]
- 17.Chang TS, Wu YC, Tung SY, Wei KL, Hsieh YY, Huang HC, et al. Alpha-Fetoprotein Measurement Benefits Hepatocellular Carcinoma Surveillance in Patients with Cirrhosis. Am J Gastroenterol 2015;110(6):836–44 doi 10.1038/ajg.2015.100. [DOI] [PubMed] [Google Scholar]
- 18.Kakisaka K, Kataoka K, Onodera M, Suzuki A, Endo K, Tatemichi Y, et al. Alpha-fetoprotein: A biomarker for the recruitment of progenitor cells in the liver in patients with acute liver injury or failure. Hepatology research : the official journal of the Japan Society of Hepatology 2015;45(10):E12–20 doi 10.1111/hepr.12448. [DOI] [PubMed] [Google Scholar]
- 19.Yang JD, Dai J, Singal AG, Gopal P, Addissie BD, Nguyen MH, et al. Improved Performance of Serum Alpha-Fetoprotein for Hepatocellular Carcinoma Diagnosis in HCV Cirrhosis with Normal Alanine Transaminase. Cancer epidemiology, biomarkers & prevention : a publication of the American Association for Cancer Research, cosponsored by the American Society of Preventive Oncology 2017;26(7):1085–92 doi 10.1158/1055-9965.epi-16-0747. [DOI] [PMC free article] [PubMed] [Google Scholar]
- 20.Johnson PJ, Pirrie SJ, Cox TF, Berhane S, Teng M, Palmer D, et al. The detection of hepatocellular carcinoma using a prospectively developed and validated model based on serological biomarkers. Cancer Epidemiol Biomarkers Prev 2014;23(1):144–53 doi 10.1158/1055-9965.epi-13-0870. [DOI] [PubMed] [Google Scholar]
- 21.Berhane S, Toyoda H, Tada T, Kumada T, Kagebayashi C, Satomura S, et al. Role of the GALAD and BALAD-2 Serologic Models in Diagnosis of Hepatocellular Carcinoma and Prediction of Survival in Patients. Clinical gastroenterology and hepatology : the official clinical practice journal of the American Gastroenterological Association 2016;14(6):875–86.e6 doi 10.1016/j.cgh.2015.12.042. [DOI] [PubMed] [Google Scholar]
- 22.McMahon BJ, Bulkow L, Harpster A, Snowball M, Lanier A, Sacco F, et al. Screening for hepatocellular carcinoma in Alaska natives infected with chronic hepatitis B: a 16-year population-based study. Hepatology (Baltimore, Md) 2000;32(4 Pt 1):842–6 doi 10.1053/jhep.2000.17914. [DOI] [PubMed] [Google Scholar]
- 23.Lok AS, Sterling RK, Everhart JE, Wright EC, Hoefs JC, Di Bisceglie AM, et al. Des-gamma-carboxy prothrombin and alpha-fetoprotein as biomarkers for the early detection of hepatocellular carcinoma. Gastroenterology 2010;138(2):493–502 doi 10.1053/j.gastro.2009.10.031. [DOI] [PMC free article] [PubMed] [Google Scholar]
- 24.Yang JD, Kim WR, Coelho R, Mettler TA, Benson JT, Sanderson SO, et al. Cirrhosis is present in most patients with hepatitis B and hepatocellular carcinoma. Clinical gastroenterology and hepatology : the official clinical practice journal of the American Gastroenterological Association 2011;9(1):64–70 doi 10.1016/j.cgh.2010.08.019. [DOI] [PMC free article] [PubMed] [Google Scholar]
- 25.Donato F, Tagger A, Gelatti U, Parrinello G, Boffetta P, Albertini A, et al. Alcohol and hepatocellular carcinoma: the effect of lifetime intake and hepatitis virus infections in men and women. American journal of epidemiology 2002;155(4):323–31. [DOI] [PubMed] [Google Scholar]
- 26.Adams LA, Lymp JF, St Sauver J, Sanderson SO, Lindor KD, Feldstein A, et al. The natural history of nonalcoholic fatty liver disease: a population-based cohort study. Gastroenterology 2005;129(1):113–21. [DOI] [PubMed] [Google Scholar]
- 27.Chaiteerakij R, Addissie BD, Roberts LR. Update on biomarkers of hepatocellular carcinoma. Clinical gastroenterology and hepatology : the official clinical practice journal of the American Gastroenterological Association 2015;13(2):237–45 doi 10.1016/j.cgh.2013.10.038. [DOI] [PMC free article] [PubMed] [Google Scholar]
- 28.Marrero JA, Feng Z, Wang Y, Nguyen MH, Befeler AS, Roberts LR, et al. Alpha-fetoprotein, des-gamma carboxyprothrombin, and lectin-bound alpha-fetoprotein in early hepatocellular carcinoma. Gastroenterology 2009;137(1):110–8 doi 10.1053/j.gastro.2009.04.005. [DOI] [PMC free article] [PubMed] [Google Scholar]
- 29.Youden WJ. Index for rating diagnostic tests. Cancer 1950;3(1):32–5. [DOI] [PubMed] [Google Scholar]
- 30.DeLong ER, DeLong DM, Clarke-Pearson DL. Comparing the areas under two or more correlated receiver operating characteristic curves: a nonparametric approach. Biometrics 1988;44(3):837–45. [PubMed] [Google Scholar]
- 31.Caviglia GP, Abate ML, Petrini E, Gaia S, Rizzetto M, Smedile A. Highly sensitive alpha-fetoprotein, Lens culinaris agglutinin-reactive fraction of alpha-fetoprotein and des-gamma-carboxyprothrombin for hepatocellular carcinoma detection. Hepatology research : the official journal of the Japan Society of Hepatology 2016;46(3):E130–5 doi 10.1111/hepr.12544. [DOI] [PubMed] [Google Scholar]
- 32.Sherman M, Feld J, Yamada H, Mori Y, Jassen H. A randomized controlled trial of US vs US+biomarkers for the diagnosis of hepatocellular carcinoma:interim report. Journal of Hepatology 2017;66(S1):532. [Google Scholar]
- 33.El-Serag H, , White D, , Tayob N, , et al. Phase 3 biomarker study for HCC surveillance using AFP, AFP L-3 and DCP. A prospective collection with retrospective blinded evaluation. Journal of Hepatology 2017;66(1):S222–S3. [Google Scholar]
Associated Data
This section collects any data citations, data availability statements, or supplementary materials included in this article.