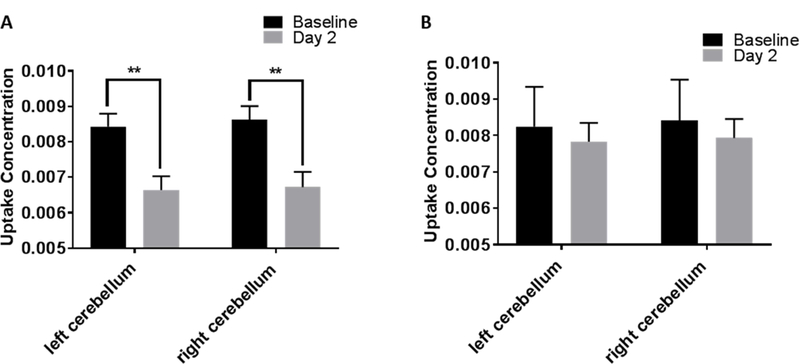
Fig. 3.

Plot showing uptake concentration in left and right cerebellum at baseline and 2 days post injury in NNO (n = 4) and NOR (n = 5) groups. A. In the NNO group, both left and right cerebellum shows change at 2 days post-injury compared to baseline. B. In the NOR group, no change was found in either left or right cerebellum at 2 days post-injury compared to baseline. (**p=0.001; Two-way RM ANOVA; bars = mean +/− SEM).
