

Abstract
Cerebral small vessel disease has been linked to cognitive, psychiatric and physical disabilities, especially in the elderly. However, the underlying pathophysiology remains incompletely understood, largely due to the limited accessibility of these small vessels in the live brain. Here, we report an intravital imaging and analysis platform for high-resolution, quantitative and comprehensive characterization of pathological alterations in the mouse cerebral microvasculature. By exploiting multi-parametric photoacoustic microscopy (PAM), microvascular structure, blood perfusion, oxygenation and flow were imaged in the awake brain. With the aid of vessel segmentation, these structural and functional parameters were extracted at the single-microvessel level, from which vascular density, tortuosity, wall shear stress, resistance and associated cerebral oxygen extraction fraction and metabolism were also quantified. With the use of vasodilatory stimulus, multifaceted cerebrovascular reactivity (CVR) was characterized in vivo. By extending the classic Evans blue assay to in vivo, permeability of the blood-brain barrier (BBB) was dynamically evaluated. The utility of this enabling technique was examined by studying cerebrovascular alterations in an established mouse model of high-fat diet-induced obesity. Our results revealed increased vascular density, reduced arterial flow, enhanced oxygen extraction, impaired BBB integrity, and increased multifaceted CVR in the obese brain. Interestingly, the ‘counterintuitive’ increase of CVR was supported by the elevated active endothelial nitric oxide synthase in the obese mouse. Providing comprehensive and quantitative insights into cerebral microvessels and their responses under pathological conditions, this technique opens a new door to mechanistic studies of the cerebral small vessel disease and its implications in neurodegeneration and stroke.
Keywords: Photoacoustic microscopy, single-vessel analysis, cerebrovascular reactivity, blood-brain barrier, obesity
Introduction
Supporting the brain with more than 20% of the oxygen consumed by the whole body at the resting state (Willie et al., 2011), the cerebral vasculature is essential for brain function and survival. Indeed, subtle changes in the autoregulation of the diameter, blood oxygenation or flow of the ubiquitously presented microvessels can disrupt the delicate balance between the oxygen demand and supply, thereby impairing the integrity of the brain (Peterson et al., 2011). Cerebral small vessel disease (CSVD) has been associated with substantial cognitive, psychiatric and physical disabilities in the elderly population (de Laat et al., 2010; Herrmann et al., 2007; Van Der Flier et al., 2005). Moreover, it is involved in 45% and 20% of all cases of dementia and stroke, respectively (Gorelick et al., 2011; Sudlow and Warlow, 1997; Wardlaw et al., 2013).
Associated with blood pressure increase, dyslipidemia, glucose mal-metabolism, and/or insulin resistance (Strazzullo et al., 2010), obesity is increasingly being considered as an important risk factor for CSVD and ischemic stroke (Dearborn et al., 2015; Mokdad et al., 2003). However, the relationship between obesity and cerebrovascular diseases, as well as cardiovascular diseases, remains inconclusive and controversial (Blüher, 2017). Recent studies have shown that obesity is not always associated with poorer outcomes in patients (Ortega et al., 2016). Paradoxically, it sometimes may be associated with lower morbidity and mortality (Kim et al., 2015; Lavie et al., 2015, 2014, 2009). This ongoing controversy underscores the critical need for improved understanding of obesity-induced vascular changes, especially at the microscopic level.
Although attracting increasing attention, the mechanism of CSVD remains largely understudied. A major challenge of investigating CSVD is the limited accessibility of these small vessels in the live brain (Wardlaw et al., 2001). It is particularly the case in clinical settings. Recent advances in computed tomography (CT), magnetic resonance imaging (MRI), and positron emission tomography (PET) have facilitated the diagnosis and treatment monitoring of cerebrovascular diseases in clinics (Banerjee et al., 2016). However, it remains challenging for MRI and PET to image microvessels in the human brain, due to the insufficient spatial resolution (Blair et al., 2017). The new approval of 7-Tesla MRI for the clinical use has enabled functional imaging of the human brain at higher spatial resolution and shown great promise in the diagnosis of cerebrovascular diseases (Duyn, 2018; Harteveld et al., 2016). However, its resolution is still insufficient to resolve the microvasculature. Although capable of imaging microvessels less than 40 μm, CT cannot evaluate some of the important functional parameters, including blood oxygenation (Starosolski et al., 2015). Given the unmet challenge in functional imaging of the brain microvasculature in humans, development of new imaging tools for high-resolution comprehensive characterization of the cerebral microvasculature in animals has attracted considerable attention. A recent breakthrough in medical ultrasound has enabled microvascular imaging in the rodent brain (Errico et al., 2015). Similar to CT, however, it cannot measure blood oxygenation and requires injection of angiographic agents, which may perturb intrinsic physiology of the microcirculation and discourage longitudinal monitoring. Advances in two-photon microscopy (TPM), the technology of choice for intravital imaging of the rodent brain, have enabled visualization of the cerebral vasculature at a much finer spatial scale. However, it also requires injection of angiographic agents (Sakadzić et al., 2010; Shih et al., 2012). Even with the aid of the exogenous agents, some important functional parameters of the microvasculature (e.g., concentration and oxygenation of hemoglobin) remain inaccessible.
Uniquely capable of microvascular imaging based on the endogenous contrast from blood hemoglobin (Hu, 2016; Wang and Hu, 2012), photoacoustic microscopy (PAM) holds great potential to fill the technology gap. By detecting ultrasonic waves generated within the near-diffraction-limited light focus, the optical-resolution PAM has enabled label-free anatomical and functional imaging of the microvasculature in small animals (Lin et al., 2017; Ning et al., 2015b; Yao et al., 2015). In recent years, it has found broad applications in basic and translational brain research (Hu, 2016; Yao and Wang, 2014), including but not limited to functional connectivity (Hariri et al., 2016), neurovascular coupling (Yao et al., 2015), ischemic stroke (Deng et al., 2012; Hu et al., 2011), and Alzheimer’s disease (Da Mesquita et al., 2018). To improve the penetration depth, near-infrared light with relatively low optical scattering in biological tissues has been utilized for photoacoustic excitation, enabling coverage of the entire mouse cortex (Hai et al., 2014). To enable quantification of cerebral oxygen metabolism, multi-parametric PAM has been developed, with allows simultaneous imaging of blood perfusion, oxygenation and flow in the mouse brain (Ning et al., 2015a, 2015b). To circumvent the influence of general anesthesia on brain hemodynamics and metabolism, a head-restraint setting has been developed recently to extend multi-parametric PAM to the awake mouse brain (Cao et al., 2017).
Here, we present a PAM-based new imaging and analysis platform, which enables comprehensive and quantitative characterization of vessel type-specific alterations in the cerebral microvasculature, in terms of the vascular structure (i.e., density, tortuosity and permeability), mechanical property (i.e., wall shear stress, resistance and reactivity), hemodynamics (i.e., blood perfusion, oxygenation and flow), and the associated tissue oxygen extraction and metabolism. Providing new insights into the influence of obesity on microvessels in the brain, this enabling technology is readily and widely applicable to study the CSVD and its roles in ischemic stroke and neurodegenerative diseases.
Methods
Mouse Model of High-fat Diet-induced Obesity
Male CD-1 mice were acquired at the age of 10 weeks (Charles River Laboratory) and randomly divided into two groups on either the normal diet (7912, Harlan Laboratory) or the high-fat diet (D12451, Research Diets). Consisting of 45% fat calories, 35% carbohydrate calories, and 20% protein calories, the high-fat diet had a food energy of 4.73 kcal/g. In contrast, the normal diet has only 17% fat calories, along with 58% carbohydrate calories and 25% protein calories. The two groups of mice were fed different diets for 12 months before the present study. To confirm obesity and metabolic dysfunction in these mice, the body weight, random blood glucose level, cholesterol, triglycerides, high-density lipoprotein (HDL), and low-density lipoprotein (LDL) were measured.
Animal Preparation for PAM Imaging
To prepare the mice for PAM-based awake-brain imaging, the hair in the scalp was first shaved and then depilated by hair removal cream. To avoid infection, povidone iodine was applied to the scalp before an incision was made. After the surgically exposed skull was cleaned, dental cement was applied to it and a nut was attached contralateral to the region of interest (ROI). To alleviate possible pain caused by the surgical procedure, ketoprofen was subcutaneously injected at the dose of 5 mg/kg. Once the cement was solidified and the nut was firmly adhered, the mice were transferred to the head-restraint apparatus in our PAM system. To attenuate possible stress induced by the restraint, the mice were trained for five consecutive days with a daily training session of 45 minutes. The animal behavior was closely monitored to determine whether they were acclimated to the head restraint. The mice that failed more than one training session were excluded from the PAM study.
Following the established protocol (Goldey et al., 2014), the skull over the ROI was carefully thinned using a dental drill at least 24 hours before the imaging experiment. Care was taken to alleviate inflammation and avoid possible damages to the brain. Since the thickness of the thinned-skull window in our preparation (~100 μm) was much larger than 20 μm, no obvious inflammation or microglial activation was expected according to previous studies (Yang et al., 2010). Before the PAM experiment, the mice were briefly anesthetized (<5 minutes) for ROI cleaning and head restraint. Then, they were placed under a water tank, whose bottom was sealed with a piece of optically and acoustically transparent polyethylene membrane. A thin layer of ultrasound gel was applied between the skull window and the membrane for acoustic coupling. Throughout the experiment, the water tank was kept at 37 °C to maintain the brain temperature. The body temperature was also kept at 37 °C using a heating pad. All animal procedures were approved by the Institutional Animal Care and Use Committee at University of Virginia.
Head-restrained Multi-parametric PAM for Awake-brain Imaging
To measure blood oxygenation, two nanosecond-pulsed lasers (BX40-2-G and BX40-2-GR, Edgewave) were utilized in the multi-parametric PAM system (Fig. 1). The two laser outputs with orthogonal polarization states were combined via a polarizing beam splitter (48-545, Edmund Optics) and then coupled into a single-mode optical fiber (P1-460B-FC-2, Thorlabs) through a microscope objective (M-10X, Newport). To achieve high coupling efficiency and to ensure the laser energy was below the damage threshold of the fiber, the combined beam was attenuated by a neutral density filter (NDC-50C-2M, Thorlabs), reshaped by an iris (SM1D12D, Thorlabs), focused by a condenser lens (LA1608, Thorlabs), and filtered again by a pinhole (P50C, Thorlabs) before the fiber coupling. To monitor and compensate for the laser fluctuation, a beam sampler (BSF10-A, Thorlabs) was placed before the fiber coupler to reflect a small portion of the light to a high-speed photodiode (FDS100, Thorlabs). The beam coming out of the fiber was launched into the PAM scan head (enclosed by the red dashed box), where it was first collimated and then focused by a pair of achromatic doublets (AC127-025-A, Thorlabs). An iris (SM05D5, Thorlabs) was placed in between to adjust the beam width. To correct the optical aberration at the water-air interface and to stabilize the water surface during movement of the scan head, a correction lens (LA1207-A, Thorlabs) was applied before a customized ring-shaped ultrasonic transducer (inner diameter: 2.2 mm; outer diameter: 4.0 mm; focal length: 6.0 mm; central frequency: 35 MHz; 6-dB intensity bandwidth: 70%). The laser beam passed through the central opening of the transducer to excite the microvasculature in the mouse brain. A portion of the light-generated ultrasonic waves back-propagated and were detected by the transducer to form PAM images. To ensure maximum sensitivity, the optical and acoustic foci were confocally aligned. Motorized linear stage-based two-dimensional raster scan was used in the present study. With this scan mechanism, it took ~15 minutes to image an area of 2.5×2.5 mm2.
Figure 1. Schematic of the head-restrained multi-parametric PAM for imaging the awake mouse brain.
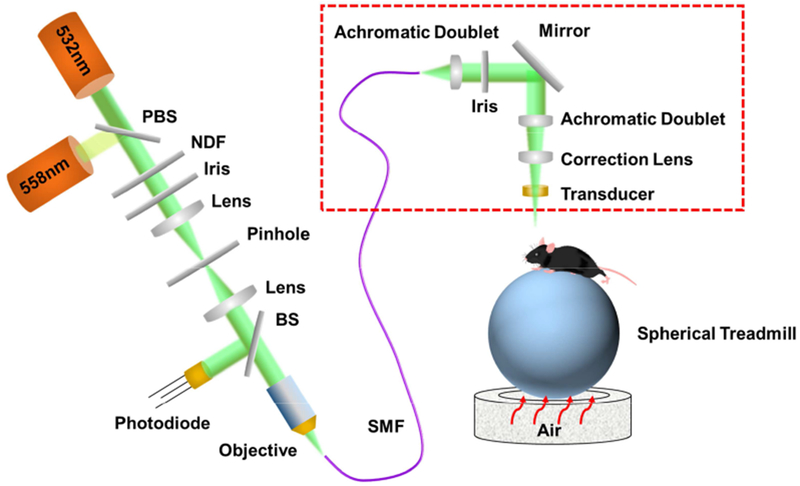
Red dashed box: PAM scan head. PBS, polarizing beam splitter; NDF, neutral density filter; BS, beam sampler; SMF, single-mode fiber.
A head-restraint apparatus, consisting of an adjustable head plate and an air-floated spherical treadmill, was used to fix the head of the awake mouse. Specifically, the nut attached to the skull was fixed to the head plate using a bolt. Then, the mouse head was angularly and vertically adjusted using a rotation mount (RSP-1T, Newport) and a right-angle clamp (RA90, Thorlabs) to align the ROI perpendicular to the scan head for high-resolution imaging. The mouse limbs were comfortably rested on the treadmill, which ensured minimal resistance to voluntary movement.
PAM of the Oxygen Saturation and Total Concentration of Hemoglobin
Capitalizing on the difference in the optical absorption spectra of oxy-hemoglobin and deoxy-hemoglobin (HbO2 and HbR, respectively), dual-wavelength PAM was used to quantify the relative concentrations of HbO2 and HbR ([HbO2] and [HbR], respectively), from which the absolute oxygen saturation of hemoglobin (sO2) can be derived as (Zhang et al., 2007)
| (1) |
Furthermore, the total concentration of hemoglobin (CHb) was quantified in absolute values by statistical analysis of the PAM signals acquired at 532 nm, a near-isosbestic point of hemoglobin. Statistical fluctuation of the PAM A-line amplitude, induced by the Brownian motion of red blood cells (RBCs), was used to estimate the average count of RBCs (NRBC) within the detection volume of PAM as (Zhou et al., 2014)
| (2) |
where E() and Var() are the mean and variance operations, respectively, Amp is the amplitude of the PAM signal, and Noise denotes the noise of the PAM system. Since each RBC contains ~15 pg of hemoglobin, the absolute CHb can be estimated as (Ning et al., 2015b)
| (3) |
where Vol is the detection volume of the PAM system.
PAM of Cerebral Blood Flow
Quantification of the blood flow speed was achieved through correlation analysis of the same set of PAM A-lines used to quantify the CHb. The blood flow induced decorrelation of the sequentially acquired A-lines follows a second-order exponential decay, in which the decay constant is linearly proportional to the flow speed. Thus, the blood flow speed at each scanning position was quantified by correlating the A-line measured at this point with each of the 46 adjacent A-lines to extract the decay constant. Given that the time interval between adjacent A-lines was 100 μs, the correlation window was 4.6 ms. With a step size of ~0.1 μm, the movement of the scan head within this time window was only 4.6 μm, comparable to the average diameter of capillaries. Therefore, our PAM is capable of measuring cerebral blood flow (CBF) down to the capillary level. To extract the structural and hemodynamic parameters of individual microvessels, a previously developed vessel segmentation algorithm was applied (Cao et al., 2017; Oladipupo et al., 2011; Soetikno et al., 2012). This segmentation procedure consists of four steps: (1) manually identify the boundaries of individual vessels; (2) refine the boundaries using Otsu’s method (Sezgin, Mehmet and Sankur, 2004); (3) divide the vessels into segments based on vascular bifurcation; (4) remove overlapping vessels, if any. Combining the average blood flow speed and diameter of individual vessels extracted using the vessel segmentation algorithm, the volumetric blood flow was derived as (Shih et al., 2009)
| (4) |
where D is the vessel diameter and is the average flow speed within the vessel.
PAM of Cerebral Oxygen Extraction and Metabolism
With the aid of vessel segmentation, sO2 values of all feeding arteries and draining veins (saO2 and svO2, respectively) within the ROI were extracted. Consequently, the oxygen extraction fraction (OEF) in this region was calculated as (Yao et al., 2015)
| (5) |
where and denote, respectively, the average sO2 of the feeding arteries and that of the draining veins.
Further, the cerebral metabolic rate of oxygen (CMRO2) was derived using Fick’s law as (Yao et al., 2015)
| (6) |
where ξ is the oxygen binding capacity of hemoglobin (1.36 mL of oxygen per gram hemoglobin), CBFtotal is the total volumetric blood flow through the ROI, and W is the tissue weight estimated by assuming an average cortical thickness of 1.2 mm and a tissue density of 1.05 g/ml.
PAM of the Cerebrovascular Density and Tortuosity
To quantify the vascular density, an amplitude threshold (i.e., 4 times of the standard deviation of the background) was applied to isolate the vascular signal. Then, the pixel number occupied by blood vessels was quantified, from which the vascular density can be estimated as the ratio of the vessel pixel number to the total pixel number.
To quantify the vascular tortuosity, the skeleton of the vessel segment was extracted. Then, the linear distance (S) between the start point and the end point of the skeleton was calculated based on their coordinates, and the actual length (l) of the skeleton was estimated by counting the pixel number. Thus, the vascular tortuosity can be calculated as (Oladipupo et al., 2011)
| (7) |
PAM of the Cerebrovascular Permeability
Evans blue dye was used to measure the permeability of the blood brain barrier (BBB). To avoid general anesthesia during the PAM experiment, a 28-gauge needle connecting to a soft micro-tube was inserted into the tail vein of the mouse and fixed in position right before the imaging experiments, allowing the awake mouse to freely move its tail. A light-weight wood stick (~0.25g) was attached to the tail to avoid dislocation of the needle. After the baseline imaging, 2% (w/v) Evans blue dye was injected at the dose of 4 ml/kg animal’s body weight.
Dynamic quantification of the BBB permeability was achieved by counting the total number of pixels occupied by the extravascular dye in individual time-lapse images. Following the method described in the section on vascular density measurement, the vessel pixel number was quantified in the baseline image acquired prior to Evans blue injection. Thus, the increase in non-background pixels in the post-injection images was due to the dye extravasation. With this, the experimentally measured amount of Evans blue that extravasated out of the cerebral vasculature (V(t)) was fitted to an exponential recovery model (Yao et al., 2009)
| (8) |
where P is the total amount of dye extravasated from the vasculature at the steady state and k is the extravasation coefficient. To extract the extravasation rate, the first-order derivative of V(t) was taken as
| (9) |
PAM of the Mechanical Properties of the Cerebral Microvasculature
The thickness and skeleton of individual microvessels extracted by the segmentation-based analysis granted us the access to important mechanical properties of the cerebral microvasculature. Specifically, the vascular resistance was calculated using Poiseuille’s law as
| (10) |
where η is the blood viscosity (assumed to be 4.88 cP) (Windberger et al., 2003), l is the vessel length, and r is the vessel radius.
Moreover, with the measured volumetric blood flow and vessel radius, the vessel wall shear stress was calculated as (Papaioannou and Stefanadis, 2005)
| (11) |
PAM of Cerebrovascular Reactivity
Traditionally, the cerebrovascular reactivity (CVR) is the ratio of the volumetric blood flow after vasodilatory stimulation to the baseline value. Given the unique capability of the present PAM platform in comprehensive characterization of the cerebral vasculature, we expanded the CVR to a complete set of structural, functional and oxygen-metabolic parameters, including vessel diameter, sO2, flow speed, OEF and CMRO2.
In this study, acetazolamide (ACZ) was used as a vasodilatory stimulus. Before the stimulation, multi-parametric PAM was performed to acquire the baseline values. Then, 50 mg/kg ACZ was intravenously injected into the awake mouse through the implanted needle. The CVR was then comprehensively characterized by comparing the individual structural, functional and metabolic parameters against their baseline values.
Western Blot
The mouse cerebral cortex was micro-dissected and placed in an immunoprecipitation assay buffer supplemented with 1% cocktail of protease and phosphatase inhibitors. The tissue was then homogenized in the buffer and centrifuged at 13,000 rpm for 30 minutes at 4 °C, after which the supernatant was collected. The protein concentration was quantified using the bicinchoninic acid method. Aliquots of protein (30–40 μg/lane) were separated by polyacrylamide gel electrophoresis and blotted onto a polyvinylidene difluoride membrane. The membranes were blocked with a Protein-Free T20 Blocking Buffer (37573, Thermo Fisher Scientific) and then incubated with the rabbit polyclonal antibody to the endothelial nitric oxide synthase (eNOS) and the monoclonal antibody to the phospho-eNOS (1:1000; catalogue number 9572 and 9570, respectively, Cell Signaling Technology) at 4 °C overnight. Band volumes of the target proteins were normalized to those of non-phosphorylated protein. The band volumes of the samples in the obese group were normalized to those in the control group.
Statistical Analysis
The unpaired t-test was used to compare the differences between the two animal groups in Fig. 2, Fig. 4, Fig. 5, Fig. 6, Fig. S1, Fig. S3, Fig. S4, Fig. S5 and Fig. S6. Significant difference, if any, was indicated between the two compared columns. The paired t-test was applied to compare the differences between the parameters measured pre- and post-injection of ACZ within each group, as shown in Fig.4, Fig. 5 Fig. S3, Fig. S5 and Fig. S6. Significant difference, if any, is indicated on the top of the column. The two-way repeated measures ANOVA was used to analyze the repeated measurements in Fig. 3c. The curves in Fig. 3c were obtained using the least squares fitting with R2 values of 0.93 (the control group) and 0.92 (the obese group). All data are presented in mean ± standard deviation. P-values of <0.05 were considered significant.
Figure 2. Obesity-induced changes in cerebrovascular structure and function.
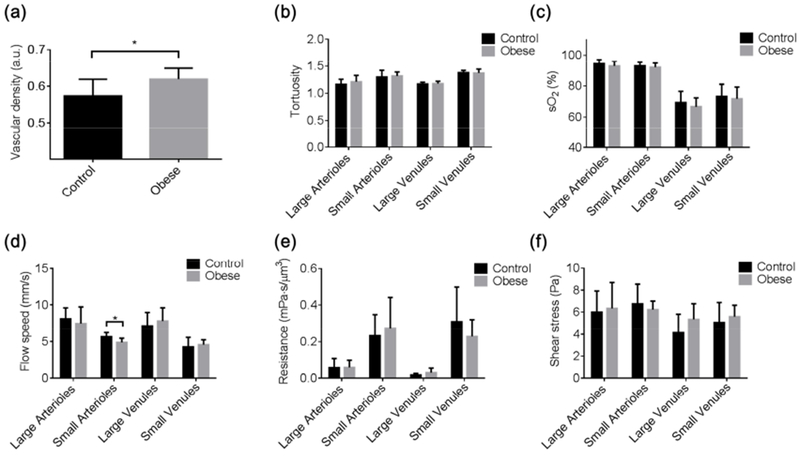
PAM-measured, segmentation-enabled quantification of cerebrovascular alterations in the (a) vascular density, (b) vessel tortuosity, (c) sO2, (d) blood flow speed, (e) vascular resistance, and (f) wall shear stress in control (n=6) and obese (n=8) mice. All data are presented as mean ± standard deviation. *, p<0.05.
Figure 4. Obesity-induced change in cerebrovascular reactivity.
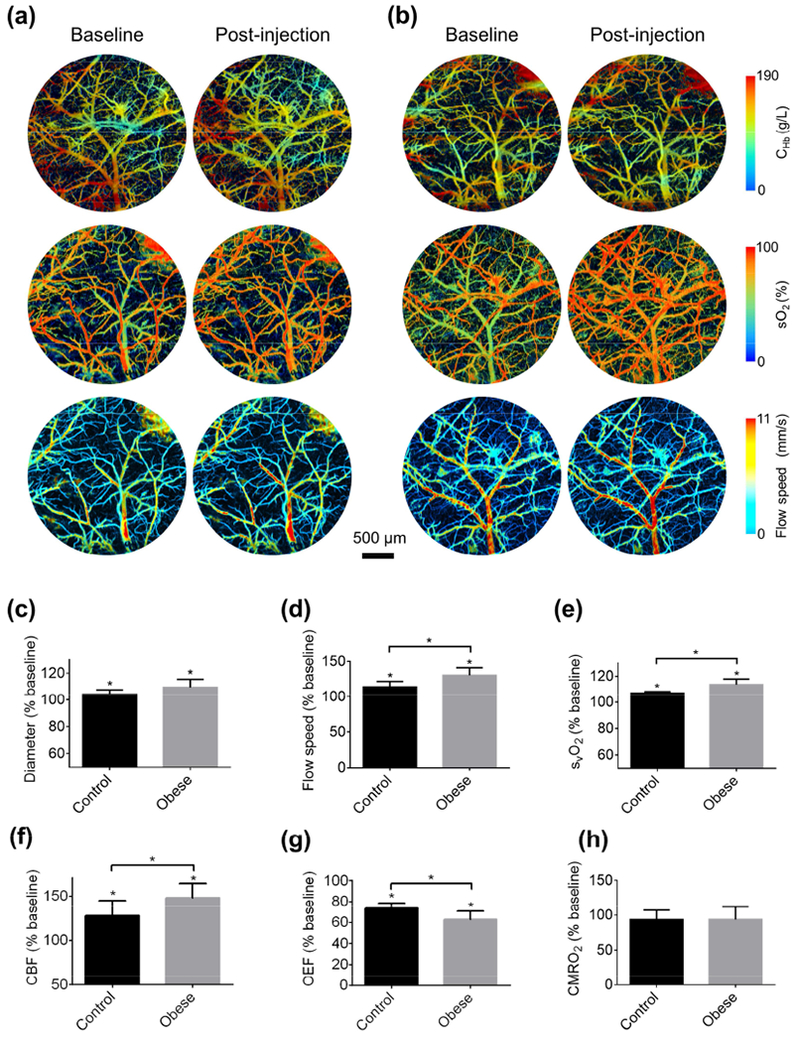
Blood perfusion, oxygenation and flow acquired in the brains of (a) control and (b) obese mice before and after tail-vein injection of acetazolamide. Acetazolamide-induced changes in the (c) vessel diameter, (d) blood flow speed, (e) venous sO2, (f) OEF, (g) CBF, and (h) CMRO2 in the control (n=6) and obese (n=8) mice. All data are presented as mean ± standard deviation. *, p<0.05.
Figure 5. Vessel type-specific changes in cerebrovascular reactivity.
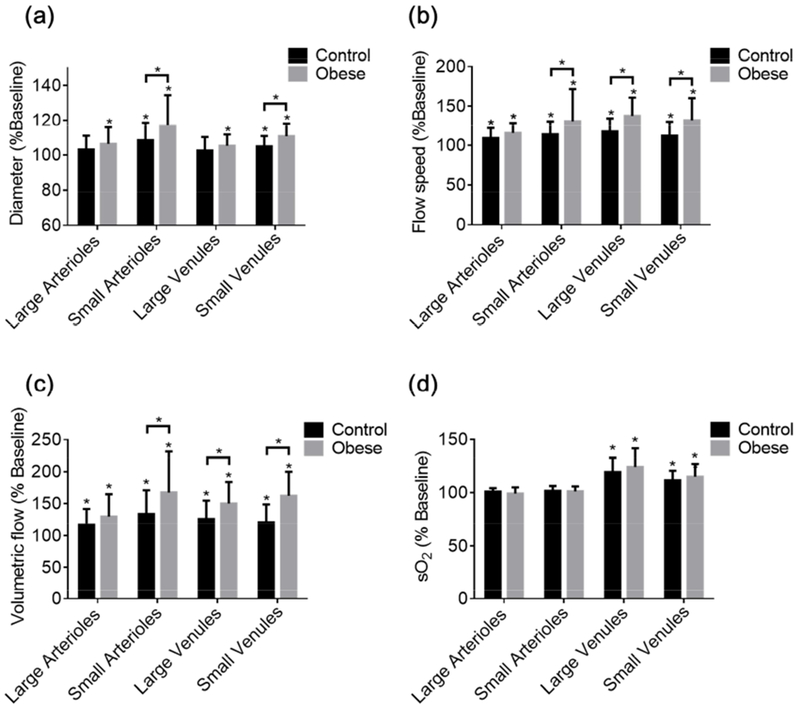
Acetazolamide-induced changes in the (a) diameter, (b) blood flow speed, (c) volumetric flow, and (d) sO2 of different types of vessels in the control and obese mouse brains. Sample size: 13 large arterioles, 45 small arterioles, 31 large venules, and 22 small venules in the control group and 17 large arterioles, 52 small arterioles, 35 large venules, and 28 small venules in the obese group. All data are presented as mean ± standard deviation, *, p<0.05.
Figure 6. Comparison of the eNOS levels in the control and obese mouse brains.
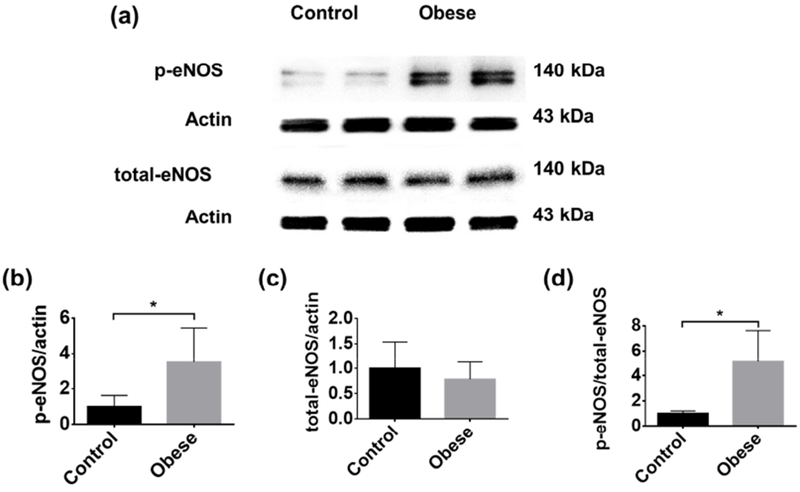
(a) Representative western blot images of phospho-eNOS and total eNOS. Statistical comparison of (b) phospho-eNOS, (c) total eNOS, and (d) the ratio of phospho-eNOS to total eNOS in the control (n=8) and obese (n=8) mouse brains. All data are presented as mean ± standard deviation. *, p<0.05.
Figure 3. Obesity-induced change in cerebrovascular permeability.
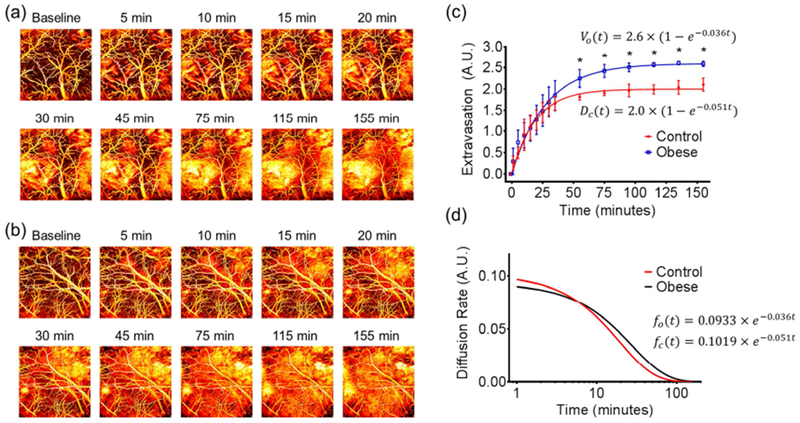
Time-lapse monitoring of Evans blue extravasation in the brains of (a) control and (b) obese mice. (c) Statistical comparison of the dye extravasation dynamics in the control and obese mice (n=5 for each group). (d) Comparison of the dye extravasation rate in the control and obese mice. All data are presented as mean ± standard deviation. *, p<0.05.
Results
High-fat Diet-induced Obesity
Right after randomly assigning the mice into two groups, the mouse body weight was measured to be 32.9±1.1 g for the control group and 33.3±0.9 g for the high-fat diet (i.e., obese) group, showing no difference. After 12 months of feeding, the mice in the obese group became significantly heavier (70.8±7.2 g) than those in the control group (61.1±2.5 g). Although obesity is often accompanied by hyperglycemia, the random blood glucose levels in the control group (152.2±15.1 mg/dl) and the high-fat diet group (147.0±21.9 mg/dl) showed no significant difference in this study. Also, the levels of triglycerides and HDL and the ratios of LDL/HDL and cholesterol/HDL were not different between the two groups. Nevertheless, the cholesterol and LDL levels were significantly higher in the obese group (Fig. S1).
Obesity-induced Alterations in Cerebrovascular Structure and Function
To comprehensively evaluate obesity-induced alterations in cerebrovascular structure and function without the influence of general anesthesia, side-by-side comparisons of the vascular density, tortuosity, sO2, blood flow speed, OEF, resistance and wall shear stress between the control and obese groups were performed in the awake brain. Further, vessel type-specific analysis was carried out for all parameters quantified at the single-vessel level, by dividing these vessels into four categories—small arterioles (<40 μm), small venules (<40 μm), large arterioles (≥40 μm), and large venules (≥40 μm). In this study, we did not include vessels with a diameter less than 10 μm, thereby excluding capillaries. The choice of 40 μm as the threshold to separate “small” vessels from “large” vessels was based on previous studies (Jackson, 2016; Yaseen et al., 2011).
The vascular density was found to be significantly higher (by 7.9%) in the brains of obese mice (Fig. 2a). On average, there was no statistically significant difference in the vascular tortuosity between the control and obese groups (Fig. 2b); however, individual arteries with pronounced tortuosity and relatively high flow speed were observed in the obese mice but not the control mice (yellow arrows in Fig. S2). Although no significant difference was found in the vessel type-specific sO2 between the two groups (Fig. 2c), the average venous sO2 in the obese mice was lower than that in the control mice (by 3.9% and 2.1% in the large and small venules, respectively), resulting in a significantly higher OEF (Fig. S3d). Interestingly, the higher oxygen extraction was accompanied by a lower arterial blood flow speed (Fig. 2d), particularly in small arterioles (4.9±0.6 mm/s for the obese group vs. 5.7±0.6 mm/s for the control group). As a result, the obese mice showed only slightly higher but statistically undifferentiated regional CMRO2 from the control mice (Fig. S3f). In contrast to the obesity-induced impairment in the arterial flow, no significant change was observed in the vascular resistance (Fig. 2e), wall shear stress (Fig. 2f), and CHb (Fig. S4).
Obesity-induced Increase in Cerebrovascular Permeability
As an important barrier between the brain tissue and the cerebral blood circulation, the BBB has limited permeability, protecting the brain against toxic molecules and rapid changes in ionic or metabolic conditions (Saunders et al., 2012). The PAM-based Evan blue extravasation assay was used to study the influence of obesity on the BBB integrity. Capitalizing on the strong optical absorption of Evans blue, its extravasation was dynamically imaged and quantified to assess the BBB permeability.
Time-lapse monitoring of the same ROI in the awake mouse brain for 155 minutes following the dye injection showed visually striking difference between the control (Fig. 3a) and obese mice (Fig. 3b). Further, quantitative analysis by fitting the experimentally measured Evans blue extravasation against the exponential recovery model showed that the amount of dye extravasated out of the cerebral vasculature in the obese mice was significantly higher than that in the control mice starting 55 minutes after dye injection, ultimately leading to a 29.8% higher extravasation at the steady state (Fig. 3 c). Further, by taking the first-order derivative of the exponential-fitted extravasation curve, the rate of extravasation can also be quantified (Fig. 3d). Interestingly, the dye extravasation in the control mice started at a rate comparable to that in the obese mice (0.10 vs. 0.09). However, the extravasation rate in the obese mice surpassed that in the control mice 6 minutes after injection and sustained at a higher level, lasting for 64 minutes before dropping to less than 10% of the initial rate compared to the 45-minute extravasation period of high level in the control mice.
Obesity-induced Increase in Cerebrovascular Reactivity
Indicating the vasodilatory capability and perfusion reserve in the brain, the CVR is a valuable addition to the baseline CBF for evaluating cerebrovascular dysfunction (Markus and Cullinane, 2001; Yezhuvath et al., 2009). The multifaceted CVR to acetazolamide-based vasodilatory stimulation was measured by PAM in the control (Fig. 4a) and obese (Fig. 4b) mouse brains under wakefulness, avoiding the influence of general anesthesia.
After ACZ injection, significant vasodilation was observed in both animal groups (Fig. 4c). Interestingly, the average relative vasodilation in the obese group (9.4%) was more pronounced than that in the control group (4.1%), although the difference was not yet statistically significant (p=0.08). Along with vasodilation, ACZ stimulation resulted in increased blood flow speed (Fig. 4d) and venous sO2 (Fig. 4e) in both groups. Again, the increases in flow speed (30.6%) and venous sO2 (13.6%) in the obese mice were significantly higher than those in the control mice (14.1% for flow speed and 6.9% for venous sO2). As expected, the arterial sO2 was not affected by ACZ in both groups (Fig. S5). The more pronounced vasodilation and flow speed upregulation in the obese mice led to a more significant increase in the regional CBF (47.8%) compared to that in the control mice (27.4%; Fig. 4f), while the more significant increase of venous sO2 in the obese mice resulted in a larger decrease in the regional OEF (26.5% and 37.2% for the control and obese groups, respectively; Fig. 4g). The inverse coupling of CBF and OEF kept the regional CMRO2 unaffected by the vasodilatory challenge in both groups (Fig. 4h), in agreement with previous MRI and PET studies.(Buch et al., 2017; Okazawa et al., 2001) Again, no noticeable change in the CHb was observed in both groups (Fig. S6).
With the aid of vessel segmentation, the multifaceted CVR was further dissected at the single-vessel level to examine whether the obesity-induced reactivity changes were vessel type-specific. Interestingly, although no significant difference was observed in the average vasodilation between the two animal groups (Fig. 4c), the small arterioles and small venules in the obese mice did show much greater vasodilation (Fig. 5a). Similarly, the ACZ-induced increase in the flow speed was mainly attributed to the small arterioles, as well as both types of veins (Fig. 5b). Given that the volumetric flow is co-determined by the diameter and flow speed, not surprisingly, the vessel type-specific response of volumetric flow to ACZ was consistent with those of the two contributing factors (Fig. 5c). In contrast to the unchanged arterial sO2, the sO2 values in both types of veins were elevated after ACZ injection, with a slightly larger increase in the obese mice (Fig. 5d).
Discussion
Comprehensive characterization of disease-induced microvascular changes in the brain remains as an unmet challenge, but is yet necessary for investigating the roles of small-vessel pathology in a wide range of brain disorders. To fill this technology gap, we have developed a new PAM-based imaging and analysis platform. Capitalizing on the optical absorption of blood hemoglobin, our previously reported head-restrained PAM (Cao et al., 2017) is capable of imaging vascular anatomy, blood perfusion, oxygenation and flow in the awake mouse brain in a label-free manner. In this study, we have extended the awake-imaging technique into a hardware-software integrated imaging and analysis platform, thereby enabling comprehensive and quantitative characterization of vessel type-specific pathological alterations in the cerebral microvasculature. Specifically, this work features the following major innovations. Exploiting the optical absorption of Evan blue, an exogenous dye long established for examining vascular permeability, this platform enables dynamic assessment of the BBB integrity. With the aid of vasodilatory stimulation, this technique provides a unique access to the multifaceted CVR. Moreover, the vessel segmentation analysis allows extracting these PAM-measured parameters at the single-microvessel level, from which vascular density, tortuosity, wall shear stress, resistance and associated tissue oxygen extraction fraction and metabolism can be quantified and vessel type-specific alterations can be identified.
We demonstrated the utility of this enabling technique by studying obesity-induced changes in the cerebral microvasculature. Reaching global epidemic proportions in both adults and children over the past few decades, obesity has been broadly associated with cerebrovascular and cardiovascular comorbidities, including but not limited to ischemic stroke, coronary artery disease, and heart failure (Lavie et al., 2009). However, the influence of obesity on the vasculature in these diseases remains incompletely understood (Lavie et al., 2015; Lim, 2015). Particularly, microvascular complications in the brain have long been linked to obesity but are much understudied due to the poor accessibility (Boillot et al., 2013).
Relying on the endogenous contrast from hemoglobin, the PAM-based platform has distinct advantages in cerebrovascular imaging over TPM, which requires angiographic and oxygen-sensitive contrast agents that might perturb the natural physiology and limit the imaging speed due to the long phosphorescence lifetime (Sakadzić et al., 2010). Using this new platform, we were able to comprehensively quantify obesity-induced changes in cerebrovascular structure, mechanical property, hemodynamics, and associated tissue oxygen extraction and metabolism. Specifically, increased vascular density, reduced blood flow in small arterioles, and elevated tissue oxygen extraction were observed in the obese mouse brain. Moreover, individual arteries with pronounced tortuosity were also observed. These in vivo results are in agreement with the previous observations of increased microvascular density and augmented tortuosity of the middle cerebral artery (MCA) in the dissected obese mouse brain (Deng et al., 2014) and the observations of reduced MCA flow speed (Selim et al., 2008) and increased OEF (Uchino et al., 2010) in obese patients. Interestingly, the obese but normoglycemic mice in our study did not show overt changes in average vascular tortuosity, resistance, wall shear stress, and blood oxygenation at the microvascular level, in contrast to the higher resistance (Selim et al., 2008) and lower shear stress (Wiewiora et al., 2013) observed in the individual trunk vessels (e.g., MCA or femoral vein) of obese and hyperglycemic patients.
Also, we extended the classic Evan blue extravasation assay, which is performed in the anesthetized animal and then postmortem, to the awake mouse brain for dynamic evaluation of the cerebrovascular permeability (Acharya et al., 2015). Consistent with previous studies (Deng et al., 2014; Hsu and Kanoski, 2014), the PAM-based platform revealed a ~30% higher dye extravasation at the steady state in the obese mouse brain, indicating compromised BBB integrity. Moreover, dynamic monitoring of dye extravasation enabled by our platform showed that obesity-induced BBB disruption resulted in a prolonged extravasation period rather than an elevated extravasation rate. Enabling dynamic and time-lapse monitoring of molecular diffusion through the BBB, this assay will allow us to trace BBB dysfunction over the progression of cerebrovascular diseases (e.g., CSVD, ischemic/hemorrhagic stroke, traumatic brain injury, and cerebral amyloid angiopathy) (Chodobski et al., 2011; Hartz et al., 2012; Rouhl et al., 2012; Sandoval and Witt, 2008) and may find broad applications in drug delivery and pharmacokinetics in the brain (Saraiva et al., 2016).
Taking advantage of the unique ability of our platform for comprehensive imaging of the cerebral vasculature, we also extended the assessment of CVR from conventional blood flow to multiple parameters—spanning from structure to hemodynamics to the associated oxygen metabolism. Similar to the BBB permeability, the CVR is known to be altered under anesthesia (Schieve and Wilson, 1953; Wang et al., 2017). The ability of our platform for imaging the awake brain ensured unbiased measurements. Unlike the whole-brain CVR measured by MRI (Blair et al., 2016; Ellis et al., 2016), our platform enabled CVR quantification in individual microvessels, from which vessel type-specific reactivity was revealed. Intriguingly, more pronounced multifaceted CVR in response to the ACZ-induced vasodilatory stimulation was observed in obese mice, including stronger vasodilation in small arterioles and veins, greater flow upregulation in small arterioles and all veins, and more significant elevation in venous sO2. The increased oxygen supply through the flow upregulation and decreased tissue oxygen extraction as indicated by the elevated venous sO2 counterbalanced each other and managed to keep the CMRO2 unaffected by the ACZ challenge.
Our observation of increased CVR in the obese mice is somewhat ‘counterintuitive’ and in contrast to the previous observation of impaired vasodilatory ability in obesity (Stapleton et al., 2008). As an inhibitor of carbonic anhydrase, the mechanism for ACZ to cause cerebrovascular relaxation is considered similar to hypercapnia, which induces acidosis in the tissue and ultimately vasodilation. Previous studies have shown that ACZ-induced vasodilation is modulated by nitric oxide (Tuettenberg et al., 2001). Consistent with the molecular mechanism, our biochemical analysis (Fig. 6a) showed that the phospho-eNOS in the obese mice was more than 3-fold higher than that in the control mice (Fig. 6b), while the total eNOS showed no difference between the two groups (Fig. 6c). The significantly elevated eNOS activation (Fig. 6d), which plays an important role in vasodilation and permeability (Fukumura et al., 2001), echoed the increased vasodilation and BBB permeability in the obese mice observed by the PAM platform. Nevertheless, it is not clear whether the increased CVR observed in our study and the impaired vasodilation reported before (Stapleton et al., 2008) represent different stages of obesity-induced cerebrovascular alterations. Also, the obese mice used in our studies did not appear to be hyperglycemic. Thus, it is possible that hyperlipidemia alone may induce cerebrovascular alterations different from those induced by combined hyperlipidemia and hyperglycemia (Stapleton et al., 2008). Further investigation is required to answer these questions.
Due to the limited depth of penetration, transcranial PAM of the human brain is not possible at its current stage. Although PAM is capable of imaging the mouse cerebral microvasculature through the intact skull (Hu et al., 2009), the thinned-skull window is used in this study to minimize degradation of the image quality induced by the optical scattering of mouse skull. Applicable to small animals but not humans, the translational value of the present imaging and analysis platform mainly lies in the understanding of disease mechanisms in animal models. Since PAM shared multiple common measureable parameters with clinically applicable neuroimaging technologies, including diffuse optical tomography, MRI and PET (e.g., sO2, CBF, and CMRO2), preclinical observations by PAM at a much finer spatial scale and in a more quantitative manner may help interpret clinical observations by the human imaging technologies. It is worth noting that the penetration of photoacoustic imaging can be extended by exploiting diffused photons, based on the so-called photoacoustic computed tomography (PACT). Although capable of imaging the entire mouse brain (Li et al., 2017), the acoustically defined resolution of PACT (e.g., tens of microns or worse) prevents it from resolving the cerebral microvasculature. Although having demonstrated awake-brain imaging in rats (Tang et al., 2016a, 2016b, 2015), the relatively large weight of the wearable PACT device (e.g., >8 g) prevents its application in mice. Moreover, PACT has not demonstrated multi-parametric imaging of blood perfusion, oxygenation and flow, as well as oxygen metabolism, in the rodent brain.
A caveat of the present study is that animals of a single sex (i.e., male) were studied. It has been shown that differences in sex may contribute to the mechanisms through which obesity influences the cerebral vasculature (Dorrance et al., 2014). Thus, future studies that incorporate both sexes are warranted to provide a more comprehensive understanding of the disease mechanisms.
In summary, we have developed a hardware-software integrated intravital imaging platform for comprehensive characterization of disease-induced changes in the cerebral microvasculature. Uniquely capable of characterizing alterations in the cerebrovascular structure, function and reactivity, as well as the associated tissue oxygen metabolism, this technique opens a new window to investigating the mechanistic roles of obesity in cerebrovascular diseases.
Supplementary Material
Highlights.
-
►
Quantitative and comprehensive characterization of pathological alterations of the microvasculature in the awake mouse brain.
-
►
Multifaceted cerebrovascular reactivity is defined and quantified.
-
►
Permeability of the blood-brain barrier is dynamically assessed.
-
►
Obesity causes increased vascular density, reduced arterial flow, enhanced oxygen extraction, impaired BBB integrity, and increased CVR.
-
►
This imaging and analysis platform is widely applicable to studies of cerebral small vessel disease.
Acknowledgments
Sources of Funding
This work was supported in part by the National Institutes of Health (NS099261) and the American Heart Association (15SDG25960005) to SH and the National Institutes of Health (NS099118) to ZZ and SH.
Footnotes
Publisher's Disclaimer: This is a PDF file of an unedited manuscript that has been accepted for publication. As a service to our customers we are providing this early version of the manuscript. The manuscript will undergo copyediting, typesetting, and review of the resulting proof before it is published in its final citable form. Please note that during the production process errors may be discovered which could affect the content, and all legal disclaimers that apply to the journal pertain.
Disclosures
None.
References
- Acharya NK, Goldwaser EL, Forsberg MM, Godsey GA, Johnson CA, Sarkar A, DeMarshall C, Kosciuk MC, Dash JM, Hale CP, Leonard DM, Appelt DM, Nagele RG, 2015. Sevoflurane and Isoflurane induce structural changes in brain vascular endothelial cells and increase blood-brain barrier permeability: Possible link to postoperative delirium and cognitive decline. Brain Res. 1620, 29–41. doi: 10.1016/j.brainres.2015.04.054 [DOI] [PubMed] [Google Scholar]
- Banerjee G, Wilson D, Jäger HR, Werring DJ, 2016. Novel imaging techniques in cerebral small vessel diseases and vascular cognitive impairment. Biochim. Biophys. Acta - Mol. Basis Dis. 1862, 926–938. doi: 10.1016/j.bbadis.2015.12.010 [DOI] [PubMed] [Google Scholar]
- Blair GW, Doubal FN, Thrippleton MJ, Marshall I, Wardlaw JM, 2016. Magnetic resonance imaging for assessment of cerebrovascular reactivity in cerebral small vessel disease: A systematic review. J. Cereb. Blood Flow Metab. 36, 833–841. doi: 10.1177/0271678X16631756 [DOI] [PMC free article] [PubMed] [Google Scholar]
- Blair GW, Hernandez MV, Thrippleton MJ, Doubal FN, Wardlaw JM, 2017. Advanced Neuroimaging of Cerebral Small Vessel Disease. Curr. Treat. Options Cardiovasc. Med. 19, 56. doi: 10.1007/s11936-017-0555-1 [DOI] [PMC free article] [PubMed] [Google Scholar]
- Blüher M, 2017. Obesity: The myth of innocent obesity. Nat. Rev. Endocrinol doi: 10.1038/nrendo.2017.146 [DOI] [PubMed] [Google Scholar]
- Boillot A, Zoungas S, Mitchell P, Klein R, Klein B, Ikram MK, Klaver C, Wang JJ, Gopinath B, Tai ES, Neubauer AS, Hercberg S, Brazionis L, Saw S-M, Wong T-Y, Czernichow S, 2013. Obesity and the Microvasculature: A Systematic Review and Meta-Analysis. PLoS One 8, e52708. doi: 10.1371/journal.pone.0052708 [DOI] [PMC free article] [PubMed] [Google Scholar]
- Buch S, Ye Y, Haacke EM, 2017. Quantifying the changes in oxygen extraction fraction and cerebral activity caused by caffeine and acetazolamide. J. Cereb. Blood Flow Metab. 37, 825–836. doi: 10.1177/0271678X16641129 [DOI] [PMC free article] [PubMed] [Google Scholar]
- Cao R, Li J, Ning B, Sun N, Wang T, Zuo Z, Hu S, 2017. Functional and oxygen-metabolic photoacoustic microscopy of the awake mouse brain. Neuroimage 150, 77–87. doi: 10.1016/j.neuroimage.2017.01.049 [DOI] [PMC free article] [PubMed] [Google Scholar]
- Chodobski A, Zink BJ, Szmydynger-Chodobska J, 2011. Blood-Brain Barrier Pathophysiology in Traumatic Brain Injury. Transl. Stroke Res. doi: 10.1007/s12975-011-0125-x [DOI] [PMC free article] [PubMed] [Google Scholar]
- Da Mesquita S, Louveau A, Vaccari A, Smirnov I, Cornelison RC, Kingsmore KM, Contarino C, Onengut-Gumuscu S, Farber E, Raper D, Viar KE, Powell RD, Baker W, Dabhi N, Bai R, Cao R, Hu S, Rich SS, Munson JM, Lopes MB, Overall CC, Acton ST, Kipnis J, 2018. Functional aspects of meningeal lymphatics in ageing and Alzheimer’s disease. Nature 560, 185–191. doi: 10.1038/s41586-018-0368-8 [DOI] [PMC free article] [PubMed] [Google Scholar]
- de Laat KF, Tuladhar AM, van Norden AGW, Norris DG, Zwiers MP, de Leeuw F-E, 2010. Loss of white matter integrity is associated with gait disorders in cerebral small vessel disease. Brain 134, 73–83. doi: 10.1093/brain/awq343 [DOI] [PubMed] [Google Scholar]
- Dearborn JL, Schneider ALC, Sharrett AR, Mosley TH, Bezerra DC, Knopman DS, Selvin E, Jack CR, Coker LH, Alonso A, Wagenknecht LE, Windham BG, Gottesman RF, 2015. Obesity, Insulin Resistance, and Incident Small Vessel Disease on Magnetic Resonance Imaging. Stroke 46, 3131–3136. doi: 10.1161/STROKEAHA.115.010060 [DOI] [PMC free article] [PubMed] [Google Scholar]
- Deng J, Zhang J, Feng C, Xiong L, Zuo Z, 2014. Critical role of matrix metalloprotease-9 in chronic high fat diet-induced cerebral vascular remodeling and increase of ischaemic brain injury in mice. Cardiovasc. Res 103, 473–484. doi: 10.1093/cvr/cvu154 [DOI] [PMC free article] [PubMed] [Google Scholar]
- Deng Z, Wang Z, Yang X, Luo Q, Gong H, 2012. In vivo imaging of hemodynamics and oxygen metabolism in acute focal cerebral ischemic rats with laser speckle imaging and functional photoacoustic microscopy. J. Biomed. Opt 17, 81415–1. doi: 10.1117/1.JBO.17.8.081415 [DOI] [PubMed] [Google Scholar]
- Dorrance AM, Matin N, Pires PW, 2014. The effects of obesity on the cerebral vasculature. Curr. Vasc. Pharmacol 12, 462–72. doi: 10.2174/1570161112666140423222411 [DOI] [PMC free article] [PubMed] [Google Scholar]
- Duyn JH, 2018. Studying brain microstructure with magnetic susceptibility contrast at high-field. Neuroimage 168, 152–161. doi: 10.1016/j.neuroimage.2017.02.046 [DOI] [PMC free article] [PubMed] [Google Scholar]
- Ellis MJ, Ryner LN, Sobczyk O, Fierstra J, Mikulis DJ, Fisher JA, Duffin J, Mutch WAC, 2016. Neuroimaging assessment of cerebrovascular reactivity in concussion: Current concepts, methodological considerations, and review of the literature. Front. Neurol 7. doi: 10.3389/fneur.2016.00061 [DOI] [PMC free article] [PubMed] [Google Scholar]
- Errico C, Pierre J, Pezet S, Desailly Y, Lenkei Z, Couture O, Tanter M, 2015. Ultrafast ultrasound localization microscopy for deep super-resolution vascular imaging. Nature 527, 499–502. doi: 10.1038/nature16066 [DOI] [PubMed] [Google Scholar]
- Fukumura D, Gohongi T, Kadambi A, Izumi Y, Ang J, Yun CO, Buerk DG, Huang PL, Jain RK, 2001. Predominant role of endothelial nitric oxide synthase in vascular endothelial growth factor-induced angiogenesis and vascular permeability. Proc Natl Acad Sci U S A 98, 2604–2609. doi: 10.1073/pnas.041359198 [DOI] [PMC free article] [PubMed] [Google Scholar]
- Goldey GJ, Roumis DK, Glickfeld LL, Kerlin AM, Reid RC, Bonin V, Schafer DP, Andermann ML, 2014. Removable cranial windows for long-term imaging in awake mice. Nat. Protoc 9, 2515–2538. doi: 10.1038/nprot.2014.165 [DOI] [PMC free article] [PubMed] [Google Scholar]
- Gorelick PB, Scuteri A, Black SE, Decarli C, Greenberg SM, Iadecola C, Launer LJ, Laurent S, Lopez OL, Nyenhuis D, Petersen RC, Schneider J. a, Tzourio C, Arnett DK, Bennett D. a, Chui HC, Higashida RT, Lindquist R, Nilsson PM, Roman GC, Sellke FW, Seshadri S, 2011. Vascular contributions to cognitive impairment and dementia: a statement for healthcare professionals from the american heart association/american stroke association. Stroke 42, 2672–713. doi: 10.1161/STR.0b013e3182299496 [DOI] [PMC free article] [PubMed] [Google Scholar]
- Hai P, Yao J, Maslov KI, Zhou Y, Wang LV, 2014. Near-infrared optical-resolution photoacoustic microscopy. Opt. Lett 39, 5192. doi: 10.1364/OL.39.005192 [DOI] [PMC free article] [PubMed] [Google Scholar]
- Hariri A, Bely N, Chen Chen, Nasiriavanaki M, 2016. Towards ultrahigh resting-state functional connectivity in the mouse brain using photoacoustic microscopy. Proc. SPIE - Prog. Biomed. Opt. Imaging 9708. doi: 10.1117/12.2224888 [DOI] [Google Scholar]
- Harteveld AA, Van Der Kolk AG, Zwanenburg JJM, Luijten PR, Hendrikse J, 2016. 7-T MRI in cerebrovascular diseases: Challenges to overcome and initial results. Top. Magn. Reson. Imaging. doi: 10.1097/RMR.0000000000000080 [DOI] [PubMed] [Google Scholar]
- Hartz AMS, Bauer B, Soldner ELB, Wolf A, Boy S, Backhaus R, Mihaljevic I, Bogdahn U, Klunemann HH, Schuierer G, Schlachetzki F, 2012. Amyloid- Contributes to Blood-Brain Barrier Leakage in Transgenic Human Amyloid Precursor Protein Mice and in Humans With Cerebral Amyloid Angiopathy. Stroke 43, 514–523. doi: 10.1161/STROKEAHA.111.627562 [DOI] [PMC free article] [PubMed] [Google Scholar]
- Herrmann LL, Le Masurier M, Ebmeier KP, 2007. White matter hyperintensities in late life depression: a systematic review. J. Neurol. Neurosurg. Psychiatry 79, 619–624. doi: 10.1136/jnnp.2007.124651 [DOI] [PubMed] [Google Scholar]
- Hsu TM, Kanoski SE, 2014. Blood-brain barrier disruption : mechanistic links between Western diet consumption and dementia. Front. Aging Neurosci 6, 1–6. [DOI] [PMC free article] [PubMed] [Google Scholar]
- Hu S, 2016. Listening to the Brain With Photoacoustics. IEEE J. Sel. Top. Quantum Electron. 22, 1–10. doi: 10.1109/JSTQE.2015.2487890 [DOI] [Google Scholar]
- Hu S, Gonzales E, Soetikno B, Gong E, Yan P, Maslov K, Lee J-M, Wang LV, 2011. Optical-resolution photoacoustic microscopy of ischemic stroke. Photons Plus Ultrasound Imaging Sens. 2011. doi: 10.1117/12.874366 [DOI] [Google Scholar]
- Hu S, Maslov K, Tsytsarev V, Wang LV, 2009. Functional transcranial brain imaging by optical-resolution photoacoustic microscopy. J. Biomed. Opt 14, 40503. doi: 10.1117/1.3194136 [DOI] [PMC free article] [PubMed] [Google Scholar]
- Jackson WF, 2016. Arteriolar oxygen reactivity: where is the sensor and what is the mechanism of action? J. Physiol 594, 5055–5077. doi: 10.1113/JP270192 [DOI] [PMC free article] [PubMed] [Google Scholar]
- Kim SH, Després J-P, Koh KK, 2015. Obesity and cardiovascular disease: friend or foe? Eur. Heart J. ehv509. doi: 10.1093/eurheartj/ehv509 [DOI] [PubMed] [Google Scholar]
- Lavie CJ, De Schutter A, Milani RV, 2015. Healthy obese versus unhealthy lean: The obesity paradox. Nat. Rev. Endocrinol doi: 10.1038/nrendo.2014.165 [DOI] [PubMed] [Google Scholar]
- Lavie CJ, McAuley PA, Church TS, Milani RV, Blair SN, 2014. Obesity and cardiovascular diseases: Implications regarding fitness, fatness, and severity in the obesity paradox. J. Am. Coll. Cardiol doi: 10.1016/j.jacc.2014.01.022 [DOI] [PubMed] [Google Scholar]
- Lavie CJ, Milani RV, Ventura HO, 2009. Obesity and Cardiovascular Disease. Risk Factor, Paradox, and Impact of Weight Loss. J. Am. Coll. Cardiol doi: 10.1016/j.jacc.2008.12.068 [DOI] [PubMed] [Google Scholar]
- Li L, Zhu L, Ma C, Lin L, Yao J, Wang L, Maslov K, Zhang R, Chen W, Shi J, Wang LV, 2017. Single-impulse panoramic photoacoustic computed tomography of small-animal whole-body dynamics at high spatiotemporal resolution. Nat. Biomed. Eng 1. doi: 10.1038/s41551-017-0071 [DOI] [PMC free article] [PubMed] [Google Scholar]
- Lim GB, 2015. Risk factors: CVD risk and the “obesity paradox.” Nat. Rev. Cardiol 2015 1210. [DOI] [PubMed] [Google Scholar]
- Lin L, Yao J, Zhang R, Chen CC, Huang CH, Li Y, Wang L, Chapman W, Zou J, Wang LV, 2017. High-speed photoacoustic microscopy of mouse cortical microhemodynamics. J. Biophotonics 10, 792–798. doi: 10.1002/jbio.201600236 [DOI] [PMC free article] [PubMed] [Google Scholar]
- Markus H, Cullinane M, 2001. Severely impaired cerebrovascular reactivity predicts stroke and TIA risk in patients with carotid artery stenosis and occlusion. Brain 124, 457–67. doi: 10.1093/brain/124.3.457 [DOI] [PubMed] [Google Scholar]
- Mokdad AH, Ford ES, Bowman BA, Dietz WH, Vinicor F, Bales VS, Marks JS, 2003. Prevalence of Obesity, Diabetes, and Obesity-Related Health Risk Factors, 2001. JAMA 289. doi: 10.1001/jama.289.1.76 [DOI] [PubMed] [Google Scholar]
- Ning B, Kennedy MJ, Dixon AJ, Sun N, Cao R, Soetikno BT, Chen R, Zhou Q, Kirk Shung K, Hossack JA, Hu S, 2015a. Simultaneous photoacoustic microscopy of microvascular anatomy, oxygen saturation, and blood flow. Opt. Lett 40, 910. doi: 10.1364/OL.40.000910 [DOI] [PubMed] [Google Scholar]
- Ning B, Sun N, Cao R, Chen R, Kirk Shung K, Hossack JA, Lee J-MM, Zhou Q, Hu S, 2015b. Ultrasound-aided Multi-parametric Photoacoustic Microscopy of the Mouse Brain. Sci. Rep 5, 18775. doi: 10.1038/srep18775 [DOI] [PMC free article] [PubMed] [Google Scholar]
- Okazawa H, Yamauchi H, Sugimoto K, Toyoda H, Kishibe Y, Takahashi M, 2001. Effects of acetazolamide on cerebral blood flow, blood volume, and oxygen metabolism: a positron emission tomography study with healthy volunteers. J. Cereb. Blood Flow Metab. 21, 1472–9. doi: 10.1097/00004647-200112000-00012 [DOI] [PubMed] [Google Scholar]
- Oladipupo S, Hu S, Kovalski J, Yao J, Santeford A, Sohn RE, Shohet R, Maslov K, Wang LV, Arbeit JM, 2011. VEGF is essential for hypoxia-inducible factor-mediated neovascularization but dispensable for endothelial sprouting. Proc. Natl. Acad. Sci 108, 13264–13269. [DOI] [PMC free article] [PubMed] [Google Scholar]
- Ortega FB, Lavie CJ, Blair SN, 2016. Obesity and cardiovascular disease. Circ. Res doi: 10.1161/CIRCRESAHA.115.306883 [DOI] [PubMed] [Google Scholar]
- Papaioannou TG, Stefanadis C, 2005. Vascular wall shear stress: basic principles and methods. Hell. J. Cardiol 46, 9–15. doi:15807389 [PubMed] [Google Scholar]
- Peterson EC, Wang Z, Britz G, 2011. Regulation of cerebral blood flow. Int. J. Vasc. Med 2011, 823525. doi: 10.1155/2011/823525 [DOI] [PMC free article] [PubMed] [Google Scholar]
- Rouhl RPW, Damoiseaux JGMC, Lodder J, Theunissen ROMFIH, Knottnerus ILH, Staals J, Henskens LHG, Kroon AA, de Leeuw PW, Tervaert JWC, van Oostenbrugge RJ, 2012. Vascular inflammation in cerebral small vessel disease. Neurobiol. Aging 33, 1800–1806. doi: 10.1016/J.NEUROBIOLAGING.2011.04.008 [DOI] [PubMed] [Google Scholar]
- Sakadzić S, Roussakis E, Yaseen MA, Mandeville ET, Srinivasan VJ, Arai K, Ruvinskaya S, Devor A, Lo EH, Vinogradov SA, Boas DA, 2010. Two-photon high-resolution measurement of partial pressure of oxygen in cerebral vasculature and tissue. Nat. Methods 7, 755–759. doi: 10.1038/nmeth.1490 [DOI] [PMC free article] [PubMed] [Google Scholar]
- Sandoval KE, Witt KA, 2008. Blood-brain barrier tight junction permeability and ischemic stroke. Neurobiol. Dis doi: 10.1016/j.nbd.2008.08.005 [DOI] [PubMed] [Google Scholar]
- Saraiva C, Praça C, Ferreira R, Santos T, Ferreira L, Bernardino L, 2016. Nanoparticle-mediated brain drug delivery : Overcoming blood – brain barrier to treat neurodegenerative diseases. J. Control. Release 235, 34–47. doi: 10.1016/j.jconrel.2016.05.044 [DOI] [PubMed] [Google Scholar]
- Saunders NR, Liddelow SA, Dziegielewska KM, 2012. Barrier mechanisms in the developing brain. Front. Pharmacol 3 MAR, 1–18. doi: 10.3389/fphar.2012.00046 [DOI] [PMC free article] [PubMed] [Google Scholar]
- Schieve JF, Wilson WP, 1953. The influence of age, anesthesia and cerebral arteriosclerosis on cerebral vascular activity to CO2. Am. J. Med 15, 171–174. doi: 10.1016/0002-9343(53)90067-9 [DOI] [PubMed] [Google Scholar]
- Selim M, Jones R, Novak P, Zhao P, Novak V, 2008. The effects of body mass index on cerebral blood flow velocity. Clin. Auton. Res 18, 331–338. doi: 10.1007/s10286-008-0490-z [DOI] [PMC free article] [PubMed] [Google Scholar]
- Sezgin Mehmet and Sankur B. lent, 2004. Survey over image thresholding techniques and quantitative performance evaluation. J. Electron. Imaging 13, 146–165. doi: 10.1117/1.1631316 [DOI] [Google Scholar]
- Shih AY, Driscoll JD, Drew PJ, Nishimura N, Schaffer CB, Kleinfeld D, 2012. Two-photon microscopy as a tool to study blood flow and neurovascular coupling in the rodent brain. J. Cereb. blood flow Metab. 32, 1–33. doi: 10.1038/jcbfm.2011.196 [DOI] [PMC free article] [PubMed] [Google Scholar]
- Shih AY, Friedman B, Drew PJ, Tsai PS, Lyden PD, Kleinfeld D, 2009. Active dilation of penetrating arterioles restores red blood cell flux to penumbral neocortex after focal stroke. J. Cereb. Blood Flow Metab. 29, 738–751. doi: 10.1038/jcbfm.2008.166 [DOI] [PMC free article] [PubMed] [Google Scholar]
- Soetikno B, Hu S, Gonzales E, Zhong Q, Maslov K, Lee J-M, Wang LV, 2012. Vessel segmentation analysis of ischemic stroke images acquired with photoacoustic microscopy. SPIE BiOS 8223, 822345. doi: 10.1117/12.911089 [DOI] [Google Scholar]
- Stapleton PA, James ME, Goodwill AG, Frisbee JC, 2008. Obesity and vascular dysfunction. Pathophysiol. Off. J. Int. Soc. Pathophysiol 15, 79–89. doi: 10.1016/j.pathophys.2008.04.007 [DOI] [PMC free article] [PubMed] [Google Scholar]
- Starosolski Z, Villamizar CA, Rendon D, Paldino MJ, Milewicz DM, Ghaghada KB, Annapragada AV, 2015. Ultra High-Resolution In vivo Computed Tomography Imaging of Mouse Cerebrovasculature Using a Long Circulating Blood Pool Contrast Agent. Sci. Rep 5, 10178. doi: 10.1038/srep10178 [DOI] [PMC free article] [PubMed] [Google Scholar]
- Strazzullo P, D’Elia L, Cairella G, Garbagnati F, Cappuccio FP, Scalfi L, 2010. Excess body weight and incidence of stroke: Meta-analysis of prospective studies with 2 million participants. Stroke. doi: 10.1161/STROKEAHA.109.576967 [DOI] [PubMed] [Google Scholar]
- Sudlow CLM, Warlow CP, 1997. Comparable studies of the incidence of stroke and its pathological types: Results from an international collaboration. Stroke 28, 491–499. doi: 10.1161/01.STR.28.3.491 [DOI] [PubMed] [Google Scholar]
- Tang J, Coleman JE, Dai X, Jiang H, 2016a. Wearable 3-D Photoacoustic Tomography for Functional Brain Imaging in Behaving Rats. Sci. Rep 6, 25470. doi: 10.1038/srep25470 [DOI] [PMC free article] [PubMed] [Google Scholar]
- Tang J, Dai X, Jiang H, 2016b. Wearable scanning photoacoustic brain imaging in behaving rats. J. Biophotonics 9, 570–575. doi: 10.1002/jbio.201500311 [DOI] [PubMed] [Google Scholar]
- Tang J, Xi L, Zhou J, Huang H, Zhang T, Carney PR, Jiang H, 2015. Noninvasive high-speed photoacoustic tomography of cerebral hemodynamics in awake-moving rats. J. Cereb. Blood Flow Metab. 35, 1224–1232. doi: 10.1038/jcbfm.2015.138 [DOI] [PMC free article] [PubMed] [Google Scholar]
- Tuettenberg J, Heimann A, Kempski O, 2001. Nitric oxide modulates cerebral blood flow stimulation by acetazolamide in the rat cortex: a laser Doppler scanning study. Neurosci. Lett 315, 65–68. doi: 10.1016/S0304-3940(01)02325-4 [DOI] [PubMed] [Google Scholar]
- Uchino K, Lin R, Zaidi SF, Kuwabara H, Sashin D, Bircher N, Chang Y-F, Hammer MD, Reddy V, Jovin TG, Vora N, Jumaa M, Massaro L, Billigen J, Boada F, Yonas H, Nemoto EM, 2010. Increased cerebral oxygen metabolism and ischemic stress in subjects with metabolic syndrome-associated risk factors: preliminary observations. Transl. Stroke Res. 1, 178–83. doi: 10.1007/s12975-010-0028-2 [DOI] [PMC free article] [PubMed] [Google Scholar]
- Van Der Flier WM, Van Straaten ECW, Barkhof F, Verdelho A, Madureira S, Pantoni L, Inzitari D, Erkinjuntti T, Crisby M, Waldemar G, Schmidt R, Fazekas F, Scheltens P, 2005. Small vessel disease and general cognitive function in nondisabled elderly: The LADIS study. Stroke 36, 2116–2120. doi: 10.1161/01.STR.0000179092.59909.42 [DOI] [PubMed] [Google Scholar]
- Wang C, Ni C, Li G, Li Y, Tao L, Li N, Wang J, Guo X, 2017. Effects of sevoflurane versus propofol on cerebrovascular reactivity to carbon dioxide during laparoscopic surgery. Ther. Clin. Risk Manag. 13, 1349–1355. doi: 10.2147/TCRM.S146272 [DOI] [PMC free article] [PubMed] [Google Scholar]
- Wang LV, Hu S, 2012. Photoacoustic tomography: In vivo imaging from organelles to organs. Science (80-. ). doi: 10.1126/science.1216210 [DOI] [PMC free article] [PubMed] [Google Scholar]
- Wardlaw JM, Dennis MS, Warlow CP, Sandercock PA, 2001. Imaging appearance of the symptomatic perforating artery in patients with lacunar infarction: Occlusion or other vascular pathology? Ann. Neurol 50, 208–215. doi: 10.1002/ana.1082 [DOI] [PubMed] [Google Scholar]
- Wardlaw JM, Smith C, Dichgans M, 2013. Mechanisms of sporadic cerebral small vessel disease: Insights from neuroimaging. Lancet Neurol. doi: 10.1016/S1474-4422(13)70060-7 [DOI] [PMC free article] [PubMed] [Google Scholar]
- Wiewiora M, Piecuch J, Glűck M, Slowinska-Lozynska L, Sosada K, 2013. Shear stress and flow dynamics of the femoral vein among obese patients who qualify for bariatric surgery. Clin. Hemorheol. Microcirc 54, 313–23. doi: 10.3233/CH-131736 [DOI] [PubMed] [Google Scholar]
- Willie CK, Colino FL, Bailey DM, Tzeng YC, Binsted G, Jones LW, Haykowsky MJ, Bellapart J, Ogoh S, Smith KJ, Smirl JD, Day TA, Lucas SJ, Eller LK, Ainslie PN, 2011. Utility of transcranial Doppler ultrasound for the integrative assessment of cerebrovascular function. J. Neurosci. Methods 196, 221–237. doi: 10.1016/j.jneumeth.2011.01.011 [DOI] [PubMed] [Google Scholar]
- Windberger U, Bartholovitsch A, Plasenzetti R, Korak KJ, Heinze G, 2003. Whole blood viscosity, plasma viscosity and erythrocyte aggregation in nine mammalian species: Reference values and comparison of data. Exp. Physiol doi: 10.1113/eph8802496 [DOI] [PubMed] [Google Scholar]
- Yang G, Pan F, Parkhurst CN, Grutzendler J, Gan W-BB, 2010. Thinned-skull cranial window technique for long-term imaging of the cortex in live mice. Nat. Protoc 5, 201–208. doi: 10.1038/nprot.2009.222 [DOI] [PMC free article] [PubMed] [Google Scholar]
- Yao J, Maslov K, Hu S, Wang LV, 2009. Evans blue dye-enhanced capillary-resolution photoacoustic microscopy in vivo. J. Biomed. Opt 14, 54049. doi: 10.1117/1.3251044 [DOI] [PMC free article] [PubMed] [Google Scholar]
- Yao J, Wang LV, 2014. Photoacoustic brain imaging: from microscopic to macroscopic scales. Neurophotonics 1, 11003. doi: 10.1117/1.NPh.1.1.011003 [DOI] [PMC free article] [PubMed] [Google Scholar]
- Yao J, Wang LVLLV, Yang J-MM, Maslov KI, Wong TTWW, Li L, Huang C-HH, Zou J, Wang LVLLV, 2015. High-speed label-free functional photoacoustic microscopy of mouse brain in action. Nat. Methods 12, 407–410. doi: 10.1038/nmeth.3336 [DOI] [PMC free article] [PubMed] [Google Scholar]
- Yaseen MA, Srinivasan VJ, Sakadžić S, Radhakrishnan H, Gorczynska I, Wu W, Fujimoto JG, Boas DA, 2011. Microvascular oxygen tension and flow measurements in rodent cerebral cortex during baseline conditions and functional activation. J. Cereb. Blood Flow Metab. 31, 1051–1063. doi: 10.1038/jcbfm.2010.227 [DOI] [PMC free article] [PubMed] [Google Scholar]
- Yezhuvath US, Lewis-Amezcua K, Varghese R, Xiao G, Lu H, 2009. On the assessment of cerebrovascular reactivity using hypercapnia BOLD MRI. NMR Biomed. 22, 779–786. doi: 10.1002/nbm.1392 [DOI] [PMC free article] [PubMed] [Google Scholar]
- Zhang HF, Maslov K, Sivaramakrishnan M, Stoica G, Wang LV, 2007. Imaging of hemoglobin oxygen saturation variations in single vessels in vivo using photoacoustic microscopy. Appl. Phys. Lett 90, 53901. doi: 10.1063/1.2435697 [DOI] [Google Scholar]
- Zhou Y, Yao J, Maslov KI, Wang LV, 2014. Calibration-free absolute quantification of particle concentration by statistical analyses of photoacoustic signals in vivo. J. Biomed. Opt 19, 37001. doi: 10.1117/1.JBO.19.3.037001 [DOI] [PMC free article] [PubMed] [Google Scholar]
Associated Data
This section collects any data citations, data availability statements, or supplementary materials included in this article.