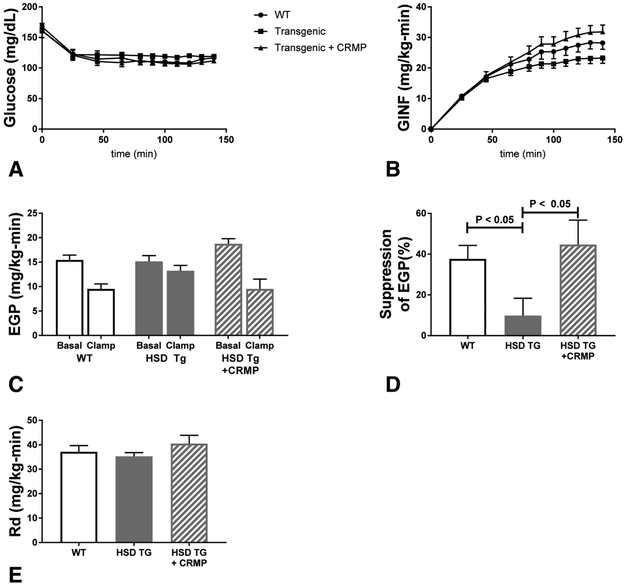
Figure 1. Hyperinsulinemic-euglycemic clamps.
Two week high fat diet fed Wild Type Fvb mice, HSD Tg mice, and HSD Tg mice treated with CRMP were studied by hyperinsulinemic euglycemic clamps. A. Plasma glucose during the clamp. B. Glucose infusion rate (GINF) during the clamp. C. Endogenous glucose production (EGP) in both the basal and hyperinsulinemic clamped state for each group. D. Insulin mediated suppression of EGP, represented as percent suppression. E. Insulin stimulated whole body glucose disposal (Rd). Insulin levels during the clamp were 83 ± 12 (WT), 67 ± 13 (HSD Tg), and 68 ± 8 (HSD Tg + CRMP)- insulin level differences were nonsignificant whether compared by ANOVA or students t-test. Data are the mean ± SEM of n = 11 (WT), n = 8 (HSD Tg), and n = 10 (HSD Tg + CRMP).

