

Abstract
Astrocytes are the main homeostatic cell of the central nervous system. In addition, astrocytes mediate an inflammatory response when reactive to injury or disease known as astrogliosis. Astrogliosis is marked by an increased expression of glial fibrillary acidic protein (GFAP) and cellular hypertrophy. Some degree of astrogliosis is associated with normal aging and degenerative conditions such as Alzheimer’s disease (AD) and other dementing illnesses in humans. The recent observation of pathological markers of AD (amyloid plaques and neurofibrillary tangles) in aged chimpanzee brains provided an opportunity to examine the relationships among aging, AD-type pathology, and astrocyte activation in our closest living relatives. Stereologic methods were used to quantify GFAP-immunoreactive astrocyte density and soma volume in layers I, III, and V of the prefrontal and mid temporal cortex, as well as in hippocampal fields CA1 and CA3. We found that the patterns of astrocyte activation in the aged chimpanzee brain are distinct from humans. GFAP expression does not increase with age in chimpanzees, possibly indicative of lower oxidative stress loads. Similar to humans, chimpanzee layer I astrocytes in the prefrontal cortex are susceptible to AD-like changes. Both prefrontal cortex layer I and hippocampal astrocytes exhibit a high degree of astrogliosis that is positively correlated with accumulation of amyloid-beta and tau proteins. However, unlike humans, chimpanzees do not display astrogliosis in other cortical layers. These results demonstrate a unique pattern of cortical aging in chimpanzees and suggest that inflammatory processes may differ between humans and chimpanzees in response to pathology.
Keywords: Alzheimer’s disease, astrocytes, aging, chimpanzees, cerebral cortex, hippocampus, prefrontal cortex, stereology, RRID: AB_2109645, RRID: AB_2313952, RRID: AB_223647, RRID: AB_2314223
Graphical Abstract
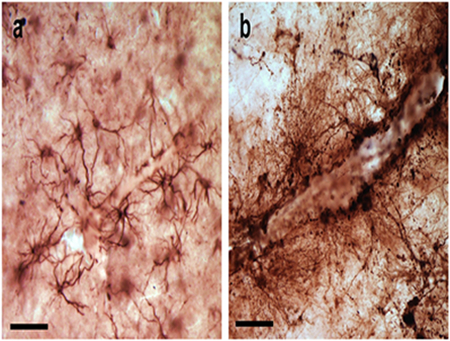
Unlike humans, chimpanzee cortex does not exhibit age-related astrogliosis. Similar to humans, astrogliosis in chimpanzees does increase with Alzheimer’s-like pathology. Photomicrographs show the absence of astrogliosis in chimpanzee cortex that lacks pathology (a) and prevalence associated with pathology (b). Scale bars = 25 μm.
1. INTRODUCTION
Astrocytes play an important role in the maintenance of a homeostatic environment in the central nervous system (CNS). These homeostatic functions include maintaining ion and water balance, preserving the integrity of the blood-brain barrier, metabolic regulation, neurotransmitter regulation, and synaptic modulation (Avila-Muñoz & Arias, 2014; Cotrina & Nedergaard, 2005; Magistretti & Pellerin, 1999; Magistretti, Pellerin, Rothman, & Shulman, 1991; Magistretti, 2006; Magistretti and Allaman, 2015; Oberheim et al., 2009; Parpura & Zorec, 2010; Pellerin et al., 1998; Sibille, Pannasch, & Rouach, 2014; Wallraff et al., 2006; Verkhratsky & Nedergaard, 2017). Astrocytes have also been shown to influence learning and memory due to their ability to modulate energy metabolism, synaptic transmission, shuttling lactate, and enhancing long-term potentiation, (Fellin, Pascual, & Haydon, 2006; Han et al., 2013; Henneberger, Papouin, Oliet, & Rusakov, 2010; Panatier et al., 2006; Perea & Araque, 2005; Pellerin et al., 1998; Suzuki et al., 2011). In addition to their roles in the healthy CNS, astrocytes actively participate in the inflammatory responses associated with pathological conditions, such as amyotrophic lateral sclerosis, Down syndrome, Parkinson’s disease, Alzheimer’s disease (AD), traumatic brain injury, and epilepsy (Heneka, Rodríguez, & Verkhratsky, 2010; Markiewicz & Lukomska, 2006; Sofroniew, 2009; Sofroniew & Vinters, 2010). The response by astrocytes to pathology is referred to as astrogliosis, or astrocyte activation (Heneka et al., 2010). Astrogliosis is defined as a spectrum of molecular, cellular, and functional changes in astrocytes marked by upregulation of glial fibrillary acidic protein (GFAP), hypertrophy of the soma and cellular processes, and loss of domain organization (Pekny & Pekna, 2004; Sofroniew & Vinters, 2010; Wilhelmsson et al., 2006). Therefore, the response of astrocytes varies and can be represented as continuum of changes that corresponds to the severity and progression of the underlying condition (Sofroniew & Vinters, 2010).
Some degree of astrogliosis, as indicated by the upregulation of GFAP mRNA and protein expression, has also been associated with normal aging in humans and rodents (Beach, Walker, & McGear, 1989; Contrina & Nedergaard, 2002; Finch et al., 2002; Goss, Finch, & Morgan, 1991; Markiewicz & Lukomska, 2006; Morgan et al., 1997; Nicholas, Day, Laping, Johnson, & Finch, 1993). Two studies reported that the overall number of astrocytes does not change with age, but their analysis did not include GFAP-expressing astrocytes specifically (Pakkenberg, 2003; Pelvig, Pakkenberg, Stark, & Pakkenberg, 2008). It appears, however, that although there is no change in absolute numbers with age, there is a phenotypic shift that includes the up-regulation of GFAP and morphological changes such as an increase in dendritic length and altered soma size (Serrano-Pozo, Gómez-Isla, Growdon, Frosch, & Hyman, 2013; Sofroniew & Vinters, 2010).
The involvement of glial cells, including astrocytes, in AD was in fact first reported by Alzheimer who noted glial cells surrounding neuritic plaques and in association with damaged neurons (Alzheimer, 1911). A more recent model describing the phenotypic response of astrocytes to AD indicates that both degeneration and astrogliosis cooccur (Verkhratsky, Olabarría, Noristani, Yeh, & Rodíguez, 2010). It is possible that the initial deficits observed in AD, such as impaired synaptic function and loss of synapses, are the result of a generalized atrophy of astrocytes that leads to their inability to modulate synaptic transmission (Kettenmann & Verkhratsky, 2008; Verkhratsky et al., 2010; Verkhratsky & Parpura et al., 2016). Therefore, astrocytic atrophy and consequent deficit in homeostatic regulation could contribute to the early cognitive changes observed in AD. The initial astrocyte atrophy is then followed by marked activation of an additional adjacent populations of astrocytes. This cascade of astrocyte activation is triggered by the accumulation of amyloid beta protein (Aβ) plaques and hyperphosphorylated tau neurofibrillary tangles (NFT; Armstrong, 2009; Montine et al., 2010; Olabarría, Noristani, Verkhratsky, & Rodríguez, 2010; Rodríguez & Verkhratsky, 2011; Verkhratsky et al., 2010). Astrogliosis is observed in regions surrounding amyloid deposition and the dendritic processes of activated astrocytes participate in the formation of neuritic plaques (Beach & McGeer, 1988; Beach et al., 1989; Duffy, Rapport, & Graf, 1980; Mancardi, Liwinicz, & Mandybur, 1983; Mandybur, 1989; Nagele, Wegiel, Venkataraman, Imaki, & Wang, 2004; Rodríguez, Olabarria, Chvatal, & Verkhratsky, 2009; Schechter, Yen, & Terry, 1981). Reactive astrocytes are also found in proximity to NFT (Serrano-Pozo et al., 2011).
Astrocyte morphology and function appears to have evolved in humans and in tandem with other cortical microstructural features may work to render humans more susceptible to neuropathologies such as AD (Colombo, Yáñez, Puissant, & Lipina, 1995; Colombo, Quinn, & Puissant, 2002; Falcone et al., 2018; Magistretti, 2006; Oberheim et al., 2006; Oberheim et al., 2009; Oberheim, Wang, Goldman, & Nedergaard, 2006). Studies in aged great apes have reported the presence of senile plaques and tau pathology (Edler et al., 2017; Gearing, Rebeck, Hyman, Tigges, & Mirra, 1994; Gearing, Tigges, Mori, & Mirra, 1996; Gearing, Tigges, Mori, Mirra, 1997; Kimura et al., 2001; Perez et al., 2013; Rosen et al., 2011; Selkoe, Bell, Podlisny, Price, & Cork 1987). Therefore, to gain a better understanding of the role that astrocytes play in aging as well as in the pathogenesis of AD and other degenerative brain disorders, we examined the response of astrocytes in the cerebral cortex of aged chimpanzees.
2. MATERIALS AND METHODS
2.1. Specimens and cortical regions
The study sample included the brains of 27 chimpanzees (Pan troglodytes; 16 females and 11 males) ranging from 12 to 62 years of age (Table 1). A subset of these brains (chimpanzees aged 37 to 62 years) was included in a previously published study that examined AD-type pathology in chimpanzees (Edler et al., 2017). All postmortem brains samples were obtained from AAALAC or AZA-accredited zoological or biomedical research facilities. All brain specimens were provided by the National Chimpanzee Brain Resource (C.C.S and W.D.H.).
TABLE 1.
Specimens used in the present study. Sex and age (years) for all chimpanzees included in the study. Any regions omitted from statistical analyses are listed in the last column.
| Sex | Age | Omitted Regions/Parameters |
|---|---|---|
| F | 12 | |
| F | 16 | HC Density, HC Volume |
| M | 17 | |
| M | 19 | |
| M | 20.5 | |
| F | 20.9 | |
| M | 24 | |
| F | 29 | MTG Density |
| F | 35.4 | HC Density, HC Volume |
| F | 37 | |
| F | 39 | |
| M | 39 | CA3 Volume |
| F | 40 | |
| M | 40 | |
| F | 40 | |
| M | 40.5 | |
| M | 40.7 | |
| F | 41 | CA3 Volume |
| F | 43 | |
| F | 45 | CA1 Volume, CA3 Volume |
| M | 46.3 | |
| F | 49 | |
| F | 51 | CA3 Volume |
| M | 57 | CA1 Volume, CA3 Volume |
| F | 58 | CA1 Volume |
| F | 58 | |
| M | 62 | |
The brain regions analyzed included the hippocampus (HC), mid temporal gyrus (MTG; Brodmann’s area 21), and prefrontal cortex (PFC; Brodmann’s areas 9 or 10). These regions were chosen based on guidelines set forth for the neuropathologic assessment of AD, staging for NFT, and Aβ accumulation (Braak & Braak, 1991; Montine et al., 2012; Thal, Rub, Orantes, & Braak, 2002). The pyramidal layer of HC fields CA1 and CA3 and layers I, III, and V of PFC and MTG were included in the analyses. Layer I interlaminar astrocytes have been shown to be uniquely susceptible to disruption in AD and layers III and V were chosen as they contain higher densities of amyloid plaques and NFT than other layers in AD (Arnold, Hyman, Flory, Damasio, & Van Hosen, 1991; Colombo et al., 2002; Davies, Mann, Sumpter, & Yates, 1987; Lewis, Campbell, Terry, & Morrison, 1987; Pearson, Esiri, Hiorns, Wilcock, & Powell, 1985). Furthermore, a previous study examined astrogliosis patterns in human AD tissue, confirming that activated astrocytes are present in layers II, III, and V (Beach et al., 1989). Right or left hemispheres were used based on specimen availability. Aβ and NFT have been shown to be deposited symmetrically in humans, suggesting that examining AD pathology and astrogliosis in one hemisphere should not skew results (Giannakopoulos, Kövari, Herrmann, Hof, & Bouras, 2009).
2.2. Tissue processing
Chimpanzee brains were collected with a postmortem interval of less than 20 hours following natural death or health-related euthanasia. Brains were immersion-fixed in 10% buffered formalin solution for 7 to 10 days and then transferred to a 0.1 M phosphate buffered saline solution (PBS) containing 0.1% sodium azide for storage at 4° C.
Prior to sectioning, samples were cryoprotected in a graded series of sucrose solutions (10, 20, and 30%). Brains were sectioned using a freezing-sliding microtome (SM200R, Leica, Chicago, IL). Sections were individually placed in sequentially numbered centrifuge tubes containing freezer storage solution (30% each distilled water, ethylene glycol, and glycerol and 10% 0.244 M PBS) and stored at −20° C until further histological or immunohistochemical processing. Every 10th section was stained for Nissl substance using a 0.5% cresyl violet solution to visualize the cytoarchitecture. Nissl-stained sections were used to delineate HC subfields, neocortical regions, and layers (Figs. 1, 2).
FIGURE 1.
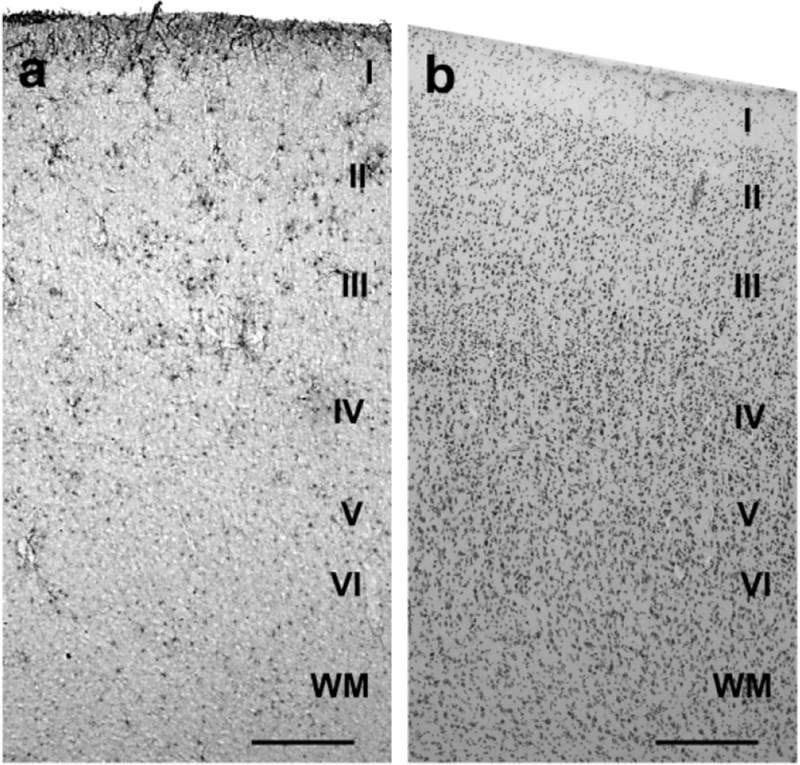
GFAP-immunostained section (a) and Nissl-stained section (b) with cortical layers labeled in the PFC of a 62 year-old chimpanzee. Nissl-stained sections were used to locate the appropriate cortical layers for quantification of the immunohistochemically processed sections. Scale bars = 250 μm.
FIGURE 2.
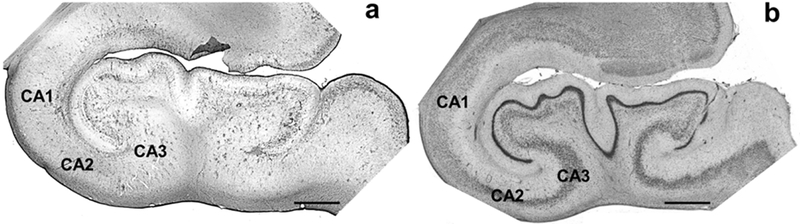
GFAP-immunostained section (a) and Nissl-stained section (b) in a 62 year-old chimpanzee HC. All hippocampal subfields are labeled but only CA1 and CA3 were quantified for GFAP immunoreactivity density and soma volume. Nissl-stained sections were used to locate the appropriate subfield for quantification. Scale bars = 250 μm.
2.3. Antibody characterization
Table 2 describes the antibodies used in the present study. GFAP is a rabbit polyclonal antibody raised against glial fibrillary acidic protein (1:12,500 dilution, Millipore, Burlington, MA, Cat# AB5804, RRID: AB_2109645). 6E10 is a mouse monoclonal IgG1 antibody raised against amino acid residue 1–16 (DAEFRHDSGYEVHHQK) of Aβ (1:7,500 dilution, Covance Research Products, San Diego, CA, Cat# SIG-39320, RRID: AB_2313952). This antibody also has an epitope of residues 3–8 which recognizes Aβ isoforms and its precursor APP (Kim et al., 1988). AT8 is a mouse monoclonal IgG1 antibody raised against partially purified human paired helical filament (PHF) tau with an epitope at residues phosphoserine202/phosphothreonine205 which recognizes phosphorylated tau isoforms (1:2,500 dilution, Thermo Fisher Scientific, Waltham, MN, Cat# MN1020, RRID: AB_223647; Goedert et al., 1995a; Rosen et al., 2008). CP13 is a mouse monoclonal IgG1 antibody with an epitope at residue phosphoserine202 which recognizes phosphorylated tau (1:10,000 dilution, gift from Dr. P. Davies, RRID: AB_2314223; Jicha, Bowser, Kazam, & Davies, 1997). Specificity of antibodies AT8 and CP13 were determined by Western blot (Goedert et al., 1995a; Jicha et al., 1997). Antibody 6E10 specificity was verified by Kim et al. (1988). The GFAP antibody used in immunohistochemistry protocols positively stained astrocytes congruent with previously published research (Beach et al., 1989; Hansen, Armstrong, & Terry, 1987; Rodríguez et al., 2014; Sofroniew & Vinters, 2010).
TABLE 2.
Primary antibodies used in this study.
| Antigen | Antibody | Host/Type | Dilution | Suppler/Catalog Number | RRID |
|---|---|---|---|---|---|
| GFAP | Glial fibrillary acidic protein | Rabbit, polyclonal | 1:12,500 | Millipore, AB5804 | AB_2109645 |
| APP/Aβ (6E10) | Aβ/APP residues 1-16 (DAEFRHDSGYEVHHQK) | Mouse, monoclonal | 1:7,500 | Covance, SIG-39320 | AB_2313952 |
| Tau (AT8) | Paired helical filaments – tau phosphoSer202 and phosphoThr205 | Mouse, monoclonal | 1:2,500 | ThermoFisher, MN1020 | AB_223647 |
| Tau (CP13) | Phosphorylated tau – phosphoSer202 | Mouse, monoclonal | 1:10,00 | Gift from Dr. Peter Davies | AB_2314223 |
2.4. Immunohistochemistry
A series of brain sections from each region were immunostained using the avidin-biotin-peroxidase method for either amyloid (6E10) or tau (AT8/CP13) as well as GFAP to visualize both AD pathology and astrocytes within the tissue. Tissue sections were first pretreated for antigen retrieval for 30 minutes in a 0.05% solution of citraconic acid (pH 7.4) at 85° C. Endogenous peroxidase was quenched for 20 minutes using a solution of 75% methanol, 2.5% hydrogen peroxide (30%), and 22.5% distilled water. Sections were then pre-blocked in a solution containing 90.4% 0.1 M PBS (pH 7.4), 0.6% Triton X-100, 4% normal serum, and 5% bovine serum albumin. Tissue was incubated for 48 hours in a primary antibody. One of three primary antibodies were used 6E10 at a dilution of 1:7,500 (mouse monoclonal antibody, Covance, Cat# SIG-39320, RRID: AB_2313952), AT8 at a dilution of 1:2,500 (mouse monoclonal antibody, Thermo Fischer Scientific, Cat# MN1020, RRID: AB_223647) or CP13 at a dilution of 1:10,000 in PBS (mouse monoclonal antibody, gift from Dr. P. Davies, RRID: AB_2314223). After incubation, sections were placed in a solution of biotinylated secondary antibody (1:200) and 2% normal serum. Sections were then placed in avidin-peroxidase complex (PK-6100, Vector Laboratories, Burlingame, CA, USA) followed by 3, 3’-diaminobenzidine-peroxidase substrate with nickel enhancement (SK-4100, Vector Laboratories). Next, tissue sections were incubated in a blocking solution containing 5% normal serum and 90.5% 0.1 M PBS. The tissue was then incubated for 48 hours in anti-GFAP antibody at a dilution of 1:12,500 in PBS (rabbit polyclonal antibody, Millipore, Cat# AB5804, RRID: AB2109645). Following incubation, sections were placed in a solution of biotinylated secondary antibody (1:200) and 2% normal serum. Lastly, sections were placed in avidin-peroxidase complex followed by NovaRED (SK4800, Vector Laboratories).
2.5. AD-type pathology
All chimpanzees aged 37 years and older were also included in a recent study of AD pathology in chimpanzees (Edler et al., 2017). To evaluate the response of astrocytes to the presence of neuropathological changes, the tau, amyloid, and pathology scores were calculated as previously described by Edler et al (2017). Briefly, the amyloid score was determined using three methods to assess Aβ plaque frequency, progression of amyloid pathology, and staging for cerebral amyloid angiopathy (CAA; Attems, Quass, Jellinger, & Lintner, 2007; Mirra et al., 1991; Montine et al., 2012; Thal et al., 2002; Vonsattel et al., 1991). For each individual, all four regions (PFC, MTG, CA1, and CA3) were examined and given a score from 0 to 3 for each of the three scoring methods. The regional scores were then totaled to provide a score ranging from 0 to 12 for each chimpanzee. This was repeated for each scoring method, resulting in an overall score of 0 to 36, representing the cumulative amyloid load within the brain. For tau score, two scoring methods measuring the frequency of tau neuritic plaques and NFT were utilized (Braak & Braak, 1991; Braak, Alafuzoff, Arzberger, Kretzschmar, & Del Tredici, 2006; Mirra et al., 1991; Montine et al., 2012). As before, each of the four brain regions was giving a score ranging from 0 to 3 for one scoring method and these scores were then summed in each individual to provide a score from 0 to 12. This was completed for both scoring methods. Therefore, each chimpanzee generates a tau score ranging from 0 to 24 that represents the overall amount of tau neuritic plaques and NFT in the brain. The pathology score for each chimpanzee is the sum of the amyloid and tau score (0 to 60) and represents the overall disease state of the brain.
Several quantitative measures of pathological markers collected by Edler et al. (2017) were also used as a means to examine the association of activated astrocytes to AD-type pathology. The pathological markers specific for amyloid pathology include amyloid precursor protein (APP)/Aβ plaque volume, APP/Aβ vessel volume, and Aβ42 vessel volume. All immunohistochemical procedures for APP/Aβ and tau (using antibody 6E10 for amyloid and antibody AT8 or CP13 for tau) were described in Edler et al. (2017) and the same materials were used in the present study.
2.6. Quantification and statistics
GFAP-immunoreactive (ir) astrocyte density (mm3) and soma volume (pm3) were quantified using an Olympus BX-51 photomicroscope equipped with Stereoinvestigator software (MBF Bioscience, Williston, VT, USA, version 11). Nissl-stained sections adjacent to the immunostained sections were used to guide the delineation of cortical layers and subfields at low magnification (4×, 0.13 N.A.; see Figs. 1 and 2). Astrocyte density was quantified using the optical fractionator probe at high magnification (40×, 0.75 N.A.). The counting frame was set at 100 × 100 μm with an optical disector height of 7 μm and a guard zone of 2 μm. Section thickness was measured at every fifth sampling site. All GFAP-ir astrocytes within the counting frame were counted. GFAP-ir soma volume was collected simultaneously using the nucleator probe in Stereoinvestigator. Soma volume was measured for every second marked astrocyte and 6 rays were used to define the soma edge. GFAP-ir astrocyte density was calculated as the estimated population divided by planimetric volume of the region of interest sampled. All statistical analyses were completed using IBM SPSS Statistics Data Editor 24.0 software. Significance was set at 0.05 except for tests examining sex differences, and Bonferroni correction post hoc analyses of cortical layer and region differences was used as appropriate for multiple t-test or Mann-Whitney U comparisons (α = .006 for sex and α = .017 for cortical layers and regions).
Mean astrocyte density and soma volume in each region by cortical layer were examined for sex differences using independent samples t-test. Mean differences were also analyzed between HC subfields CA1 and CA3 using the same statistical test. GFAP immunoreactivity density and soma volume, analyzed by cortical layer and subfield, were regressed on age, three scores (tau, amyloid, and pathology), and several markers of AD pathology obtained from our previous study, (see Edler et al., 2014 for full methodological details). For regressions using pathology scores and pathological markers, only chimpanzees 37 years of age and older were included in the analyses. Chimpanzees younger than 37 years (n = 9) did not show any signs of AD pathology as assessed with immunohistochemistry (i.e., 6E10 for amyloid and CP13 or AT8 for tau).
To analyze the differences among the three cortical layers (I, III, V) of the PFC and MTG, a one-way analysis of variance (ANOVA) was used. To compare GFAP-ir astrocyte density and soma volume by region, an overall average for each individual for each area was calculated. Average astrocyte density and soma volume for the PFC and MTG were calculated by adding the totals for each cortical layer together and then dividing by 3. For the HC, CA1 and CA3 densities or volumes were added together then divided by 2. These averages were compared using a one-way ANOVA. For the ANOVA of astrocyte density, the test of the homogeneity of variance was rejected. To correct for this, the nonparametric Kruskal-Wallis test was performed instead. All post hoc testing was conducted using independent samples t-tests or a Mann-Whitney U test.
3. RESULTS
3.1. Qualitative assessment of GFAP-ir astrocytes
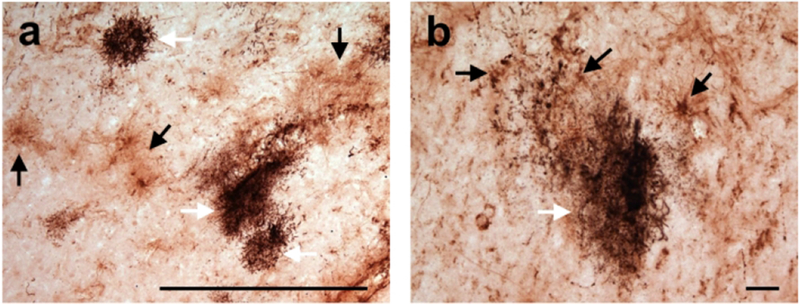
Immunostaining for GFAP was robust (Fig. 3) and GFAP-ir astrocytes were visualized in all examined regions (Fig. 3a). GFAP-ir astrocytes were present in higher quantities in the outer neocortical layers (layers I-III) with very few reactive astrocytes present in the deeper cortical layers (layers V and VI). Astrocytes in the superficial cortical layers often break their domains, creating regions or clusters of activated astrocytes (Fig. 3b, c).
FIGURE 3.
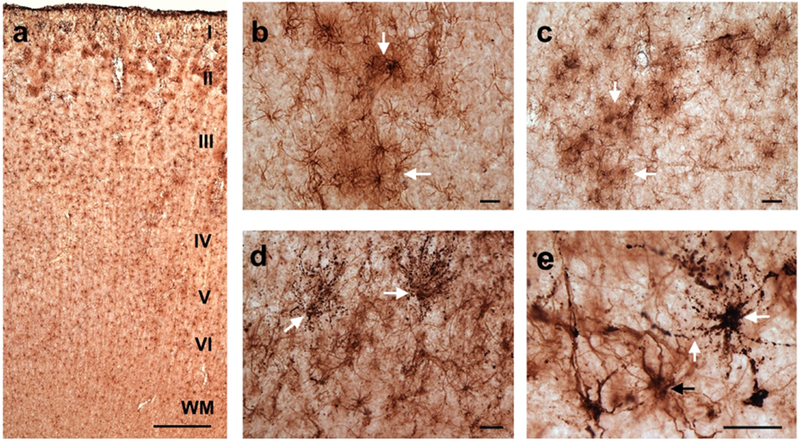
Photomicrographs of GFAP-ir astrocytes in the PFC of a 37 (a) 58 (b, c), 50 (d), and 57 (e) year-old chimpanzees demonstrating robust GFAP immunoreactivity and the presence of astrogliosis. GFAP immunolabeling can be seen throughout the cortical layers with astrogliosis occurring predominantly in the outer cortical layers (I-III; a). Activated astrocytes in the superficial cortical layers formed clusters (white arrows) with overlapping processes signifying a loss of domain organization (b, c). Panels d and e show double immunolabeling for GFAP and tau (white arrows). These astrocytes are morphologically consistent with what has been termed granular/fuzzy tau-ir astrocytes (white arrows; b, c). Scale bars = 250 μm (a) and 25 μm (b-e).
The term aging-related tau astrogliopathy (ARTAG) was recently applied to describe astroglial pathology detected using tau immunohistochemical markers (Kovacs et al., 2016; Kovacs et al., 2018). Although not quantified here, we did observe tau-positive astrocytes in the chimpanzee cortex, with morphological types consistent with what has been termed granular/fuzzy tau-ir astrocytes (Fig. 3d, e). Future studies are needed to determine if the chimpanzee pattern follows that of what has been reported in human aging (Kovacs et al., 2018).
Astrocytes were also more numerous in the neocortical regions compared to the HC. In addition, GFAP-ir astrocytes were frequently observed in association with blood vessels (Fig. 4), The processes of these astrocytes extended toward the vasculature in a web-like fashion (Fig. 4a). Many of these blood vessels were immunoreactive for AD pathology (Fig. 4b, c; Edler et al., 2017). GFAP-ir activated astrocytes were also found in association with pretangles and chimpanzee specific neuritic clusters (Fig. 5a, b; Edler et al., 2017).
FIGURE 4.
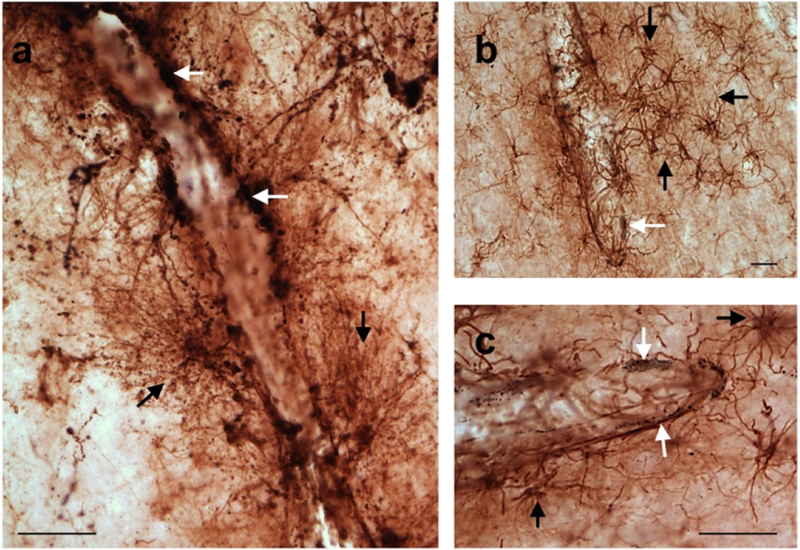
Astrogliosis was frequently found surrounding the vasculature in the PFC of a 57 (a) and 58 (b, c) year-old chimpanzees. The first panel shows astrocytes exhibiting tau accumulations (stained black; white arrows) lining blood vessels (a). Tau pathology was labeled using an antibody specific for phosphorylated tau (CP13). These astrocytes have many GFAP-ir processes (black arrows) that surround blood vessels in a web-like fashion (a). Panels b and c show activated astrocytes (black arrows) near blood vessels with amyloid pathology (stained black; white arrows). Amyloid pathology was labeled using antibodies specific for Aβ and amyloid precursor protein (6E10). Scale bars = 25 μm.
FIGURE 5.
Astrogliosis (black arrows) occurs near chimpanzee specific neuritic clusters (white arrows) in the frontal cortex of a 57 year-old male chimpanzee. Neuritic clusters are visualized with immunohistochemical staining for phosphorylated tau. Scale bars = 250 μm (a) and 25 μm (b).
3.2. Regional and laminar differences
There were no sex differences (Student’s t-test, all p’s > .006) for GFAP-ir astrocyte density and soma volume for all layers and regions examined. The Kruskal-Wallis analysis of GFAP-ir astrocyte density revealed a significant difference among the PFC, MTG, and HC (H = 41.88, p < .05). Post hoc testing showed that astrocyte density is significantly lower in the HC compared to the PFC (U = 23) and MTG (U = 51, both p’s < .017; see Fig. 6a). The ANOVA comparing astrocyte soma volume among regions was also significant (F2,74 = 3.92, p < .05). Post hoc analysis revealed that soma volume was larger in the PFC compared to the HC (t48 = 2.51, p < .017; Fig. 6b).
FIGURE 6.
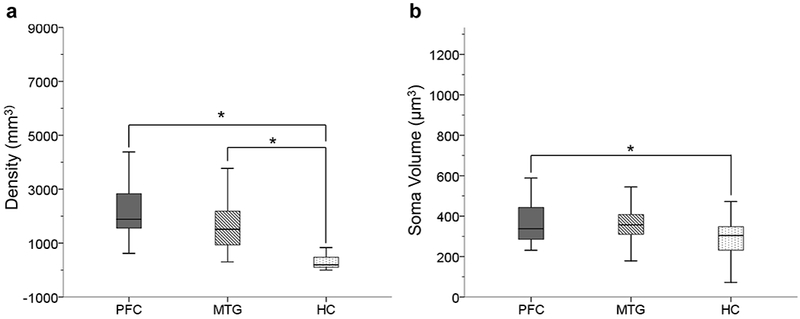
GFAP immunoreactivity is stronger in neocortical regions. Astrocyte density was significantly higher in PFC and MTG compared to HC (a; p’s < .017). Astrocyte soma volume was also significantly higher in PFC compared to HC (b; p < .017).
ANOVA analyses were used to compare astrocyte density in the PFC and MTG among layers I, III, and V. Significant differences were found among the three layers in each region (F2,78 = 17.29 for PFC and F2,75 = 4.97 for MTG, both p’s < .05; Fig. 7). Post hoc tests revealed that GFAP-ir density was higher in layer I relative to layers III and V for the PFC (t39.86 = 5.19 for layer III and t52 = 4.4 for layer V, both p’s < .017; Fig. 7a). Similarly, layer I astrocyte density was higher compared to layer III for MTG (t50 = 3.35, p > .017; Fig. 7b). The ANOVA analyses comparing astrocyte soma volume in the PFC and MTG by cortical layers was significant for both regions (F2,78 = 3.0 for PFC and F2,78 = 7.7 for MTF, both p’s < .05). Further post hoc tests showed that soma volume did not differ among individual cortical layers in the PFC (all p’s > .017). However, astrocyte soma volume was greater in layer I compared to layer V of the MTG (t52 = 4.0, p < .017; Fig. 7c).
FIGURE 7.
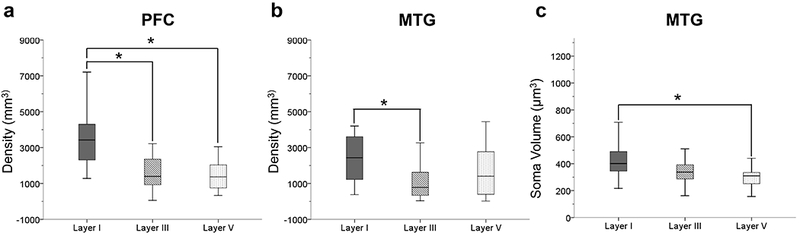
GFAP immunoreactivity was higher in layer I in both PFC and MTG. In the PFC there was a significantly greater astrocyte density in layer I compared to layers III and V (a; p’s < .017). In the MTG, astrocyte density was significantly higher in layer I compared to layer III (b; p < .017). Astrocyte soma volume in the MTG was significantly greater in layer I compared to layer V (c; p < .017).
Student’s t-tests demonstrated that astrocyte density and soma volume significantly differed between hippocampal subfields. The results indicated that there is a greater density of GFAP-ir astrocytes in the CA3 subfield compared to CA1 (t32.627 = −2.099, p < .05; Fig. 8a). However, CA1 astrocytes have a larger soma volume compared to the CA3 subfield (t40 = 2.028, p < .05; Fig. 8b).
FIGURE 8.
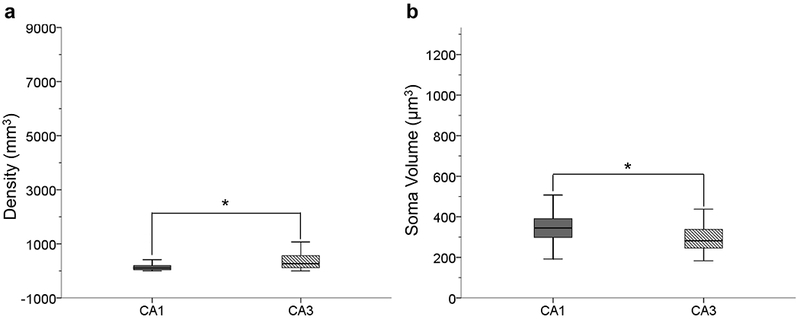
GFAP-ir astrocyte density was significantly higher in the CA3 subfield compared to the CA1 indicating that more astrocyte within the CA3 upregulate GFAP expression in aging (a; p < .05). Astrocyte soma volume is significantly greater in the CA1 indicating astrocytic hypertrophy (b; p < .05). This indicates that CA3 astrocytes are in the earlier stages astrogliosis compared to the CA1.
3.3. Aging and pathological markers
Age did not correlate with GFAP-ir astrocyte density or soma volume (p’s > .05) for the cortical layers and subfields examined with one exception (Figs. 9–11). The astrocytic soma volume in MTG layer V decreased with age (F1,25 = 5.87, p < .05; Fig. 10f). However, we believed this result was due to an outlier in the data (i.e. one value being more than 3 standard deviations from the mean) and the data were reanalyzed with this individual removed. The second test found that GFAP-ir astrocyte density does not decrease with age (F1,24 = 3.61, p > .05).
FIGURE 9.
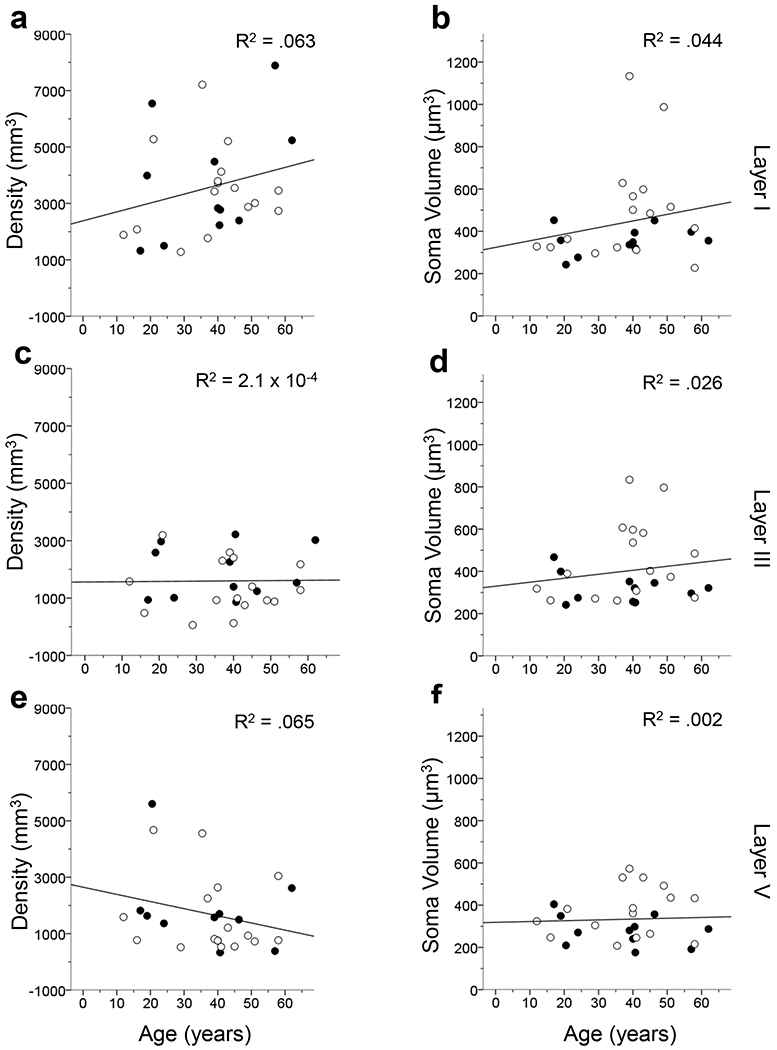
Linear regression results comparing GFAP-ir astrocyte density and soma volume by age in the layers of the PFC. All analyses reveal that astrocyte activation does not significantly correlate with age (p’s > .05). The R2 value of each regression is indicated in each panel. Open symbols, females; black symbols, males.
Figure 11.
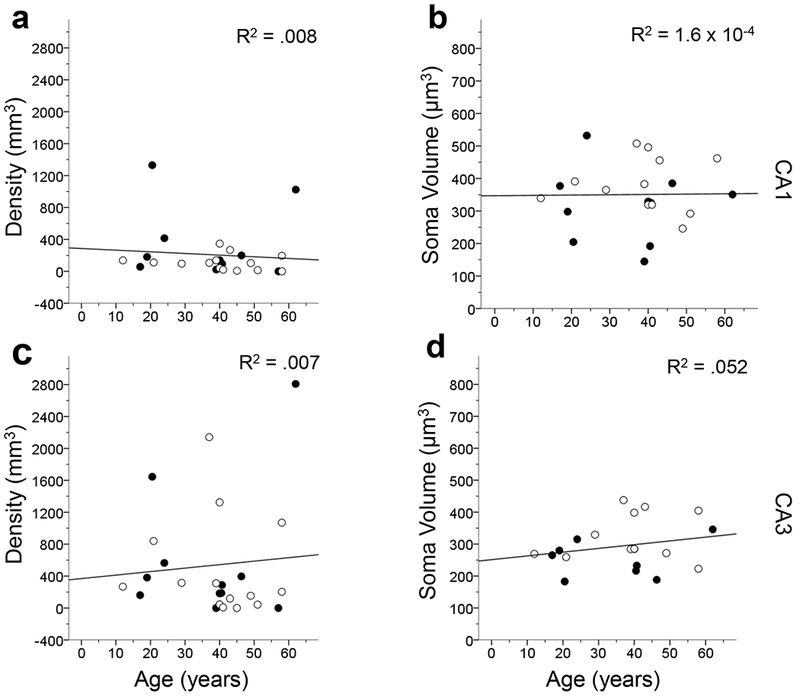
Linear regression comparing age to GFAP-ir astrocyte density and soma volume in each hippocampal subfield. The results show that GFAP-ir astrocyte density and soma volume were not significantly correlated with age (p’s > .05). The R2 value of each regression is indicated in each panel. Open symbols, females; black symbols, males.
FIGURE 10.
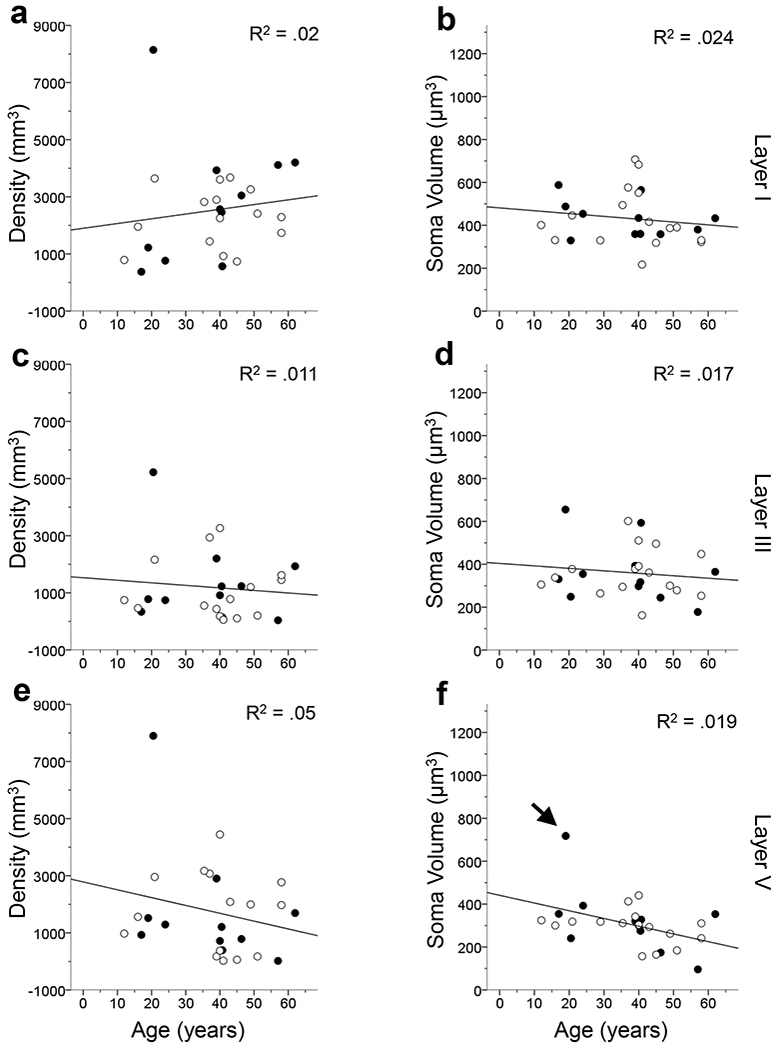
Linear regression analyses examining GFAP-ir astrocyte density and soma volume by age in the MTG by cortical layers. The results indicate that astrocyte activation does not significantly correlate with age in the MTG except for GFAP-ir astrocyte soma volume in layer V (p’s > .05 for a-e; p < .05 for f). In layer V, one sample’s soma volume was greater than 3 standard deviations away from the mean (black arrow) and thus was removed from the data set and the statistical analysis was rerun (f). Upon rerunning the analysis, GFAP-ir soma volume no longer significantly increased with age (f; p > .05). The R2 value of each regression is indicated in each panel. Open symbols, females; black symbols, males.
Regression analyses of tau, amyloid, and pathology scores revealed no significant relationship with astrocyte density or soma volume in the layers and subfield examined (all p’s > .05) except layer I of the PFC. GFAP-ir astrocyte density increased in PFC layer I as all three scores increased (F1,16 = 5.09 for tau score, F1,16 = 10.74 for amyloid score, and F1,16 = 13.06 for pathology score, all p’s < .05; Fig. 12a-c).
FIGURE 12.
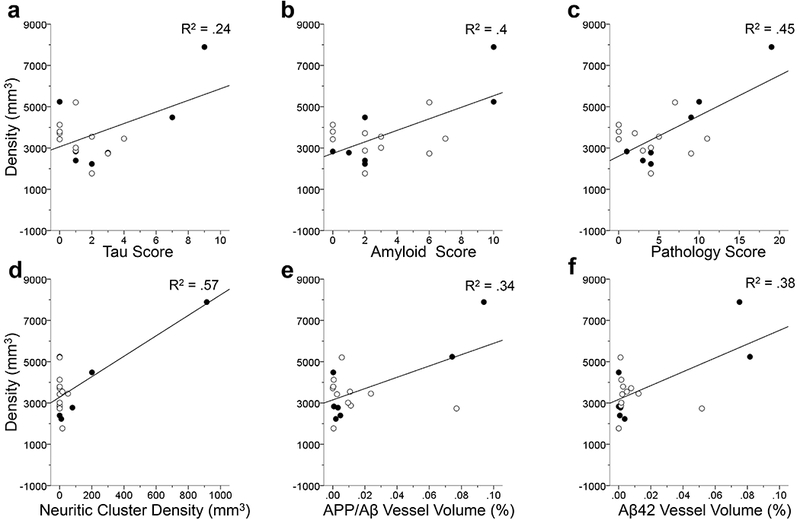
Linear regression analyses in PFC layer I comparing GFAP-ir astrocyte density to the three individual AD scores (a-c). Astrogliosis was significantly increased in relation to tau score (a), amyloid score (b) and pathology score (c; all p’s < 0.5). Linear regressions comparing GFAP immunolabeling density in PFC layer I to AD-type pathology (c-d). Each regression analyses showed a significant correlation to astrocyte GFAP immunoreactivity density in layer I in response to neuritic cluster density (d), APP/Aβ vessel volume (e), Aβ42 vessel volume (f; all p’s < .05). AD-type pathology appears to trigger an increase in the density of reactive astrocytes in layer I indicating the possible vulnerability of these astrocytes. The R2 value of each regression is indicated in each panel. Open symbols, females; black symbols, males.
Examination of the individual AD markers collected by Edler and colleagues (2017) showed that astrocyte density increased with neuritic cluster density (F1,16 = 20.9; Fig. 12d), APP/Aβ vessel volume (F1,16 = 8.18; Fig. 12e), and Aβ42 vessel volume (F1,16 = 9.96, all p’s < .05; Fig. 12f) in the PFC layer I. However, astrocyte density was not associated with APP/Aβ plaque volume or pretangle density (all p’s > .05). Astrocyte soma volumes in the PFC were not correlated with any specific pathological marker of AD (all p’s > .05). GFAP-ir astrocyte density and soma volume in the MTG were not correlated with any pathological marker of AD examined in this study.
In the CA1, astrocyte soma volume increased with neuritic cluster density (F1,12 = 6.36, p < .05; Fig. 13a), whereas astrocyte density significantly increased with APP/Aβ plaque volume (F1,16 = 29.85; Fig. 13b) and Aβ42 vessel volume (F1,15 = 4.82, both p’s < .05; Fig. 13c). For hippocampal subfield CA3, astrocyte density was shown to increase with APP/Aβ vessel volume (F1,16 = 4.58; Fig. 14a) and Aβ42 vessel volume (F1,15 = 9.2, both p’s < .05; Fig. 14b). Astrocyte soma volume in the CA3 subfield was not associated with any of the pathological markers of AD (all p’s > .05).
FIGURE 13.
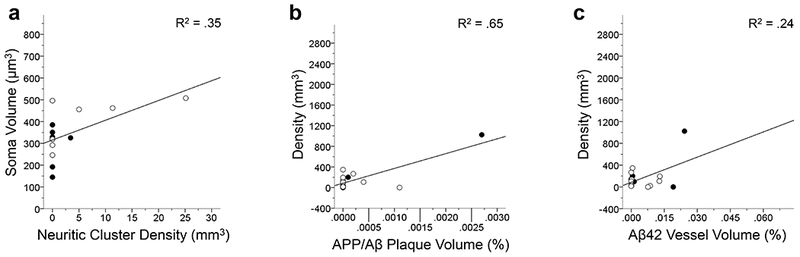
Linear regression analyses show that GFAP-ir soma volume significantly increases with tau neuritic cluster density in the CA1 (a; p < .05). The results of the linear regressions of GFAP-ir astrocyte density in the CA1 significantly increases with an increase APP/Aβ plaque volume (b) and Aβ42 vessel volume (c; both p’s < .05). Each regression indicates that activated astrocytes measured by overall density and soma volume increases in relation to AD-type pathology in the chimpanzee CA1. The R2 value of each regression is indicated in each panel. Open symbols, females; black symbols, males.
FIGURE 14.
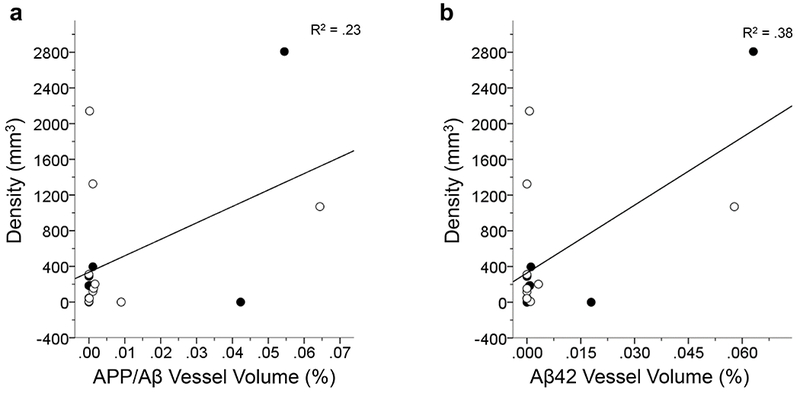
Linear regression analyses in the CA3 show a significant increase in GFAP-ir astrocyte density with an increase in APP/Aβ vessel volume (a) and Aβ42 vessel volume (b; both p’s < .05). These results indicate that there is a strong response by astrocytes to amyloid accumulation in the vasculature. The R2 value of each regression is indicated in each panel. Open symbols, females; black symbols, males.
4. DISCUSSION
The current sample included chimpanzees that ranged in age from 12 to 62 years. The lifespan of chimpanzees, even in captivity, does not usually exceed 50 years, therefore, the present sample is representative of an aged population from adolescence to maximum lifespan (Rowe & Meyers, 2012). Our results revealed that astrogliosis, as measured by GFAP-ir astrocyte density and soma volume, does not correlate with age in chimpanzees. These results differ from previous studies in humans and rodents that reported an increase in GFAP mRNA, GFAP protein expression, and hypertrophy of astrocyte soma volume with age (Table 2; Beach et al., 1989; David et al., 1997, Finch et al., 2002; Goss et al., 1991; Janota, Brites, Lemere, & Brito, 2015; Landfield, Rose, Sandles, Wohstaddter, & Lynch, 1977; Morgan et al., 1997; Nichols et al., 1993, O’Callaghan & Miller, 1991). However, these results are consistent with reports of no association of GFAP-ir astrocytes with age in rhesus macaques (Haley, Kohama, Urbanski, & Raber, 2010; Robillard, Lee, Chiu, & MacLean, 2016).
It has been proposed that the increase in GFAP expression in astrocytes may represent a response to increased inflammation and oxidative stress loads of the aging brain (Cotrina & Nedergaard, 2002; Morgan et al., 1997; Sohal & Weindruch, 1996). The lack of an increased GFAP expression with aging in chimpanzees suggests either a lower oxidative stress load with age or the existence of protective mechanisms that renders chimpanzee astrocytes less sensitive to disturbances in their environment. One study found that gene and protein expression differed between chimpanzees and humans specifically in relation to aerobic metabolism (Bauernfeind et al., 2015). This is intriguing as aerobic metabolism is one of the main producers of oxygen free radicals which can cause oxidative stress (Chance, Sies, & Boverls, 1979; Fridovich, 1978; Halliwell, 1994; Uttara, Singh, Zamboni, & Mahajan, 2009). Human astrocytes are also more integrated into the surrounding neuronal networks and have increased abilities to modulate neuronal transmission (Cotrina & Nedergaard, 2005; Oberheim et al., 2009; Parpura & Zorec, 2010; Pellerin et al., 1998; Sibille et al., 2014; Wallraff et al., 2006). It is possible that these changes make human astrocytes more sensitive to their local environments and thus more easily express a reactive phenotype.
The present study as well work in rhesus macaques examined astrogliosis using immunohistochemical methods to label GFAP expressing cells (Haley, Kohama et al., 2010; Robillard et al, 2016). However, the majority of work examining GFAP expression with age used methods that allowed for the quantification of the overall amount of protein or mRNA upregulation in the brain (Contrina & Nedergaard, 2002; Finch et al., 2002; Goss et al, 1991; Morgan et al., 1997; Nicholas et al, 1993). Unfortunately, these approaches cannot be reliably applied in most primate brain samples due to the method of postmortem tissue fixation. Therefore, even though we did not find an increase in the number of astrocytes labeled for GFAP, we cannot definitively state that the overall amount of this protein does not change with age. However, although our methods are limited, the results of this study are consistent with earlier reports that found differences between humans and chimpanzees in brain aging (Autrey et al., 2014; Chen et al., 2013; Sherwood et al., 2011).
A major risk factor of AD in humans is age (Akinyemi, Mukaetova-Ladinska, Attems, Ihara, & Kalaria, 2013; National Institute of Aging, 2012). The presence of AD pathological markers in aged chimpanzees provides an opportunity to examine the downstream consequences of those naturally-occurring pathologies in a nonhuman species. In humans, AD pathology (plaques and tangles) and activated astrocytes are common in neocortical layers II, III, and V (Arnold et al., 1991; Davies et al., 1987; Pearson et al., 1985; Lewis et al., 1987; Beach et al., 1989). However, in the present chimpanzee sample, little astrogliosis was noted outside the supragranular layers (I-III) or in the HC, and the densest astrocytic response appeared in layer I of the neocortex. This pattern of astrogliosis appears to differ from the pattern seen in a series of AD human brains which found that astrogliosis occurs throughout the cortex (Table 3; Beach et al., 1989). However, a second study examining GFAP expression in an AD human cohort found dense astrogliosis in layer I (Simpson et al., 2010). Therefore, high GFAP expression in the upper cortical layers may be a shared response to pathology for both humans and chimpanzees.
TABLE 3.
Pattern of astrogliosis due to aging and AD pathology in chimpanzees and humans.
| Pattern of Astrogliosis in Alzheimer’s Disease | ||
| Chimpanzees | Humans | Both |
| Lack of astrogliosis in neocortical layers where AD pathology is present. | Astrogliosis occurs heavily in neocortical layers II, III, and V.1 | Disruption of layer I interlaminar astrocytes in the neocortex.2,3 |
| Astrogliosis is triggered by amyloid pathology including CAA.4–7 | ||
| Astrogliosis increases in response to tau pathology (tau neurtic plaques and NFT’s).8 | ||
| Increase in astrogliosis with the progression AD pathological burden (i.e. pathology score).9 | ||
| Pattern of Astrogliosis in Nonpathological Aging | ||
| Chimpanzees | Humans | Both |
| GFAP-ir astrocyte density does not increase with age. | GFAP mRNA and protein increases with age.1,10–12 | Qualitative examinations reveal astrogliosis occurs in upper cortical layers in response to normal aging.1 |
We also examined astrogliosis in response to AD pathology in the chimpanzee brains. In the HC, we found a different regional pattern of GFAP-ir astrocyte density and soma volume between the hippocampal subfields. CA1 GFAP-ir astrocyte density was lower than that of CA3. However, CA1 astrocytes had a greater soma volume. Astrogliosis was associated with neuritic cluster density, APP/Aβ plaque volume, and Aβ42 vessel volume within the CA1 subfield, whereas astrogliosis within the CA3 was only associated with amyloid accumulation within the vasculature. These results are interesting in light of the fact that in humans, the CA1 is more vulnerable to AD pathology relative to CA3, further highlighting the differences between these two species in their response to pathology (Braak & Braak, 1991; Mueller et al., 2010; Rössler, Zarski, Bohl, & Ohm 2002). Further support for these differences were found by Edler et al (2018), who reported a higher density of activated microglia in the CA3 compared to the CA1 in aged chimpanzees which included samples with both Aβ and tau pathology.
GFAP-ir astrocyte density was higher in the PFC and MTG relative to the HC. Soma volume of the PFC GFAP-ir astrocytes was also significantly larger than in the HC. These results correspond to the pattern of AD-type pathology that showed a higher total percent area occupied by amyloid plaques as well as greater vascular amyloid deposition in the neocortex compared to the HC (Edler et al., 2017). Amyloid deposition in the neocortex likely triggered the higher astrogliosis observed in these regions, as activated astrocytes typically surround amyloid plaques (Beach & McGeer, 1988; Beach et al., 1989; DeWitt, Perry, Cohen, Doller, & Silver, 1998; Duffy et al., 1980; Kimbrough, Robel, Roberson, & Sontheimer, 2015; Mancardi et al. 1983; Mandybur, 1989; Nagele et al., 2004; Schechter et al., 1981; Rodríguez et al., 2009). Similarly, much of the astrogliosis we observed occurred in relation to vasculature pathology. A few chimpanzees in this study had pathology comparable to moderate or severe CAA (Edler et al., 2017). CAA occurs in a large proportion of AD brains and is caused by the accumulation of Aβ in small arteries and leptomeninges and plays a role in the development of microvascular lesions in the aging brain (Joachim, Morris, & Selkoe, 1988; Kövari, Herrmann, Hof, Bouras, 2013; Thal, Griffin, de Vos, & Ghebremedhin, 2008; Vinters, 1987; Vinters, Wang, & Secor, 1996). Therefore, some of the astrogliosis observed in the neocortex and HC is likely in response to an increase in vascular amyloid deposition.
Layer I of the PFC showed a significant increase in GFAP-ir astrocyte density with increased APP/Aβ vessel volume, Aβ42 vessel volume, and neuritic cluster density. This layer also showed a significant correlation between GFAP-ir astrocyte density and amyloid, tau, and pathology scores (Table 3). This is comparable to human AD brains, which demonstrate prominent astrogliosis with the progression of the disease, and mostly in association with amyloid plaques (Beach & McGeer, 1988; Beach et al., 1989; Cullen, 1997; Duffy et al., 1980; Mancardi et al., 1983; Mandybur, 1989; Nagele et al., 2004; Rodríguez et al., 2009; Schechter et al., 1981; Serrano-Pozo, Gómez-Isla, Growdon, Frosch, & Hyman 2013). Also, Serrano-Pozo et al. (2011) reported that activated astrocytes increase linearly throughout the progression of AD in humans, which also correlates with an increase in NFT. Similar to humans, chimpanzee astrogliosis was not associated with pretangle density (Serrano-Pozo et al., 2011). However, unlike humans, astrogliosis appeared restricted to layer I of the PFC and a global increase in GFAP expression was not seen in relation to AD pathology in the neocortex.
Layer I astrocytes exhibited a unique vulnerability to AD-like pathology in chimpanzees. Layer I of the primate cortex contains interlaminar astrocytes, a distinctive class of astrocytes which show greater complexity in primates compared to other mammals (Colombo, 1996; Colombo et al., 1997; Colombo et al., 1998; Colombo et al., 2001; Colombo & Reisin, 2004; Falcone et al., 2018; Oberheim et al., 2009). The somata of these interlaminar astrocytes in layer I possess long processes that extend deep into the cortical layers, terminating in layers III and IV. These long processes are often described having a columnar or palisade organization (Colombo et al., 1995; Colombo, Sherwood, & Hof, 2004; Colombo & Reisin, 2004; Oberheim et al., 2009). The superficial cortical layers where these astrocytes are found exhibit a high density of neuritic plaques in AD (Delaère, Duyckaerts, He, Piette, & Hauw, 1991; Geddes et al., 1997). Though not quantified here, previous reports have shown that AD pathology can disrupt the columnar organization of these astrocytes, with a loss of palisade structure and prominent GFAP immunoreactivity (Colombo et al., 2002). Another study examining interlaminar astrocytes in the great apes (orangutans, gorillas, and chimpanzees) found that a small number of chimpanzees had disruptions to their interlaminar astrocytes, with two chimpanzees lacking the typical columnar organization as well as showing signs of astrogliosis (ages 5 and 37; Colombo et al., 2004).
Overall, we found that much of the astrogliosis associated with AD pathology in chimpanzees was specific to the PFC, and most pronounced in layer I. This region plays a role in both episodic and working memory, which are both impaired early in the pathogenesis of AD and also in mild cognitive impairment (MCI) of humans (Bauer & Fuster, 1976; Fuster & Alexander, 1971; Kane & Engle, 2002; Kubota & Niki, 1971; Miller & Orbach, 1972). MCI is defined as progressive memory loss distinct from normal aging and has been suggested as a transitional stage between healthy aging and AD (Almkvist et al., 1998; Baddeley, Bressi, Della Sala, Logie, & Spinnler, 1991; Belleville, Peretz, & Malenfant, 1991; Bowen et al., 1997; Hänninen et al., 1995; Morris et al., 2001; Peterson et al., 1999). Importantly, cognitive data are not available for these chimpanzees, and as such, we are unable to assess potential memory impairment due to astrogliosis in the PFC of chimpanzees. However, the astrogliosis present in layer I suggests that this might be a shared response to AD-type pathology in both chimpanzees and humans (Table 3).
In conclusion, the present data show that PFC layer I astrocytes demonstrate a unique and early vulnerability to pathology in chimpanzees. While we did not directly evaluate human tissue in this sample, this finding in chimpanzees seems to be consistent with what has been reported in human AD. In contrast, astrogliosis in the aged and pathological chimpanzee brain, as measured by GFAP-ir astrocyte density and soma volume, differed from the patterns reported in humans. However, brain aging in chimpanzees appears to be consistent with that of other nonhuman primates. While speculative, these differences could indicate specific vulnerabilities of the human brain to neurodegenerative diseases such as AD that could be mediated by divergent inflammatory cascades.
ACKNOWLEDGMENTS:
We express our gratitude to Cheryl Stimpson and Bridget Wicinski for their expert technical assistance and to Dr. Peter Davies who generously provided the CP13 antibody. We would also like to thank Dr. Casadesus and Dr. Meindl for their profound discussions.
Grant sponsors: Grant sponsor: National Science Foundation; Grant number: BCS-1316829 (M.A.R.); National Institutes of Health; Grant numbers: NS042867, NS073134, and NS092988 (W.D.H. and C.C.S.), AG014308 (J.M.E.), and AG005138 (P.R.H).
Footnotes
CONFLICT OF INTERESTS: No conflict of interest to report.
REFERENCES
- Almkvist O, Basun H, Bäckman L, Herlitz A, Lannfelt L, Small B, …Winblad B (1998). Mild cognitive impairment: an early stage of Alzheimer’s disease? Journal of Neural Transmission 54, 21–29. [DOI] [PubMed] [Google Scholar]
- Alzheimer A (1911). Über eigenartige Krankheitsfälle des späteren Alters. Zeitschrift der Gesellschaft für Neurologie und Psychiatrie 4, 356–385. [Google Scholar]
- Akinyemi RO, Mukaetova-Ladinska EB, Attems J, Ihara M, & Kalaria RN (2013). Vascular risk factors and neurodegeneration in ageing related dementias: Alzheimer’s disease and vascular dementia. Current Alzheimer’s Research 10, 642–653. [DOI] [PubMed] [Google Scholar]
- Arnold SE, Hyman BT, Flory J, Damasio AR, & Van Hosen GW (1991). The topographical and neuroanatomical distribution of neurofibrillary tangles and neuritic plaques in the cerebral cortex of patients with Alzheimer’s disease. Cerebral Cortex 1, 103–116. [DOI] [PubMed] [Google Scholar]
- Armstrong RA (2009). The molecular biology of senile plaques and neurofibrillary tangles in Alzheimer’s disease. Folia Neuropathologica 47, 289–299. [PubMed] [Google Scholar]
- Avila-Muñoz E, & Arias C (2014). When astrocytes become harmful: Functional and inflammatory responses that contribute to Alzheimer’s disease. Ageing Research Reviews 18, 29–40. [DOI] [PubMed] [Google Scholar]
- Attems J, Quass M, Jellinger KA, & Lintner F (2007). Topographical distribution of cerebral amyloid angiopathy and its effect on cognitive decline are influenced by Alzheimer’s disease pathology. Journal of Neurological Sciences 257, 49–55. [DOI] [PubMed] [Google Scholar]
- Autrey MM, Reamer LA, Mareno MC, Sherwood CC, Herndon JG, Preuss TM, …Hopkins WD (2014). Age-related effects in the neocortical organization of chimpanzees: gray and white matter volume, cortical thickness, and gyrification. Neuroimage 101, 59–67. [DOI] [PMC free article] [PubMed] [Google Scholar]
- Baddeley AD, Bressi S, Della Sala S, Logie R, & Spinnler H (1991). The decline of working memory in Alzheimer’s disease. A longitudinal study. Brain 114, 221–2542. [DOI] [PubMed] [Google Scholar]
- Bauer RH, & Fuster JM (1976). Delayed-matching and delayed-response deficit from cooling dorsolateral prefrontal cortex in monkeys. Journal of Comparative Physiological Psychology 90, 293–302. [DOI] [PubMed] [Google Scholar]
- Bauernfeind AL, Soderblom EJ, Turner ME, Moseley MA, Ely JJ, Hof PR, …Babbitt CC (2015). Evolutionary divergence of gene protein expression in the brains of humans and chimpanzees. Genome Biology and Evolution 10, 2276–2288. [DOI] [PMC free article] [PubMed] [Google Scholar]
- Beach TB, & McGeer EG (1988). Lamina-specific arrangement of astrocytic gliosis and senile plaques in Alzheimer disease visual cortex. Brain Research 463, 357–361. [DOI] [PubMed] [Google Scholar]
- Beach TG, Walker R, & McGeer EG (1989). Patterns of gliosis in Alzheimer’s disease and aging cerebrum. Glia 2, 420–436. [DOI] [PubMed] [Google Scholar]
- Belleville S, Peretz I, & Malenfant D (1996). Examination of the working memory components in normal aging and in dementia of the Alzheimer type. Neuropsychologia 34, 195–207. [DOI] [PubMed] [Google Scholar]
- Braak H, Alafuzoff I, Arzberger T, Kretzschmar H, & Del Tredici K (2006). Staging of Alzheimer’s disease-associated neurofibrillary pathology using paraffin sections and immunocytochemistry. Acta Neuropathologica 112, 389–404. [DOI] [PMC free article] [PubMed] [Google Scholar]
- Braak H, & Braak E (1991). Neuropathological staging of Alzheimer-related changes. Acta Neuropathologica 82, 239–259. [DOI] [PubMed] [Google Scholar]
- Bowen J, Teri L, Kukull W, McCormick W, McCurry SM, & Larson EB Progression to dementia in patients with isolated memory loss. Lancet 349, 763–765 (1997). [DOI] [PubMed] [Google Scholar]
- Chance B, Sies H, & Boverls A (1979). Hydroperoxide metabolism in mammalian organs. Physiological Review 59, 527–605. [DOI] [PubMed] [Google Scholar]
- Chen X, Errangi B, Glasser MF, Westlye LT, Fjell AM, Walhovd KB, …Rilling JK (2013). Brain aging in humans, chimpanzees (Pan troglodytes), and rhesus macaques (Macaca mulatta): magnetic resonance imaging studies of macro- and microstructural changes. Neurobiology Aging 34, 2248–2260. [DOI] [PMC free article] [PubMed] [Google Scholar]
- Colombo JA (1996). Interlaminar astroglial processes in the cerebral cortex of adult monkeys but not of adult rats. Acta Anatomica 155, 5762. [DOI] [PubMed] [Google Scholar]
- Colombo JA (2001). A columnar-supporting mode of astroglial architecture in the cerebral cortex of adult primates? Neurobiology 9, 1–16. [DOI] [PubMed] [Google Scholar]
- Colombo JA, Gayol S, Yañez A, & Marco P (1997). Immunocytochemical and electron microscope observations on astroglial interlaminar processes in the primate neocortex. Journal of Neuroscience Research 48, 352–357. [PubMed] [Google Scholar]
- Colombo JA, Hartig W, Lipina S, & Bons N (1998). Astroglial interlaminar processes in the cerebral cortex of prosimians and old world monkeys. Anatomy and Embryology 197, 369–376. [DOI] [PubMed] [Google Scholar]
- Colombo JA, & Reisin HD (2004). Interlaminar astroglial of the cerebral cortex: a marker of the primate brain. Brain Research 1006, 126–131. [DOI] [PubMed] [Google Scholar]
- Colombo JA, Quinn B, & Puissant V (2002). Disruption of astroglial interlaminar processes in Alzheimer’s disease. Brain Research Bulletin 58, 235–242. [DOI] [PubMed] [Google Scholar]
- Colombo JA, Sherwood CC, & Hof PR (2004). Interlaminar astroglial processes in the cerebral cortex of great apes. Anatomy and Embryology 208, 215–218. [DOI] [PubMed] [Google Scholar]
- Colombo JA, Yáñez A, Puissant V, & Lipina S (1995). Long, Interlaminar astroglial cell processes in the cortex of adult monkeys. Journal of Neuroscience Research 40, 551–556. [DOI] [PubMed] [Google Scholar]
- Cotrina ML, & Nedergaard M (2002). Astrocytes in the aging brain. Journal of Neuroscience Research 67, 1–10. [DOI] [PubMed] [Google Scholar]
- Cotrina M, & Nedergaard M (2005). Intracellular calcium control mechanisms in glia In Kettenmann H & Ransom BR (Eds.), Neuoglia (2 ed.) (pp.229–239). New York, NY: Oxford University Press. [Google Scholar]
- Cullen KM (1997). Perivascular astrocytes within Alzheimer’s disease plaques. NeuroReport 8, 1961–1966. [DOI] [PubMed] [Google Scholar]
- Davies CA, Mann DM, Sumpter PQ, & Yates PO (1987). A quantitative morphometric analysis of the neuronal and synaptic content of the frontal and temporal cortex in patients with Alzheimer’s disease. Journal of the Neurological Sciences 78, 151–164. [DOI] [PubMed] [Google Scholar]
- David JP, Ghozali F, Fallet-Bianco C, Wattez A, Delaine S, Boniface B, …Delacourte A (1997). Glial reaction in the hippocampal formation is highly correlated with aging in the human brain. Neuroscience Letters 235, 53–56. [DOI] [PubMed] [Google Scholar]
- Delaère P, Duyckaerts C, He Y, Piette F, & Hauw JJ (1991). Subtypes and differential laminar distributions of βA4 deposits in Alzheimer’s disease: Relationship with the intellectual status of 26 cases. Acta Neuropathologica 81, 328–335. [DOI] [PubMed] [Google Scholar]
- DeWitt DA, Perry G, Cohen M, Doller C, & Silver J Astrocytes regulate microglial phagocytosis of senile plaque cores of Alzheimer’s disease. Experimental Neurology 149, 329–340 (1998). [DOI] [PubMed] [Google Scholar]
- Duffy PE, Rapport M, & Graf L (1980). Glial fibrillary acidic protein and Alzheimer-type senile dementia. Neurology 30, 778–782. [DOI] [PubMed] [Google Scholar]
- Edler MK, Sherwood CC, Meindl RS, Hopkins WD, Ely JJ, Erwin JM, …Raghanti MA (2017). Aged chimpanzees exhibit pathologic hallmarks of Alzheimer’s disease. Neurobiology of Aging 59, 107–120. [DOI] [PMC free article] [PubMed] [Google Scholar]
- Edler MK, Sherwood CC, Meindl RS, Munger E, Hopkins WD, Ely JJ, …Raghanti MA (2018). Microglia changes associated with Alzheimer’s disease pathology in aged chimpanzees. Journal of Comparative Neurology 526, 2921–2936. [DOI] [PMC free article] [PubMed] [Google Scholar]
- Falcone C, Wolf-Ochoa M, Amino S, Hong T, Vakilzadeh G, Hopkins WD, …Martínez-Cerdeño V (2018). Cortical interlaminar astrocytes across the therian mammal radiation. Journal of Comparative Neurology. In press. [DOI] [PMC free article] [PubMed] [Google Scholar]
- Fellin T, Pascual O, & Haydon PG (2006). Astrocytes coordinate synaptic networks: balanced excitation and inhibition. Physiology 21, 208–215. [DOI] [PubMed] [Google Scholar]
- Finch CE, Morgan TE, Rozovsky I, Xie Z, Weindruch R, & Prolla T (2002). Microglia and aging in the brain In Streit WJ (Eds.), Microglia in the regenerating and degenerating central nervous system (pp. 275–306). New York, NY: Springer-Verlag. [Google Scholar]
- Fridovich I (1978). The biology of oxygen radicals. Science 201, 875. [DOI] [PubMed] [Google Scholar]
- Fuster JM, & Alexander GE (1971). Neuron activity related to short-term memory. Science 173, 652–654. [DOI] [PubMed] [Google Scholar]
- Gearing M, Rebeck GW, Hyman BT, Tigges J, Mirra SS (1994). Neuropathy and apolipoprotein E profile of aged chimpanzees: implications for Alzheimer disease. Proceedings of the National Academy of Sciences of the United States of America 91, 9382–9386. [DOI] [PMC free article] [PubMed] [Google Scholar]
- Gearing M, Tigges J, Mori H, Mirra SS (1996). A beta40 is a major form of beta-amyloid in nonhuman primates. Neurobiology of Aging 17, 903–908. [DOI] [PubMed] [Google Scholar]
- Gearing M, Tigges J, Mori H, Mirra SS Beta-amyloid (A beta) deposition in the brains of aged orangutans. Neurobiology of Aging 18, 139–146. [DOI] [PubMed] [Google Scholar]
- Geddes JW, Tekirian TL, Soultanian NS, Ashford JW, Davis DG, & Markesbery WR (1997). Comparison of neuropathological criteria for the diagnosis of Alzheimer’s disease. Neurobiology of Aging 18, S99–S105. [DOI] [PubMed] [Google Scholar]
- Giannakopoulos P, Kövari E, Herrmann FR, Hof PR, & Bouras C Interhemispheric distribution of Alzheimer’s disease and vascular pathology in brain aging. Stroke 40, 983–986. [DOI] [PMC free article] [PubMed] [Google Scholar]
- Goedert M, Jakes R, Spillantini MG, Crowther RA, Cohen P, Vanmechelen E, …Burki K (1995). Tau protein in Alzheimer’s disease. Biochemical Society Transactions 23, 80–85. [DOI] [PubMed] [Google Scholar]
- Goss JR, Finch CE, & Morgan DG (1991). Age-related changes in glial fibrillary acidic protein mRNA in the mouse brain. Neurobiology of Aging 12, 165–70. [DOI] [PubMed] [Google Scholar]
- Haley GE, Kohama SG, Urbanski HF, & Raber J (2010). Age-related decreases in SYN levels associated with increases in MAP-2, apoE, and GFAP levels in the rhesus macaque prefrontal cortex and hippocampus. Age 32, 283–296. [DOI] [PMC free article] [PubMed] [Google Scholar]
- Halliwell B (1994). Free radicals, antioxidants, and human disease: curiosity, cause, or consequences? Lancet 344, 721–724. [DOI] [PubMed] [Google Scholar]
- Han X, Chen M, Wang F, Windrem M, Wang S, Shanz S, …Nedergaard M (2013). Forebrain engraftment by human glial progenitor cells enhances synaptic plasticity and learning in adult mice. Cell Stem Cell 12, 342–353. [DOI] [PMC free article] [PubMed] [Google Scholar]
- Hänninen T, Hallikainen M, Koivisto K, Helkala EL, Reinikainen KJ, Soininen H, …Riekkinen PJ Sr. (1995). A follow-up study of age-associated memory impairment: neuropsychological predictors of dementia. Journal of the American Geriatrics Society 43, 1007–1015. [DOI] [PubMed] [Google Scholar]
- Hansen LA, Armstrong DM, & Terry RD (1987). An immunohistochemical quantification of fibrous astrocytes in the aging human cerebral cortex. Neurobiology of Aging 8, 1–6. [DOI] [PubMed] [Google Scholar]
- Hardy JA, & Higgins GA (1992). Alzheimer’s disease: amyloid cascade hypothesis. Science 256, 184–185. [DOI] [PubMed] [Google Scholar]
- Heneka MT, Rodríguez JJ, & Verkhratsky A (2010). Neuroglia in neurodegeneration. Brain Research Reviews 63, 189–211. [DOI] [PubMed] [Google Scholar]
- Henneberger C, Papouin T, Oliet SH, & Rusakov DA (2010). Long-term potentiation depends on release of D-serine from astrocytes. Nature 463, 232–236. [DOI] [PMC free article] [PubMed] [Google Scholar]
- Janota CS, Brites D, Lemere CA, & Brito MA (2015). Glio-vascular changes during ageing in wild-type and Alzheimer’s disease-like APP/PS1 mice. Brain Research 1620, 153–168. [DOI] [PMC free article] [PubMed] [Google Scholar]
- Jicha GA, Bowser R, Kazam IG, & Davies P (1997). Alz-50 and MC-1, a new monoclonal antibody raised to paired helical filaments, recognize conformational epitopes on recombinant tau. Journal of Neuroscience Research 48, 128–132. [DOI] [PubMed] [Google Scholar]
- Joachim CL, Morris JH, & Selkoe DJ (1998). Clinically diagnosed Alzheimer’s disease: autopsy results in 150 cases. Annals of Neurology 24, 50–56. [DOI] [PubMed] [Google Scholar]
- Kane MJ, & Engle RW (2002). The role of prefrontal cortex in working-memory capacity, executive attention, and general attention, and general fluid intelligence: An individualdifferences perspective. Psychonomic Bulletin and Review 9, 637–671. [DOI] [PubMed] [Google Scholar]
- Kettenman H, & Verkhratsky A (2008). Neuroglia: the 150 years after. Trends in Neuroscience 31, 653–659. [DOI] [PubMed] [Google Scholar]
- Kim KS, Miller DL, Sapienza VJ, Chen CMJ, Bai C, Grundke-Iqbal I, …Wisniewski HM (1988). Production and characterization of monoclonal antibodies reative to synthetic cerebrovascular amyloid peptide. Neuroscience Research Communications 2, 121–130. [Google Scholar]
- Kimura N, Nakamura S, Goto N, Narushima E, Hara I, Shichiri S, …Yoshikawa Y (2001). Senile plaques in an aged western lowland gorilla. Experimental Animals 50, 77–81. [DOI] [PubMed] [Google Scholar]
- Kimbrough IF, Robel S, Roberson ED, & Sontheimer H (2015). Vascular amyloidosis impairs the gliovascular unit in a mouse model of Alzheimer’s disease. Brain 138, 3716–3733. [DOI] [PMC free article] [PubMed] [Google Scholar]
- Kovacs GG, Ferrer I, Grinberg LT, Alafuzoff I, Attems J, Budka H, …Dickson DW Aging-related tau astrogliopathy (ARTAG): harmonized evaluation strategy. Acta Neuropathologica 131, 87–102. [DOI] [PMC free article] [PubMed] [Google Scholar]
- Kovacs GG, Xie SX, Robinson JL, Lee EB, Smith DH, Schuck T, …Trojanowski JQ (2018). Sequential stages and distribution patterns of aging-related tau astrogliopathy (ARTAG) in the human brain. Acta Neuropathogica Communications 6, 1–19. [DOI] [PMC free article] [PubMed] [Google Scholar]
- Kövari E, Herrmann FR, Hof PR, & Bouras C (2013). The relationship between cerebral amyloid angiopathy and cortical microinfarcts in brain aging and Alzheimer’s disease. Neuropathology and Applied Neurobiology 39, 498–509. [DOI] [PMC free article] [PubMed] [Google Scholar]
- Kubota K, & Niki H (1971). Prefrontal cortical unit activity and delayed alternation performance in monkeys. Journal of Neurophysiology 34, 337–347. [DOI] [PubMed] [Google Scholar]
- Landfield PW, Rose G, Sandles L, Wohstaddter TC, & Lynch G (1977). Patterns of astroglial hypertrophy and neuronal degeneration in the hippocampus of aged, memory-deficient rats. Journal of Gerontology 32, 3–12. [DOI] [PubMed] [Google Scholar]
- Lewis DA, Campbell MJ, Terry RD, & Morrison JH (1987). Laminar and regional distributions of neurofibrillary tangles and neuritic plaques in Alzheimer’s disease: a quantitative study of visual and auditory cortices. Journal of Neuroscience 7, 1799–1808. [DOI] [PMC free article] [PubMed] [Google Scholar]
- Magistretti PJ (2006). Neuron-glia metabolic coupling and plasticity. Journal of Experimental Biology 209, 2304–2311. [DOI] [PubMed] [Google Scholar]
- Magistretti PJ, & Allaman I (2015). A cellular perspective on brain energy metabolism and functional imaging. Neuron 86, 883–901. [DOI] [PubMed] [Google Scholar]
- Magistretti PJ, & Pellerin L (1999). Cellular mechanisms of brain energy metabolism and their relevance to functional brain imaging. Philosophical Transactions of the Royal Society of London, Series B, Biological Sciences 354, 1155–1163. [DOI] [PMC free article] [PubMed] [Google Scholar]
- Magistretti PJ, Pellerin L, Rothman DL, & Shulman RG (1999). Energy on demand. Science 283, 496–497. [DOI] [PubMed] [Google Scholar]
- Mancardi GL, Liwnicz BH, & Mandybur TI (1983). Fibrous astrocytes in Alzheimer’s disease and senile dementia of Alzheimer’s type. Acta Neuropathologica 61, 76–80. [DOI] [PubMed] [Google Scholar]
- Mandybur TI (1989). Cerebral amyloid angiopathy and astrocytic gliosis in Alzheimer’s disease. Acta Neuropathologica 78, 329–331. [DOI] [PubMed] [Google Scholar]
- Markiewicz I, & Lukomska B (2006). The role of astrocytes in the physiology and pathology of the central nervous system. Acta Neurobiologica 66, 343–358. [DOI] [PubMed] [Google Scholar]
- Miller MH, & Orbach J (1972). Retention of spatial alternation following frontal lobe resection in stump-tailed macaques. Neuropsychologia 10, 291–298. [DOI] [PubMed] [Google Scholar]
- Mirra SS, Heyman A, McKeel D, Sumi SM, Crain BJ, Brownlee LM, …participating CERAD neuropathologists. (1991). The Consortium to Establish a Registry for Alzheimer’s Disease (CERAD). Part II. Standardization of the neuropathologic assessment of Alzheimer’s disease. Neurology 41, 479–486. [DOI] [PubMed] [Google Scholar]
- Mueller SG, Schuff N Yaffe K, Madison C, Miller B, & Weiner MW (2010). Hippocampal atrophy patterns in mild cognitive impairment and Alzheimer’s disease. Human Brain Mapping 31, 1339–1347. [DOI] [PMC free article] [PubMed] [Google Scholar]
- Montine TJ, Phelps CH, Beach TG, Bigio EH, Cairns NJ, Dickson DW, …Hyman BT (2012). National Institute of Aging-Alzheimer’s Association guidelines for the neuropathologic assessment of Alzheimer’s disease: a practical approach. Acta Neuropathologica 123, 1–11. [DOI] [PMC free article] [PubMed] [Google Scholar]
- Morgan TE, Rozovsky I, Goldsmith SK, Stone DJ, Yoshida T, & Finch CE (1997). Increased transcription of the astrocyte gene GFAP during middle-age is attenuated by food restriction: implications for the role of oxidative stress. Free Radical Biology and Medicine 23, 524–528. [DOI] [PubMed] [Google Scholar]
- Morris JC, Storandt M, Miller JP, McKeel DW, Price JL, Rubin EH, …Berg L (2001). Mild cognitive impairment represents early-stage Alzheimer disease. Archive of Neurology 58, 397–405. [DOI] [PubMed] [Google Scholar]
- Nagele RG, Wegiel J, Venkataraman V, Imaki H, & Wang KC (2004). Contribution of glial cells to the development of amyloid plaques in Alzheimer’s disease. Neurobiology of Aging 25, 663–674. [DOI] [PubMed] [Google Scholar]
- National Institute of Aging. (2012). Preventing Alzheimer’s disease. What do we know? National Institute of Health, No. 12–5503. [Google Scholar]
- Nichols NR, Day JR, Laping NJ, Johnson SA, & Finch CE (1993). GFAP mRNA increases with age in rat and human brain. Neurobiology of Aging 14, 421–429. [DOI] [PubMed] [Google Scholar]
- O’Callaghan NR, & Miller DB (1991). The concentration of glial fibrillary acidic protein increases with age in the mouse and rat brain. Neurobiology of Aging 12, 392–399. [DOI] [PubMed] [Google Scholar]
- Oberheim NA, Takano T, Han X, Lin JH, Wang F, Wyatt JD, …Nedergaard M (2009). Uniquely hominid features of adult human astrocytes. Journal of Neuroscience 29, 3276–3287. [DOI] [PMC free article] [PubMed] [Google Scholar]
- Oberheim NA, Wang X, Goldman S, & Nedergaard M (2006). Astrocytic complexity distinguishes the human brain. Trends in Neuroscience 29, 547–553. [DOI] [PubMed] [Google Scholar]
- Olabarría M, Noristani HN, Verkhratsky A, & Rodríguez JJ (2010). Concomitant astroglial and astrogliosis in a triple transgenic animal model of Alzheimer’s disease. Glia 58, 831–838. [DOI] [PubMed] [Google Scholar]
- Pakkenberg B, Pelvig D, Marner L, Bundgaard MJ, Gundersen HJG, Nyengaard JR, & Regeur L (2003). Aging in the human neocortex. Experimental Gerontology 38, 95–99. [DOI] [PubMed] [Google Scholar]
- Panatier A, Theodosis DT, Mothet JP, Touquet B, Pollegioni L, Poulain DA, & Oliet SHR (2006). et al. Glia-derived D-serine controls NMDA receptor activity and synaptic memory. Cell 125, 775–784. [DOI] [PubMed] [Google Scholar]
- Parpura V, & Zorec R (2010). Gliotransmission: Exocytotic release from astrocytes. Brain Research Reviews 63, 83–92. [DOI] [PMC free article] [PubMed] [Google Scholar]
- Pearson RCA, Esiri MM, Hiorns RW, Wilcock GK, & Powell TPS (1985). Anatomical correlates of the distribution of the pathological changes in the neocortex in Alzheimer disease. Proceedings of the National Academy of Sciences of the United States of America 82, 4531–4534. [DOI] [PMC free article] [PubMed] [Google Scholar]
- Pekny M, & Pekna M (2004). Astrocyte intermediate filaments in CNS pathologies and regeneration. Journal of Pathology 204, 428–437. [DOI] [PubMed] [Google Scholar]
- Pellerin L, Pellegri G, Bittar PG, Charnay Y, Bouras C, Martin JL, …Magistretti PJ (1998). Evidence supporting the existence of an activity-dependent astrocyte-neuron lactate shuttle. Developmental Neuroscience 20, 291–299. [DOI] [PubMed] [Google Scholar]
- Pelvig DP, Pakkenberg H, Stark AK, & Pakkenberg B (2008). Neocortical glial cell numbers in human brains. Neurobiology of Aging 29, 1754–1762. [DOI] [PubMed] [Google Scholar]
- Perea G, & Araque A (2005). Properties of synaptically evoked astrocyte calcium signal reveal synaptic information processing by astrocytes. Journal of Neuroscience 25, 2192–2203. [DOI] [PMC free article] [PubMed] [Google Scholar]
- Perez SE, Raghanti MA, Hof PR, Kramer L, Ikonomovic MD Lacor PN, …Mufson EJ (2013). Alzheimer’s disease pathology in the neocortex and hippocampus of the western lowland gorilla (Gorilla gorilla gorilla). The Journal of Comparative Neurology 521, 4318–4338. [DOI] [PMC free article] [PubMed] [Google Scholar]
- Peterson RC, Smith GE, Waring SC, Ivnik RJ, Tangalos EG, & Kokmen E (1999). Mild cognitive impairment: clinical characterization and outcome. Archives of Neurology 56, 303–308. [DOI] [PubMed] [Google Scholar]
- Robillard KN, Lee KM, Chiu KB, & MacLean AG (2016). Glial cell morphological and density changes through the lifespan of rhesus macaques. Brain Behavior and Immunity 55, 60–69. [DOI] [PMC free article] [PubMed] [Google Scholar]
- Rodríguez JJ, Olabarria M, Chvatal A, & Verkhratsky A (2009). Astroglia in dementia and Alzheimer’s disease. Cell Death and Differentiation 16, 378–385. [DOI] [PubMed] [Google Scholar]
- Rodríguez JJ, & Verkhratsky A (2011) Neuroglial roots of neurodegenerative diseases? Molecular Neurobiology 43, 87–96. [DOI] [PubMed] [Google Scholar]
- Rosen RF, Farberg AS, Gearing M, Dooyema J, Long PM, Anderson DC, …Walker LC (2008). Tauopathy with paired helical filaments in an aged chimpanzee. Journal of Comparative Neurology 509, 259–270. [DOI] [PMC free article] [PubMed] [Google Scholar]
- Rössler M, Zarski R, Bohl J, & Ohm TG (2002). Stage-dependent and sector-specific neuronal loss in hippocampus during Alzheimer’s disease. Acta Neuropathology 103, 363–369. [DOI] [PubMed] [Google Scholar]
- Rowe N, & Myers M (Eds.). (2012). All the World’s Primates. Rhode, Island, USA: Primate Conservation Inc. [Google Scholar]
- Schechter R, Yen SHC, & Terry RD (1981). Fibrous astrocytes in senile dementia of the Alzheimer type. Journal of Neuropathology and Experimental Neurology 40, 95–101. [DOI] [PubMed] [Google Scholar]
- Selkoe DJ, Bell DS, Podlisny MB, Price DL, & Cork LC (1987). Conservation of brain amyloid proteins in aged mammals and humans with Alzheimer’s disease. Science 235, 873–877. [DOI] [PubMed] [Google Scholar]
- Selkoe DJ, & Hardy J (2016). The amyloid hypothesis of Alzheimer’s disease at 25 years. EMBO Molecular Medicine 8, 595–608. [DOI] [PMC free article] [PubMed] [Google Scholar]
- Serrano-Pozo A, Gómez-Isla T, Growdon JH, Frosch MP, & Hyman T (2013). A phenotypic change but not proliferation underlies glial responses in Alzheimer’s disease. American Journal of Pathology 182, 2332–2344. [DOI] [PMC free article] [PubMed] [Google Scholar]
- Serrano-Pozo A, Mielke M, Gómez-Isla T, Betensky RA, Growdon JH, Frosch MP, & Hyman BT (2011). Reactive glia not only associates with plaques but also parallels tangles in Alzheimer’s disease. American Journal of Pathology 179, 1373–1384. [DOI] [PMC free article] [PubMed] [Google Scholar]
- Sherwood CC, Gordon AD, Allen JS, Phillips KA, Erwin JM, Hof PR & Hopkins WD (2011). Aging of the cerebral cortex differs between humans and chimpanzees.Proceedings of the National Academy of Sciences of the United States of America 108, 13029–13034. [DOI] [PMC free article] [PubMed] [Google Scholar]
- Sibille J, Pannasch U, & Rouach N (2014). Astroglial potassium clearance contributes to short-term plasticity of synaptically-evoked currents at the tripartite synapse. Journal of Physiology 592, 87–102. [DOI] [PMC free article] [PubMed] [Google Scholar]
- Simpson JE, Ince PG, Lace G, Forster PJ, Shaw PJ Matthews F, …Wharton SB (2010). Astrocyte phenotype in relation to Alzheimer-type pathology in the aging brain. Neurobiology of Aging 31, 578–590. [DOI] [PubMed] [Google Scholar]
- Sofroniew MV (2009). Molecular dissection of reactive astrogliosis and glial scar formation. Trends in Neuroscience 32, 638–647. [DOI] [PMC free article] [PubMed] [Google Scholar]
- Sofroniew MV, & Vinters HV (2010). Astrocytes: biology and pathology. Acta Neuropathologica 119, 7–35. [DOI] [PMC free article] [PubMed] [Google Scholar]
- Sohal RS, & Weindruch R (1996). Oxidative stress, caloric restriction, and aging. Science 273, 59–63. [DOI] [PMC free article] [PubMed] [Google Scholar]
- Suzuki A, Stern SA, Bozdagi O, Huntley GW, Walker RH, Magistretti PJ, & Alberini CM (2011). Astrocyte-neuron lactate transport is required for long-term memory formation. Cell 144, 810–823. [DOI] [PMC free article] [PubMed] [Google Scholar]
- Thal DR, Griffin ST, de Vos RA, & Ghebremedhin E (2008). Cerebral amyloid angiopathy and its relationship to Alzheimer’s disease. Acta Neuropathology 115, 599–609. [DOI] [PubMed] [Google Scholar]
- Thal DR, Rub U, Orantes M, & Braak H (2002). Phases of Aβ deposition in the human brain and its relevance for the development of AD. Neurology 58, 1791–1800. [DOI] [PubMed] [Google Scholar]
- Uttara B, Singh AV, Zamboni P, & Mahajan RT (2009). Oxidative stress and neurodegenerative diseases: A review of upstream and downstream antioxidant therapeutic options. Current Neuropharmacology 7, 65–74. [DOI] [PMC free article] [PubMed] [Google Scholar]
- Wallraff A, Köhling R, Heinemann U, Theis M, Willecke K, & Steinhāuser C (2006). The impact of astrocytic gap junctional coupling on potassium buffering in the hippocampus. Journal of Neuroscience 26, 5438–5447. [DOI] [PMC free article] [PubMed] [Google Scholar]
- Wilhelmsson U, Bushong EA, Price DL, Smarr BL, Phung V, Terada M, …Pekny M (2006). Redefining the concept of reactive astrocytes as cells that remain within their unique domains upon reaction to injury. Proceedings of the National Academy of Sciences of the United States of America 103, 17513–17518. [DOI] [PMC free article] [PubMed] [Google Scholar]
- Verkhratsky A, & Nedergaard M (2017). Physiology of astroglia. Physiological Reviews 98, 239–289. [DOI] [PMC free article] [PubMed] [Google Scholar]
- Verkhratsky A, Olabarria M, Noristani HN, Yeh CY, & Rodriguez JJ (2010). Astrocytes in Alzheimer’s disease. Neurotherapeutics 7, 399–412. [DOI] [PMC free article] [PubMed] [Google Scholar]
- Verkhratsky A, & Parpura V (2016). Astrogliopathology in neurological, neurodevelopment and psychiatric disorders. Neurobiology of Disease 85, 254–261. [DOI] [PMC free article] [PubMed] [Google Scholar]
- Vinters HV (1987). Cerebral amyloid angiopathy. A critical review. Stroke 18, 311–324. [DOI] [PubMed] [Google Scholar]
- Vinters HV, Wang ZZ, & Secor DL (1996). Brain parachymal and microvascular amyloid in Alzheimer’s disease. Brain Pathology 6, 179–195. [DOI] [PubMed] [Google Scholar]
- Vonsattel JP, Myers RH, Hedley-Whyte ET, Ropper AH, Bird ED, & Richardson EP Jr. (1991). Cerebral amyloid angiopathy without and with cerebral hemorrhages: A comparative histological study. Annals of Neurology 30, 637–649. [DOI] [PubMed] [Google Scholar]