

Abstract
Class III Semaphorin (Sema) secreted ligands are known to repel neurites expressing Neuropilin (Nrp) and/or Plexin (Plxn) receptors. There is, however, a growing body of literature supporting that Sema signaling also has alternative roles in development such as synaptogenesis, boundary formation and vasculogenesis. To evaluate these options during inner ear development, we used in situ hybridization or immunohistochemistry to map the expression of Sema3D, Sema3F, Nrp1, Nrp2, and PlxnA1 in the chicken (Gallus gallus) inner ear from embryonic day (E)5 to E10. The resulting expression patterns in either the otic epithelium or its surrounding mesenchyme suggest that Sema signaling could be involved in each of the varied functions reported for other tissues. Sema3D expression flanking the sensory tissue in vestibular organs suggests that it may repel Nrp2- and PlxnA1-expressing neurites of the vestibular ganglion away from nonsensory epithelia, thus channeling them into the sensory domains at E5-E8. Expression of Sema signaling genes in the sensory hair cells of both the auditory and vestibular organs on E8–E10 may implicate Sema signaling in synaptogenesis. In the nonsensory regions of the cochlea, Sema3D in the future tegmentum vasculosum opposes Nrp1 and PlxnA1 in the future cuboidal cells; the abutment of ligand and receptors in adjacent domains may enforce or maintain the boundary between them. In the mesenchyme, Nrp1 colocalized with capillary-rich tissue. Sema3D immediately flanks this Nrp1-expressing tissue, suggesting a role in endothelial cell migration towards the inner ear. In summary, Sema signaling may play multiple roles in the developing inner ear.
Keywords: RRID CVCL_0570, RRID AB_531974, RRID AB_528098, RRID AB_355445, RRID AB_1841228, Semaphorin, Neuropilin, Plexin, Ear, Inner, Chicken Embryo
Graphical abstract
In situ hybridization and immunohistochemistry were used to map the expression of class III Semaphorins and their receptors in the chicken inner ear from embryonic day (E)5 to E10. The resulting expression patterns suggest that Semaphorins could be involved in axon guidance, synaptogenesis, boundary formation/maintenance, and endothelial cell migration.
Introduction
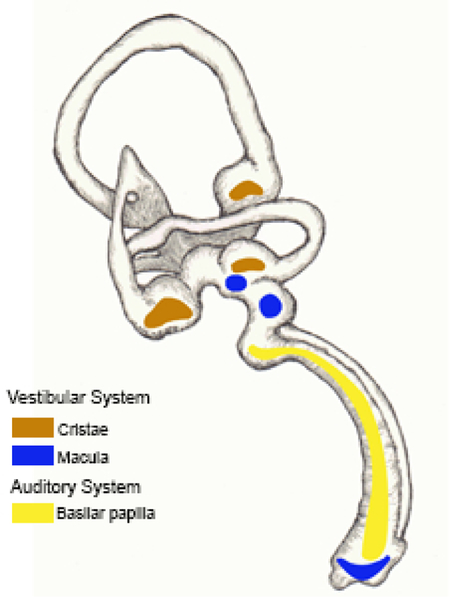
The inner ear houses two sensory systems: the vestibular system, which detects spatial orientation and angular acceleration of the head, and the auditory system, which detects sound. In birds, the peripheral vestibular system utilizes seven sensory organs: three cristae (anterior, lateral, and posterior), and four maculae (utricular, saccular, lagenar and neglecta). The avian auditory system functions through a single sensory organ, the basilar papilla (BP; homologous to the organ of Corti in mammals), located within the cochlear duct (CD) (fig. 1a). In both systems, the perception of sensory information depends upon mechanosensory transduction by hair cells (HCs) and the delivery of this information to the primary afferent neurons that make synaptic connections with the receptor cells (Lewis et al., 1985). Many research groups have investigated how classic axon guidance factors impact afferent innervation of the auditory and vestibular organs (Appler & Goodrich, 2011; Battisti et al., 2014; Coate et al., 2015; Defourny et al., 2013; Fekete & Campero, 2007; Frank & Goodrich, 2018; Ghimire et al., 2018).
Figure 1. Semaphorin3D and Neuropilin2 decrease in the presence of exogenous Wnt9a.

(a) A diagram of an E8 chicken inner ear highlights each of the sensory organs examined in this study. The cristae (anterior, posterior, and lateral) are in brown. The macula (utricle, saccule, and lagena) are in blue. The basilar papilla (BP) is in yellow. In the subsequent figures, images of horizontal cross sections of these organs will be shown. In this figure, (b-g) presents serial horizontal cross sections through the right and left BPs of an E6 embryo, 3 days after injection of the right otocyst with RCAS(A)-Wnt9a. The approximate location of the cross sections is indicated by the dotted line in (b) The left BP was uninfected, with scattered virus, detected by immunolabeling for viral gag protein (3C2), present only in the periotic mesenchyme. (c) Virus had spread to both the cochlear epithelium and periotic mesenchyme on the right side. (d-e) Sema3D transcripts are decreased in the sensory domain in the presence of exogenous Wnt9a. (f-g) Nrp2 transcripts expressed on the abneural side of the BP are reduced in the presence of exogenous Wnt9a. (b-g) The epithelium and ganglion are outlined in each image. n=3. Scale bar is 100 µm. Abbreviations: Ab, abneural side of the BP; AC, anterior crista; AG, auditory ganglion; BP, basilar papilla; D, dorsal; LC, lateral crista; LM, lagena macula; N, neural side of the BP; P, posterior; PC, posterior crista; SM, saccular macula; UM, utricular macula.
In addition to classic axon guidance factors, morphogens have also been shown to impact innervation in the inner ear, probably via an indirect effect. In a recent study, Munnamalai and colleagues found that overexpression of Wnt9a in the chicken BP increased the number of tall HCs (homologous to mammalian inner HCs), the amount of afferent innervation of the BP, and the number of excitatory ribbon synapses when compared to controls. In contrast, efferent innervation was reduced (Munnamalai et al., 2017). Given that Wnt9a and other Wnts do not directly impact the outgrowth of cultured auditory ganglion neurons (Fantetti, 2011; Fantetti et al., 2011), the authors hypothesized that axon guidance genes acting downstream of Wnt9a were likely responsible for the changes in afferents. RNA deep sequencing identified Semaphorin (Sema)3D, a secreted axon guidance factor, and its membrane-bound receptor, Neuropilin (Nrp)2, as down-regulated in Wnt9a-overexpressing BPs compared to controls. Since Semaphorins are most commonly known to act as repulsive cues for neurites, the absence of Sema3D (due to excess Wnt9a) could explain why the peripheral processes of the afferents were excessive. However, robust expression of Sema3D across the entire organ in controls was inconsistent with this proposal, since afferents normally grow into Sema3D-expressing territory. Thus, alternative functions of Sema3D within the sensory domain need to be considered. For example, Sema signaling has been linked synaptogenesis and many other alternative functions (Tillo et al., 2012; Yazdani & Terman, 2006). In addition, the Sema receptor, Nrp, can form complexes with other co-receptors such as Plexins (Plxn) or immunoglobulin-like cell adhesion molecules; these interactions can influence the functional outcome (Zhou et al., 2008).
To gain a better understanding of the roles of Sema signaling in the embryonic inner ear, here we present the expression of Sema3D, Nrp and PlxnA1 genes in the auditory and vestibular organs, as well as changes in Nrp2 levels in response to Wnt9a-overexpression. We additionally examined Sema3F, as it has previously been shown to influence innervation in the mouse auditory organ (Coate et al., 2015). The expression patterns described leave open the possibility that Sema signaling may serve various roles in innervation, synaptogenesis, vasculogenesis, and boundary formation within the inner ear, any of which may impact either hearing or vestibular disorders, including Meniere’s disease.
Materials & Methods
Virus preparation and injection
UMNSAH/DF-1 chicken fibroblasts (RRID: CVCL_0570) were transfected with the pRCAS(A)/Wnt9a plasmid (Hartmann & Tabin, 2001). After 7days, virus was collected from the supernatant, concentrated, and titered (Morgan & Fekete, 1996). RCAS(A)/Wnt9a (7×10⁹ infectious units/ml) virus was injected into the otocyst of embryonic day (E) 3 chicken (Gallus gallus) embryos from Specific pathogen-free eggs (Charles River), as described by (Munnamalai et al., 2017). Embryos were harvested 3 days after infection.
Blood vessel infusion
Fluorescent dye was extracted from a highlighter pen (Sharpie yellow 1912767) and diluted 1:2 in phosphate buffered saline (PBS). Approximately 2–3 µl of diluent was injected into the circulatory system through the vitelline artery using a pulled glass pipet, as previously described by (Takase et al., 2013).
Tissue preparation
White Leghorn chicken embryos (Purdue University farms) were incubated at 37ºC, collected and staged using Hamburger and Hamilton (1951). Our animal protocols are in compliance with the US National Research Council’s Guide to the Care and Use of Laboratory Animals, the US Public Health Service’s Policy on Humane Care and Use of Laboratory Animals, and the Guide for the Care and Use of Laboratory Animals. All tissue was processed using RNase-free tools and solutions. Embryo heads were fixed overnight at 4ºC in 4% paraformaldehyde (PFA) in PBS, washed in PBS and dehydrated in ascending concentrations of sucrose solutions (10%, 20%, and 30% sucrose in PBS). Tissue was frozen in Tissue Freezing Media (General Data Company, Inc.). Using a cryostat, the inner ear was cut from dorsal-to-ventral as 15µm-thick sections. Embedded hearts were cut into 15µm-thick sagittal sections as a positive control for Sema3D and Sema3F in situ probes (Bao & Jin, 2006; Jin et al., 2006). Adjacent sections were collected onto three sets of alternating Superfrost® Plus Slides (Fisherbrand ® ) and stored at −20ºC until subjected to in situ hybridization or immunohistochemistry. Each alternate slide series was used for a different probe or antibody. Whenever possible, we tried to include alternate labels on the same embryo in the figures.
RNA probes
For Sema3D (NM_205373.1, 1031–1792) and Sema3F (NM_204258.1, 721–1440), probe templates were created from chicken cDNA using primer sequences as reported earlier (Bao & Jin, 2006; Jin et al., 2006). The amplicons were inserted into the Topo TA vector. Probes were transcribed from the plasmid templates using T7 or T3 RNA polymerase (Promega) and Digoxigenin-RNA labeling mix (Roche). The probes were purified using RQ1 DNase (Promega) and precipitated with LiCl and ethanol. Electrophoresis (1% agarose gel) was used to check the quality of the probes. RNAscope® Nrp2 (Cat #501191) and PlxnA1 (Cat #506111) probes were ordered from Advanced Cell Diagnostics.
Alkaline phosphatase in situ hybridization
For Sema3D and Sema3F in situ hybridizations, sections were post fixed in 4% PFA, treated with 1 µg/ml Proteinase K for 10 minutes, and incubated overnight with 1 µg/ml Digoxygenin-labeled probe at 72º C. Probes were detected using 1:3500 anti-digoxigenin alkaline phosphatase fab fragments (Roche, table 2), and developed with SigmaFast nitroblue tetrazolium/5-bromo-4chloro-3-indolyl-phosphate (Sigma). This protocol was described previously (Sanchez-Calderon et al., 2004; Sienknecht & Fekete, 2008).
RNAScope in situ hybridization
Nrp2 and PlxnA1 in situ hybridizations were performed using the RNAscope® 2.5 HD Detection Red protocol and reagents from Advanced Cell Diagnostics.
Immunohistochemistry and antibody characterization
Detailed information on each of the primary and secondary antibodies used in this work can be found in tables 1 and 2, respectively. 3, 3’-diaminobenzidine (DAB) immunohistochemistry was used to label neurites of the vestibular and auditory ganglia using neurofilament-associated antibody (DHSB Cat#3A10; RRID AB_531974) after in situ hybridization as previously done by Adam et al. (1998); Sanchez-Calderon et al. (2004); Sienknecht and Fekete (2009). This antibody has also been used to label neural tissue throughout the chicken embryo (Perez et al., 1999; Storey et al., 1992). In RCAS(A)-Wnt9a infected embryos, the method was used to identify the 3C2 epitope of Avian Myoblastosis Virus core protein (DHSB Cat#AMV-3C2; AB_528098). The AMV-3C2 antibody was characterized and validated for detecting Avian Sarcoma and Leukosis viruses by Potts et al. (1987).
Table 1. Primary Antibodies.
lists detailed information on each of the primary antibodies used in this study.
| Antibody | Host/ Isotype |
Antigen | Source | Catalog Number and RRID |
Dilution |
|---|---|---|---|---|---|
| Neurofilament Associated protein (3A10) |
Mouse/ Monoclonal IgG1 |
Chick nervous tissue from ventral spinal cord |
Developmental Studies Hybridoma Bank |
DHSB Cat #: 3A10 RRID: AB_531974 |
1:250 |
| Avian Myoblastosis Virus (AMV) |
Mouse/ monoclonal IgG1 |
Avian myoblastosis virus, the first 155 amino acids of the Gag-Pro polyprotein |
Developmental Studies Hybridoma Bank |
DHSB Cat #: AMV-3C2 RRID: AB_528098 |
1:40 |
| Neuropilin1 (Nrp1) |
Goat/ polyclonal IgG |
Mouse myeloma cell line NS0-derived recombinant rat Neuropilin1 (Phe22- Ala810, Ser829- Asp854) |
R&D Systems | R&D Cat #: AF566 RRID: AB_355445 |
1:50 |
| Neuron- specific classIII β-tubulin (Tuj1) |
Mouse/ monoclonal IgG2A |
Synthetic peptide corresponding to conserved amino acids 436–450 of neuron specific class III β- tubulin |
Sigma | Sigma Cat #: T8578 RRID: AB_1841228 |
1:500 |
Table 2. Secondary Antibodies.
lists detailed information on each of the secondary antibodies used in this study.
| Antibody | Source | Catalog Number |
Dilution |
|---|---|---|---|
| Anti-Digoxigenin-AP, Fab fragments | Roche Applied Science | 11093274910 | 1:3500 |
| Biotinylated horse anti-mouse IgG | Vector Laboratories | BA-2000 | 1:250 |
| Alexa Flour 568 donkey anti-goat IgG | ThermoFisher Scientific | A11057 | 1:250 |
| Alexa Flour 647 donket anti-mouse IgG | ThermoFisher Scientific | A1252811 | 1:250 |
Note that the anti-digoxigenin-AP fab fragments were used to detect dig-labeled RNA probes for in situ hybridization.
Tissue sections were post fixed with 4% PFA, washed with PBS, and then blocked in 5% normal goat serum/ 0.05% Sodium azide/ 0.05% Tween in PBS. Sections were labeled with primary antibody, 3A10 or AMV-3C2, overnight at 4ºC or 1 hour at room temperature. Endogenous peroxidases were saturated with 0.3% H2O2 in cold methanol for 30 min. The primary antibody was detected with a biotinylated horse anti-mouse IgG secondary antibody and a Vectastain® Avidin-Biotin Complex Horseradish Peroxidase kit (PK-4000, Vector Laboratories). Peroxidase activity was detected using 0.5 mg/ml DAB and 0.06% H2O2 in 50mM Tris pH 7.5. Slides were coverslipped with Fluoromount-G® (0100–01, SouthernBiotech). Tissue sections were imaged using a Nikon Eclipse E800 photomicroscope and a SPOT Insight CMOS 5MP camera.
Immunofluorescence was used to label Nrp1 and neuron-specific classIII β-tubulin (Tuj1) in embryos injected with fluorescent dye. Tissue sections were fixed with 4% PFA in PBS, washed with PBS, and blocked in 5% normal horse serum/ 0.05% Sodium azide/ 0.05% Tween in PBS. The primary antibodies, Nrp1 (R&D Cat #AF566; RRID AB_355445) and Tuj1 (Sigma Cat#T8578, RRID AB_1841228), were applied overnight at 4ºC. The Nrp1 antibody was previously validated for use in chicken by Sanyas et al. (2012) and Moret et al. (2007). We also confirmed the expression pattern of Nrp1 using RNAscope® in situs (Nrp1 probe Cat #501181). Tuj1 has been previously used to label auditory ganglion neurites and immature HCs in the chicken embryo (Molea et al., 1999). Fluorophore conjugated antibodies, Alexa Fluor 568 donkey anti-goat IgG and Alexa Fluor 647 donkey anti-mouse IgG were used to detect the primary antibodies. Slides were coverslipped with Fluoromount-G® (0100–01, SouthernBiotech) and the tissue was imaged using a Nikon Eclipse 90i confocal microscope.
Results
In the sections below, molecular expression patterns within the developing inner ear were visualized with several labeling methods. We used an alkaline-phosphatase-based in situ hybridization protocol to map Sema3D and Sema3F transcripts in purple, with diaminobenzidine immunohistochemistry to co-label axons in brown. The Nrp1 receptor was visualized by immunofluorescence in the red channel, along with Tuj1 immunofluorescence to co-label for neurites in the far-red (false-colored blue) and a yellow fluorescent-dye (depicted in green) that was used to fill the vasculature in live embryos. Transcripts for Nrp2 and PlxnA1 were visualized with RNA-Scope probes using a magenta histochemical processing protocol and a purple hematoxylin counterstain. Immunohistochemistry (brown label) was used to map retrovirus-infected cells.
Changes in Nrp2 levels in response to Wnt9a overexpression
As previously reported by Munnamalai et al. (2017), Sema3D transcripts in the prosensory domain decrease in the presence of exogenous Wnt9a at E6, in comparison to the contralateral control side (fig. 1 b-e). The RNA sequencing data set from that report indicates that Nrp2 transcripts are downregulated. Here, we confirm that Nrp2 expressed in the prosensory epithelium at E6 is nearly abolished when Wnt9a is over expressed (fig. 1 f-g).
Time course of Sema signaling genes in the inner ear
Within each inner ear compartment, regional expression is presented, with epithelial (sensory and non-sensory), neuronal, periotic mesenchymal and periotic vascular expression patterns described. A summary of expression for each timepoint and gene can be found at the bottom on figures 2–5. We examined time points for ages ranging from E4-E10; however, only expression patterns for E5, E6, E8, and E10 are described below. These specific time points were chosen based on changes in expression patterns that occurred at these time points for some genes. During the time range examined, critical events such as innervation, synaptogenesis, and differentiation of the prosensory domain are occurring. A summary of the number of in situs and immunofluorescent labels performed for each gene and time point can be found in table 3.
Table 3. Summary of in situ and immunohistochemistry replicates for uninfected embryos.
lists the number of replicates performed for each gene at each age. For each embryo used in this study, adjacent sections were taken onto three alternating slides.
| Gene | HH 28, E5 | HH 29, E6 | HH 33, E8 | HH 36, E10 |
|---|---|---|---|---|
| Sema3F | 4 | 4 | 3 | 3 |
| Sema3D | 5 | 5 | 4 | 4 |
| Nrp1 | 4 | 4 | 6 | 3 |
| Nrp2 | 5 | 4 | 4 | 3 |
| PlxnA1 | 3 | 6 | 4 | 3 |
With adjacent sections on three sets of slides, three different probes and/or antibodies could be used on the same embryo. Therefore, one embryo may serve as a replicate for up to three labels for any given age. Abbreviations: E, embryonic day; HH, Hamburger Hamilton stage
Cristae, semicircular canals and endolymphatic duct
The expression patterns for Sema3D, Sema3F, Nrp1, Nrp2, and PlxnA1 were similar in each of the cristae (anterior, posterior, and lateral). In figure 2, we show expression patterns in the posterior crista (PCr). The anterior and lateral cristae are not shown.
Figure 2. Semaphorin signaling gene expression in the posterior crista.

(a-t) Horizontal cross sections through the posterior crista (PCr) are shown. Expression patterns for Sema3F, Sema3D, Nrp1, Nrp2, and PlxnA1 in the other two cristae (anterior and lateral, not shown) are similar to the PCr. Tuj1 or Neurofilament associated protein (NF) label vestibular neurites in (a-l). Fluorescent dye labels blood vessels in (i-l). Hematoxylin labels nuclei blue while the cytoplasm is faintly labeled (m-t). Structures and tissue domains are typically labeled in an image when positive for the transcript (Sema3F, Sema3D, Nrp2, and PlxnA1) or protein (Nrp2) of interest (u-v). An exception is that the PCr is labeled in the first row to serve as a guide to the other images in each column. A high magnification image of the PCr shows that Nrp2 and PlxnA1 are strongly expressed in the HC layer of the sensory epithelium (p1, t1).A summary of gene expression in each region is included at the bottom of the figure. The organ diagram (u) is of an E8 PCr and specific regions are color coded. These colors correspond to the same regions listed on the gene summary table (v). The nerve bundle is teal. The sensory domain, which contains both hair cells (HCs) and supporting cells (SCs) after E8, is labeled in yellow. The nonsensory domain containing transitional epithelial cells and dark cells is labeled in green. The remaining nonsensory epithelium is in white. In the tables of this and subsequent figures, red text is used to denote receptors, and bold text is used to denote high levels of expression. Scale bars for a-t are 100 µm Scale bars for p1 and t1 are 50 µm. Abbreviations: A, anterior; ASC, anterior semicircular canal; E, embryonic day; ED, endolymphatic duct; HH, Hamburger Hamilton stage; LSC, lateral semicircular canal; M, medial; Mes; mesenchyme; NB, nerve bundle; NS, nonsensory epithelia; V, vascular tissue.
Sema3F transcripts are weakly expressed in the mesenchyme immediately surrounding the inner ear from E5 to E8 (fig. 2a-c). In the epithelium, Sema3F is weakly expressed in the cristae (fig. 2a) and in the semicircular canals (fig. 2a) at E5. At E6 and E8, faint Sema3F flanks the cristae (fig. 2b-c). By E10, Sema3F is no longer expressed in the epithelium (fig. 2d).
Sema3D expression is clearly distinct from, and stronger than, Sema3F. Sema3D is expressed in the epithelium flanking the cristae (fig. 2 e-g), in the semicircular canals (fig. 2 e-g), in the mesenchyme, and in the endolymphatic duct (fig. 2e-f; duct not shown in E8 image) from E5 to E8. By E10, this pattern has faded and Sema3D is expressed in a tight band (fig. 2h) that lies just beyond the dye-stained vascular tissue surrounding the otic epithelium.
An anti-Nrp1 antibody labels within or near the vascular tissues surrounding the otic epithelium (fig. 2i-l) from E5 to E10. At E8 it is also expressed in the nonsensory epithelium and is strongest flanking the cristae (fig. 2k).
Nrp2 transcripts are expressed in the mesenchyme from E5 through E10. The staining overlaps spatially with vascular tissue surrounding the otic epithelium (fig. 2 i-l, m-p) and is intermingled among neurofilament-labeled axons of the vestibular ganglion (VG) (fig 2 i-l, m-p). At E10, two concentric bands of Nrp2 are found in the mesenchyme: a major band close to the otic epithelium that is superimposed with the vascular dye label and with Nrp1; and a minor band just beyond the vascular tissue that partially overlaps with Sema3D (fig. 2 h, l, & p). At E5-E6, Nrp2 is also found in the semicircular canals (fig. 2 m-n) and the endolymphatic duct (fig. 2 m-n). Nrp2 is expressed in the cristae (fig. 2m-p). At E5 and E6, it is unclear if Nrp2 is expressed by the sensory epithelium or by the neurites innervating it (fig. 2 m-n). At E8 and E10, Nrp2 is expressed near the apical surface of the epithelium, where the HCs reside (fig. 2 o-p1).
PlxnA1 is strongly expressed in the mesenchyme and otic epithelium at E5 and E6 (fig. 2 q-r), including in the endolymphatic duct (fig. 2 q-r). After E6, PlxnA1 decreases in both the mesenchyme and epithelium and becomes more specific. At E8 and E10, PlxnA1 is strongly expressed in the epithelium flanking the innervated cristae (fig. 2 s-t). At these ages, it is also expressed on the apical sensory epithelium, among the HCs (fig. 2 s-t1) and in the vascular tissue (fig. 2s-t). PlxnA1 is also found in the nerve bundles beneath the sensory organ (fig. 2 s-t).
Figure 2 u-v summarizes the results for the epithelia of the semicircular canals and the ampullae, as well as the associated nerve bundles innervating the cristae.
Saccule, utricle and vestibular ganglion
Sema3F transcripts are expressed weakly in the nonsensory epithelium of the saccular macula (SM) and utricular macula (UM), as well as in the proximal CD from E5-E8 (fig. 3 a-c). At these ages, it is also expressed weakly in the periotic mesenchyme (fig. 3 a-c). By E10, Sema3F is down-regulated in both the SM, UM, and in the surrounding mesenchyme (fig. 3 d).
Figure 3. Semaphorin signaling gene expression in the saccular macula, utricular macula, and vestibular ganglion.

a-t, Horizontal cross sections through the saccular macula (SM), utricular macula (UM), and vestibular ganglion (VG) are presented. Tuj1 and Neurofilament (NF) antibodies label neural tissue (a-l). Fluorescent dye labels vascularized tissue (i-l). Hematoxylin strongly labels cell nuclei and faintly labels the cytoplasm (m-t). The SM, UM, and VG are labeled in the top row to indicate the location of these structures at each age. Selected positive signals are highlighted by labeling the structure or tissues that the signal occurs in in each image. Circles denote expression in the VG. High magnification of the SM sensory epithelium shows Nrp2 and PlxnA1 strongly expressed in the HC layer. A diagram of the E8 saccule, utricle, and VG (u) as well as a table summarizing gene expression at each age (v) is at the bottom of the figure, with corresponding color schemes. The VG and its neurites are blue. The sensory domain, containing hair cells (HCs) and supporting cells (SCs) at E8 and E10, is yellow for the SM and orange for the UM. Nonsensory epithelium (NS) of the cochlear duct (CD) is green. All other nonsensory epithelium is in white. (a-t) scale bars are 100 µm. p1 and t1 scale bars are 50 µm Abbreviations: A, anterior; E, embryonic day; HH, Hamburger Hamilton stage; M, medial; Mes, mesenchyme; OC, otic capsule; POC, precartilaginous otic capsule; V, vascular tissue.
Sema3D is strongly expressed in the VG from E5-E8 (fig. 3 e-g, circles). It is expressed in the nonsensory cochlea from E5-E8 and in the non-sensory epithelium of the SM and UM at E8 (fig. 3 e-g). By E10, Sema3D is no longer expressed in the VG (data not shown) or the inner ear (fig. 3 h). Sema3D is expressed in the precartilaginous otic capsule at all ages tested and at E5-E8, well beyond the Sema3F-positive loose mesenchyme (fig. 3 e-g). By E10, Sema3D expression also appears as a narrow band on the inner edge of the cartilaginous otic capsule (fig. 3 h).
Nrp1 is expressed in the otic epithelium near the junction of the cochlear and saccular ducts at E5-E6 (fig. 3 i-j). At E5 it overlaps with capillary-rich tissue surrounding the otic epithelium and VG (fig. 3 i). At E6 and later ages, most Nrp1 has faded in the mesenchyme but some blood vessels continue to express it (fig. 3 j-l).
Nrp2 is expressed in the VG at each of the time points we examined (fig. 3 m-o, circles; data not shown for E10). Concurrently, Nrp2 is strongly expressed in the sensory epithelium of the SM and weakly expressed in the sensory UM (fig. 3 m-p). By E10, Nrp2 is present in HCs of the SM and UM (fig. 3 p-p1). We also observed Nrp2 in the tissue surrounding the SM, UM, and VG (fig. 3 m-p). This mesenchymal tissue is traversed by capillaries and neurites, precluding a definitive assignment of the cell type(s) that contribute to the Nrp2 expression in this location.
PlxnA1 is strongly expressed throughout the VG, epithelium, and mesenchyme at E5 (fig. 3q). As embryo age increases, the intensity of expression decreases (fig.3 r-t). At all of the timepoints examined, PlxnA1 is expressed in the VG (fig. 3 q-s, circles, VG for E10 not shown). At E8–10, this expression is localized to the larger (presumed neuronal) cell bodies. In the epithelium at E10, PlxnA1 is most strongly expressed in the sensory epithelia of the SM and the UM (fig. 3 t-t1). In the mesenchyme at E10, PlxnA1 is most intense immediately surrounding the SM and UM (fig 3. t). This tissue is rich in neurites and capillaries, suggesting that PlxnA1 is expressed by the blood vessels and/or the VG neurites.
The major results for the VG and the middle compartments of the inner ear are summarized (fig. 3 u-v).
Lagena
Unlike the UM and SM, Sema3F is strongly expressed from E5-E8 in the sensory epithelium of the lagena macula (LM) (fig. 4 a-c). Additionally, it is weakly expressed in the nonsensory lagenar epithelium (fig. 4 a-c). At E5-E8 it is also in the mesenchyme (fig. 4 a-c). By E10, most of the Sema3F has faded (fig. 4 d).
Figure 4. Semaphorin signaling gene expression in the lagena macula.

a-t, Representative cross sections through the lagena macula (LM) are shown. Neurofilament (NF) and Tuj1 antibodies label neurites while fluorescent dye labels vascular tissue. The LM is labeled for each age in the top row. Selected positive signals are highlighted by labeling the structure or tissue that the signal occurs in. A diagram of the E8 lagena illustrates sensory (yellow) and nonsensory (white) domains of the epithelium (U). The color coding in the diagram corresponds to the same regions in the expression summary table (V). All scale bars are 100 µm. Abbreviations: A, anterior; BV, blood vessel; E, embryonic day; HH, Hamburger Hamilton stage; M, medial; NS, nonsensory epithelium; OC, otic capsule; V, vascular tissue.
Sema3D is expressed in the nonsensory epithelium at E5 and this expression pattern becomes more intense at E6 and E8 (fig. 4 e-g). By E10, Sema3D is no longer expressed in the epithelium (fig. 4 h). At each of the time points we examined, Sema3D was expressed in the mesenchyme. Similar to other sensory organs of the inner ear, by E10, Sema3D is expressed in a tight band just outside of the capillary-rich region (fig. 4h).
Nrp1 is not expressed in the lagenar epithelium. It is seen in a small population of the capillaries surrounding the LM and around larger nearby blood vessels (fig. 4 i-l).
Nrp2 is expressed in the nonsensory epithelium flanking the LM at E5-E6 (fig. 4 m-n). At E8, it is in the LM (fig. 4 o). At each age we examined, Nrp2 is also expressed in the mesenchyme and in the area enriched in capillaries (fig. 4 m-p).
PlxnA1 is strongly expressed throughout the epithelium and in the surrounding mesenchyme at E5 (fig. 4 q). The intensity of PlxnA1 expression decreases with age (fig. 4 q-t). At E8-E10 PlxnA1 is strongly expressed in the sensory epithelium of the LM (fig. s-t).
Figure 4 u-v highlights the major findings for the epithelial tissues of the lagena.
Cochlear duct and auditory ganglion
The auditory component of the inner ear derives from a prosensory domain on the medial wall of the CD that gives rise to the BP. The mature organ differentiates into supporting cells and two types of HCs: tall HCs (homologous to mammalian inner HCs) and short HCs (homologous to mammalian outer HCs). Tall HCs are located on the neural side (anterior-medial half) of the BP and receive dense afferent innervation and sparse efferent innervation. Short HCs are located on the abneural side (posterior-medial half) of the BP and are innervated primarily by efferents and fewer afferents. By E8, HCs are displaced apically into a single row that lies above the supporting cell nuclei (Takasaka & Smith, 1971; Tanaka & Smith, 1978).
For the purposes of this analysis, the nonsensory epithelium of the CD is divided into three domains in radial cross-sections; these domains presage the differentiation of specific cell types described previously (Oesterle et al., 1992). The superior domain gives rise homogene cells and clear cells. The inferior domain includes the future border cells, hyaline cells, vacuole cells and cuboidal cells. Between them on the lateral side of the CD is the primordium of the tegmentum vasculosum.
Sema3F is weakly expressed on the abneural side of the BP (fig. 5 a-b) and in the nonsensory epithelium (fig. 5 a-b) at E5-E6. By E8, Sema3F expression has faded in the epithelium (fig. 5 c). At E10, it is expressed in the supporting cells and HCs in the BP (fig. 5 d-d1) and in the hyaline cells, cuboidal cells, and tegmentum vasculosum of the nonsensory epithelium (fig. 5 d-d1). Sema3F is also weakly expressed in the periotic mesenchyme at each age we examined (fig. 5 a-d1). At E10, Sema3F is also observed at the periphery of the cartilaginous otic capsule (fig. 5 d).
Figure 5. Semaphorin signaling gene expression in the cochlear duct, basilar papilla, and auditory ganglion.

(a-t) This orientation slices through the auditory ganglion (AG) and provides radial cross-sections through the cochlear duct, and its sensory organ, the basilar papilla (BP). Neurites are labeled with antibodies against Neurofilament (NF) and Tuj1. Vascular tissue is detected with a fluorescent dye. Structures and tissue expressing the gene of interest are labeled in each image and the BP and AG are labeled in the top row to indicate their location at each age. (u-v) The cartoon image supports the table summarizing gene expression domains in the epithelium. The nonsensory epithelium (NS) includes the primordia of the tegmentum vasculosum (Tg, peach in U-V), cuboidal cells (Cu, green in U-V), and hyaline cells (Hy, green in U-V). All scale bars are 100 µm. Abbreviations: Ab, abneural side; A, anterior; E, embryonic day; HC, hair cell layer; HH, Hamburger Hamilton stage; M, medial; N, neural side; NB, nerve bundle; OC, otic capsule; SC, supporting cell layer; V, vascular tissue.
Sema3D is expressed throughout the prosensory domain of the BP (fig. 5 e-h1) from E5-E10. Note that the abneural side of the BP therefore expresses both Sema3D and Sema3F at E5-E6, whereas neurites approaching the neural side would encounter only one of these two potentially repulsive cues. At all ages examined, Sema3D is present in the primordium of the tegmentum vasculosum (fig. 5 e-h), with a particularly strong band seen at E8. At E10, Sema3D is expressed in the supporting cells and HCs of the BP (fig. 5 h-h1). This expression appears to be highest on the abneural side. Sema3D is also expressed in the mesenchyme at each of the ages examined. Sema3D in the periotic mesenchyme is adjacent to the Sema3F expression domains described above.
Nrp1 is expressed in the capillary-rich region surrounding the cochlea at each of the timepoints examined (fig. 5 i-l1). This overlaps with Sema3F expression and lies adjacent to Sema3D expressed in the mesenchyme surrounding the cochlea (described above). Nrp1 is also expressed in the presumptive cuboidal cells of the nonsensory epithelium of the cochlea (fig. 5 i-l1). This Nrp1 domain is adjacent to Sema3D expressed in the primordial tegmentum vasculosum and overlaps Sema3F expressed in the nonsensory epithelium.
Nrp2 is strongly expressed on the abneural side of the BP at E5 and E6 (fig. 5 m-n). At E8 and E10, its expression is barely detectable in the BP. In the nonsensory epithelium, Nrp2 is expressed by the cuboidal cell domain at E10 (fig. 5 p). In the auditory ganglion, Nrp2 is expressed from E5 to E10 (fig. 5 m-p). In the mesenchyme, it is expressed at all timepoints, where it overlaps with the vascular tissue surrounding the CD (fig. 5 m-p; compare to green signal in Fig. 5 i-l). Nrp2 expression is intermingled with neurites that lie beneath the sensory epithelium (fig. 5 m-p1).
PlxnA1 is strongly expressed throughout the CD and periotic mesenchyme at E5 (fig. 5 q). As development progresses, the intensity of this expression decreases and the signal restricts to certain domains. At each age, PlxnA1 is strongly expressed by the BP (fig. 5 q-t1). At E8-E10, this sensory expression is strongest in the HC layer (fig. 5 t1). At E10, HCs on the abneural side express higher levels of PlxnA1 than the neural side, especially at the base of the HCs. In the auditory ganglion, PlxnA1 is strongly expressed from E5 to E10 (fig. 5 q-t). At E8 and E10, PlxnA1 localizes to the cell bodies of the auditory ganglion neurons.
Figure 5 u-v highlights expression data for the auditory ganglion, the two radial halves (neural and abneural) of the BP, and three distinct non-sensory domains of the CD.
Discussion
Sema3D and Nrp2 are downstream of Wnt9a
We began our investigation by following up on the expression patterns of axon guidance factors, Sema3D and Nrp2, that were differentially expressed in uninfected control and Wnt9a-overexpressing BPs (Munnamalai et al., 2017). Given that Sema3F has been previously reported to have asymmetric expression across the radial axis of the mouse organ of Corti (present abneurally) and has a repulsive effect on type I afferents in the mouse (Coate et al., 2015), we expected to find a homologous expression pattern in the chicken cochlea. Indeed, while its expression is weak, Sema3F is confined to the abneural side of the BP on E5-E6 (fig. 1 b-c). However, we also expected Sema3D to show a similar distribution to Sema3F, and that Nrp2 would be in cochlear ganglion neurons. We further hypothesized that the down regulation of both genes in the presence of exogenous Wnt9a contributed to the increase in afferent innervation previously described (Munnamalai et al., 2017). In accordance with our RNA sequencing data, in situ hybridization shows a severe reduction of both Sema3D and Nrp2 in Wnt9a-infected BPs (fig. 1 e, g). And yet, endogenous Sema3D is not restricted to the abneural-side but is expressed across the width of the prosensory domain (fig. 1d). Meanwhile, Nrp2 is endogenously expressed in the ganglion (as expected) but is also in the epithelium on the abneural side of the CD (fig. 1f). Given these results, we suggest two possibilities: 1) the abneural side requires both Sema3D and Sema3F to effectively repel afferents; or 2) Sema3D and Nrp2 are not involved in directing the radial patterning of afferents in the BP through a repulsive mechanism.
To get a better sense of the role these genes play in the developing inner ear, we examined the expression of several other Semaphorin signaling genes (Sema3F, Nrp1, and PlxnA1) in the inner ear across several time points (E5, E6, E8, E10). In the sections below, we describe how these genes have appropriate spatiotemporal expression patterns to impact innervation, synaptogenesis, endothelial cell migration, boundary formation, and development of vestibular dark cells.
Sema signaling genes in the ganglia suggest a role in innervation
The receptors, PlxnA1 and Nrp2, are both expressed in the auditory ganglion (fig. 5 m-t, and the VG (fig. 3 m-o, q-s, v) at E5 through E10 (VG for E10 not shown). These receptors are also observed in the nerve bundles and in the sensory domains of the auditory and vestibular organs (fig. 2–5, v). Given that RNAscope in situ hybridization is sensitive enough to detect mRNAs localized to axons (Baleriola et al., 2015), it is difficult to distinguish if these mRNAs are expressed by the sensory epithelium or the neurites innervating that tissue. Given that there are countless examples of Semaphorin signaling genes acting in axon guidance, as reviewed by Derijck et al. (2010) and Nakamura et al. (2000), it is possible that the PlxnA1 and Nrp2 receptors expressed the ganglia and their projections may be involved in pathfinding of the peripheral processes of these sensory axons.
The ligands encoded by Sema3D and Sema3F are expressed in the non-sensory epithelial domains flanking the cristae (fig. 2 b-c & e-g, v) and saccular macula (SM) (fig. 3 a-c, e-g, v). At the same time, Sema3D is expressed in the prosensory domain of the BP (fig. 5 e-H1). It is tempting to speculate that Nrp2- and PlxnA1-positive neurites from the VG are averted from the nonsensory epithelia of the vestibular organs and from the sensory BP by Sema ligands. One caveat to this theory is that Nrp2 and PlxnA1 are also expressed in the auditory ganglion (fig. 5 v) and these neurons are able to innervate the prosensory domain of the BP despite the Sema3D expressed there. This raises the question: why would Nrp2- and PlxnA1-expressing neurites in the VG respond to Sema3D in the BP, while auditory ganglion neurites expressing the same receptors do not? Various Sema receptors and co-receptors can form receptor complexes with one another. The composition of these holoreceptors impacts their affinity for specific ligands, intracellular signaling events, and the functional outcome of signaling (Zhou et al., 2008). It is possible that there is another receptor we did not test in either the vestibular or auditory neurites that alters their response to Sema3D or Sema3F.
Semaphorin signaling genes in the hair cells suggest a role in synaptogenesis
Semaphorins and their receptors have previously been shown to impact synapse formation as well as synaptic maintenance and elimination in the CNS (Tillo et al., 2012). Some reports found that Semaphorins promote synapse and dendritic spine formation (Laht et al., 2015; Morita et al., 2006) as well as clustering of pre- and post-synaptic markers (Morita et al., 2006). Conversely, other reports have found that Semaphorins inhibit dendritic spine formation and promote synapse elimination (Bouzioukh et al., 2006; Duan et al., 2014; Laht et al., 2015; Paradis et al., 2007; Tran et al., 2009). Semaphorin regulation (promotion or inhibition) of synaptogenesis and synaptic maintenance may depend on the specific ligand, receptors, and co-receptors involved as well as the function (excitatory or inhibitory) of the synapse.
Nrp2 and PlxnA1 are expressed in the HCs of the cristae (fig. 2o-p, s-t, v) and SM (fig. 3 o-p, t,v). In the BP, Sema3F, Sema3D, and PlxnA1 are expressed in the HCs (fig. 5 d1, h1, & t1) at E10. PlxnA1 transcripts are distributed along the apical surface of the HCs across the radial axis, while HCs on the abneural side of the BP have more PlxnA1 at the base of the HCs compared to those on the neural side (fig. 5 t1). From these data, it is difficult to distinguish if PlxnA1 is expressed by the base of the HCs or by the efferent terminals, but in either case, it may influence synaptogenesis from either the pre- or the post-synaptic sides. Sema3D is more strongly expressed by the HCs of the abneural side (fig. 5 h1) while Sema3F is expressed in HCs more uniformly across the radial axis (fig. 5 d1).
Afferents and efferents synapse onto vestibular HCs at approximately E6 (Ginzberg & Gilula, 1980) and E10 (Meza & Hinojosa, 1987), respectively. Nrp2 in the HCs of the cristae and SM may be involved in synaptogenesis, although neither of the Sema ligands examined seem to be present at these time points. Afferents and efferents synapse onto BP HCs at approximately E8–9 (Whitehead & Morest, 1985) and E14 (Rebillard & Pujol, 1983), respectively. Based on the timing of the expression we observe, Sema3D, Sema3F, and PlxnA1 may be involved in synapse formation in the BP. Neuronal cell adhesion molecule (NrCAM) has been shown to associate with Nrp2 (Julien et al., 2005) and recent work in the mouse inner ear has shown that it is involved in limiting ribbon synapses in the HCs, likely through inhibiting synapse formation or promoting pruning (Harley et al., 2018). RNA sequencing data failed to detect NrCAM transcripts in the chicken BP at E6 (Munnamalai et al., 2017), although this time point precedes synapse formation in this organ.
The presence of Semaphorin signaling genes in the mesenchyme suggest a role in endothelial migration
While Sema signaling is most commonly associated with its role in axon guidance, it can also have effects on endothelial cell migration (Hamm et al., 2016; Serini et al., 2003), vasculogenesis (Bates et al., 2003; Serini et al., 2003), vascular patterning (Fiore et al., 2005), and tumor angiogenesis (Kessler et al., 2004; Serini et al., 2003). Semaphorins can impact blood vessels by repelling Nrp- or Plxn-expressing blood vessels (Bates et al., 2003), blocking the effects of vascular endothelial growth factor (VEGF) (Bagnard et al., 2001; Miao et al., 1999), or regulating endothelial cell responsiveness to integrins (Serini et al., 2003). In the inner ear, Nrp1 conditional knock out mice had enlarged vessels in the stria vascularis (homologous to avian tegmentum vasculosum) (Salehi et al., 2017). In the context of this literature, it is interesting to find Semaphorin signaling genes in the periotic mesenchyme of the inner ear. Nrp1 and Nrp2 are localizing to the dye-filled blood vessels (fig. 2–5, i-l, m-p). In the vestibular organs, a tight band of Sema3D is expressed in the mesenchyme immediately adjacent to the vascular tissue surrounding the epithelium of the cristae (fig. 2h, open arrows), SM (fig. 3h, closed arrowhead), and LM (fig. 4h, closed arrowhead). One possibility is that this pattern of Sema3D channels or maintains these blood vessels in close proximity to the inner ear.
In the mesenchyme surrounding the cochlear duct, another interesting pattern is observed. There is a Nrp1-positive patch of cells extending from a blood vessel (not shown in images) to the abneural side of the CD (fig. 5, i-l). These Nrp1-positive cells are rich in vasculature and also express Nrp2 after E8 (fig. 5, o-p). This band of Nrp1 positive cells is immediately flanked by Sema3D in the mesenchyme. We speculate that these Nrp1- and Nrp2-expressing cells are migrating endothelial cells and are channeled to their proper location surrounding the inner ear by the repulsive cue, Sema3D.
Semaphorin signaling genes in the non-sensory epithelium of the cochlear duct may influence boundary formation
Previous work in zebrafish has examined Semaphorins in hindbrain boundary formation and maintenance. In zebrafish, sema4D is expressed at the rhombomere boundaries of the developing hindbrain. When sema4D was knocked down using morpholinos, the expression of odd-numbered rhombomere markers, wnt1 and epha4a, as well as hindbrain marker, foxb1.2, increased; however, the localization of these markers did not change. Malformations of the hindbrain were also observed in sema4d morphants (Yang et al., 2013). Sema3fb and sema3gb are also expressed at the hindbrain rhombomere boundaries. When Terriente and colleagues knocked down sema3fb and sema3gb or nrp2a using morpholinos, they found reduced clustering of fgf20a-expressing neurons in the rhombomeres (Terriente et al., 2012). The authors propose a model in which fgf20a-expressing neurons also express the nrp2a receptor and are restricted from migrating away from the center of the rhombomere by repulsive sema3fb and sema3gb at the rhombomere boundaries.
Expression patterns identified in this paper suggest that Sema signaling may also be involved in restricting cell migration or mixing at boundaries in the CD. At each of the ages we examined, Sema3D is expressed by the future tegmentum vasculosum (fig. 5 e-h, v) while Nrp1 is strongly expressed by the cuboidal cell domain adjacent to the abneural edge of the BP (fig. 5 i-l, v). Nrp2 and Sema3F are also weakly expressed in the future cuboidal cell at E5-E8 (fig. 5 a-c, m-o, v). At E10, the expression of these genes increases, but Sema3F spreads to the tegmentum vasculosum as well. PlxnA2 is weakly expressed throughout the entire nonsensory epithelium (fig. 5 q-t, v). We speculate that, in the CD, Sema3D expressed in the future tegmentum vasculosum repels Nrp1-expressing cuboidal cells. This would create or maintain a boundary between these two regions, allowing them to differentiate appropriately.
Semaphorin signaling genes in the vestibular dark cells suggest role in producing endolymph and Meniere’s disease
Vestibular dark cells flanking the vestibular sensory organs function in maintaining proper endolymph composition by transporting potassium into the endolymph (Kimura, 1969; Wangemann, 1995). Individuals diagnosed with Meniere’s disease may experience vertigo and endolymphatic hydrops (Hallpike & Cairns, 1938). When Masutani and colleagues examined the histology of ampulla sections from patients with hydrops diagnosed with Meniere’s disease, they found a significant decrease in the number of dark cells compared to controls. Many of the dark cells in the Meniere’s disease samples also displayed a swollen cytoplasm and displacement of the nucleus. These observed changes in the dark cells in patients diagnosed with Meiners’s disease suggest that they are involved in Meniere’s disease pathology (Masutani et al., 1992).
In our expression data, we found Sema3D to be expressed in the non-sensory epithelium flanking the sensory cristae (fig. 2 e-g) in the location where dark cells reside. Given that a rare missense mutation in Sema3D was recently identified in patients from the same family diagnosed with Meniere’s disease (Martín-Sierra et al., 2016), we speculate that Sema3D is necessary for the proper development or maintenance of vestibular dark cells near the cristae and that the mutation of Sema3D may contribute to some of the symptoms observed in Meniere’s disease (J. A. Lopez-Escamez, personal communication).
Acknowledgements
This work was supported by the National Institute of Deafness and Communication Disorders (Grant NIH R01DC002756 to DMF and Grant NIH F31DC015946 to MKS). We thank Alix Bikker and Lucas Mondo for their technical assistance. We thank Gaby Sincich for providing the artwork for our figures.
References
- Adam J, Myat A, Le Roux I, Eddison M, Henrique D, Ish-Horowicz D, & Lewis J (1998). Cell fate choices and the expression of Notch, Delta and Serrate homologues in the chick inner ear: parallels with Drosophila sense-organ development. Development, 125, 4645–4654. [DOI] [PubMed] [Google Scholar]
- Appler JM, & Goodrich LV (2011). Connecting the ear to the brain: Molecular mechanisms of auditory circuit assembly. Progress in Neurobiology, 93(4), 488–508. doi: 10.1016/j.pneurobio.2011.01.004 [DOI] [PMC free article] [PubMed] [Google Scholar]
- Bagnard D, Vaillant C, Khuth ST, Dufay N, Lohrum M, Puschel AW, Belin MF, Bolz J, & Thomasset N (2001). Semaphorin 3A-vascular endothelial growth factor-165 balance mediates migration and apoptosis of neural progenitor cells by the recruitment of shared receptor. Journal of Neuroscience, 21(10), 3332–3341. [DOI] [PMC free article] [PubMed] [Google Scholar]
- Baleriola J, Jean Y, Troy C, & Hengst U (2015). Detection of Axonally Localized mRNAs in Brain Sections Using High-Resolution In Situ Hybridization. Jove-Journal Of Visualized Experiments, 2015(100). doi: 10.3791/52799 [DOI] [PMC free article] [PubMed] [Google Scholar]
- Bao ZZ, & Jin Z (2006). Sema3D and Sema7A have distinct expression patterns in chick embryonic development. Developmental Dynamics, 235(8), 2282–2289. doi: 10.1002/dvdy.20882 [DOI] [PMC free article] [PubMed] [Google Scholar]
- Bates D, Taylor GI, Minichiello J, Farlie P, Cichowitz A, Watson N, Klagsbrun M, Mamluk R, & Newgreen DF (2003). Neurovascular congruence results from a shared patterning mechanism that utilizes Semaphorin3A and Neuropilin- 1. Developmental Biology, 255(1), 77–98. [DOI] [PubMed] [Google Scholar]
- Battisti AC, Fantetti KN, Moyers BA, & Fekete DM (2014). A subset of chicken statoacoustic ganglion neurites are repelled by Slit1 and Slit2. Hear Res, 310, 1–12. doi: 10.1016/j.heares.2014.01.003 [DOI] [PMC free article] [PubMed] [Google Scholar]
- Bouzioukh F, Daoudal G, Falk J, Debanne D, Rougon G, & Castellani V (2006). Semaphorin3A regulates synaptic function of differentiated hippocampal neurons. European Journal of Neuroscience, 23(9), 2247–2254. doi: 10.1111/j.1460-9568.2006.04783.x [DOI] [PubMed] [Google Scholar]
- Coate TM, Spita NA, Zhang KD, Isgrig KT, & Kelley MW (2015). Neuropilin-2/Semaphorin-3F-mediated repulsion promotes inner hair cell innervation by spiral ganglion neurons. Elife, 4. doi: 10.7554/eLife.07830 [DOI] [PMC free article] [PubMed] [Google Scholar]
- Defourny J, Poirrier A-L, Lallemend F, Sánchez SM, Neef J, Vanderhaeghen P, Soriano E, Peuckert C, Kullander K, & Fritzsch B, Nguyen L, Moonen G, Moser T, Malgrange B (2013). Ephrin-A5/EphA4 signalling controls specific afferent targeting to cochlear hair cells 4, 1438. [DOI] [PubMed] [Google Scholar]
- Derijck AA, Van Erp S, & Pasterkamp RJ (2010). Semaphorin signaling: molecular switches at the midline. Trends in Cell Biology, 20(9), 568–576. doi: 10.1016/j.tcb.2010.06.007 [DOI] [PubMed] [Google Scholar]
- Duan Y, Wang SH, Song J, Mironova Y, Ming GL, Kolodkin AL, & Giger RJ (2014). Semaphorin 5A inhibits synaptogenesis in early postnatal- and adult-born hippocampal dentate granule cells. Elife, 3. doi: 10.7554/eLife.04390 [DOI] [PMC free article] [PubMed] [Google Scholar]
- Fantetti KN (2011). Responsiveness of chick statoacoustic ganglion neurons to morphogens: Purdue University. [Google Scholar]
- Fantetti KN, Zou Y, & Fekete DM (2011). Wnts and Wnt inhibitors do not influence axon outgrowth from chicken statoacoustic ganglion neurons. Hear Res, 278(1–2), 86–95. doi:S0378-5955(11)00106-7[pii]10.1016/j.heares.2011.04.005 [DOI] [PMC free article] [PubMed] [Google Scholar]
- Fekete DM, & Campero AM (2007). Axon guidance in the inner ear. International Journal of Developmental Biology, 51(6–7), 549–556. doi:072341df[pii]10.1387/ijdb.072341df [DOI] [PubMed] [Google Scholar]
- Fiore R, Rahim B, Christoffels VM, Moorman AF, & Puschel AW (2005). Inactivation of the Sema5a gene results in embryonic lethality and defective remodeling of the cranial vascular system. Molecular and Cellular Biology, 25(6), 2310–2319. doi: 10.1128/mcb.25.6.2310-2319.2005 [DOI] [PMC free article] [PubMed] [Google Scholar]
- Frank MM, & Goodrich LV (2018). Talking back: Development of the olivocochlear efferent system e324. [DOI] [PMC free article] [PubMed] [Google Scholar]
- Ghimire SR, Ratzan EM, & Deans MRJD (2018). A non-autonomous function of the core PCP protein VANGL2 directs peripheral axon turning in the developing cochlea 145(12), dev159012. [DOI] [PMC free article] [PubMed] [Google Scholar]
- Ginzberg RD, & Gilula NB (1980). Synaptogenesis in the vestibular sensory epithelium of the chick embryo. Journal of Neurocytology, 9(3), 405–424. [DOI] [PubMed] [Google Scholar]
- Hallpike CS, & Cairns H (1938). Observations on the Pathology of Ménière’s Syndrome. The Journal of Laryngology & Otology, 53(10), 625–655. doi: 10.1017/S0022215100003947 [DOI] [PMC free article] [PubMed] [Google Scholar]
- Hamburger V, & Hamilton HL (1951). A series of normal stages in the development of the chick embryo. Journal of Morphology, 88, 49–91. [PubMed] [Google Scholar]
- Hamm MJ, Kirchmaier BC, & Herzog W (2016). Sema3d controls collective endothelial cell migration by distinct mechanisms via Nrp1 and PlxnD1. The Journal of Cell Biology, 215(3), 415–430. doi: 10.1083/jcb.201603100 [DOI] [PMC free article] [PubMed] [Google Scholar]
- Harley RJ, Murdy JP, Wang Z, Kelly MC, Ropp TJF, Park SH, Maness PF, Manis PB, & Coate TMJDD (2018). Neuronal cell adhesion molecule (NrCAM) is expressed by sensory cells in the cochlea and is necessary for proper cochlear innervation and sensory domain patterning during development. [DOI] [PMC free article] [PubMed] [Google Scholar]
- Hartmann C, & Tabin CJ (2001). Wnt-14 plays a pivotal role in inducing synovial joint formation in the developing appendicular skeleton. Cell, 104(3), 341–351. [DOI] [PubMed] [Google Scholar]
- Jin Z, Chau MD, & Bao ZZ (2006). Sema3D, Sema3F, and Sema5A are expressed in overlapping and distinct patterns in chick embryonic heart. Developmental Dynamics, 235(1), 163–169. doi: 10.1002/dvdy.20614 [DOI] [PMC free article] [PubMed] [Google Scholar]
- Julien F, Bechara A, Fiore R, Nawabi H, Zhou H, Hoyo-Becerra C, Bozon M, Rougon G, Grumet M, Püschel AW, Sanes JR, & Castellani V (2005). Dual Functional Activity of Semaphorin 3B Is Required for Positioning the Anterior Commissure. Neuron, 48(1), 63–75. doi: 10.1016/j.neuron.2005.08.033 [DOI] [PubMed] [Google Scholar]
- Kessler O, Shraga-Heled N, Lange T, Gutmann-Raviv N, Sabo E, Baruch L, Machluf M, & Neufeld G (2004). Semaphorin-3F is an inhibitor of tumor angiogenesis. Cancer Research, 64(3), 1008–1015. [DOI] [PubMed] [Google Scholar]
- Kimura RS (1969). Distribution, Structure, and Function of Dark Cells in the Vestibular Labyrinth. Annals of Otology, Rhinology & Laryngology, 78(3), 542–561. doi: 10.1177/000348946907800311 [DOI] [PubMed] [Google Scholar]
- Laht P, Tammaru E, Otsus M, Rohtla J, Tiismus L, & Veske A (2015). Plexin-B3 suppresses excitatory and promotes inhibitory synapse formation in rat hippocampal neurons. Experimental Cell Research, 335(2), 269–278. doi: 10.1016/j.yexcr.2015.05.007 [DOI] [PubMed] [Google Scholar]
- Lewis ER, Leverenz EL, & Bialek WS (1985). The vertebrate inner ear: CRC PressI Llc. [Google Scholar]
- Martín-Sierra C, Gallego-Martinez A, Requena T, Frejo L, Batuecas-Caletrío A, & Lopez-Escamez JA (2016). Variable expressivity and genetic heterogeneity involving DPT and SEMA3D genes in autosomal dominant familial Meniere’s disease. European Journal of Human Genetics, 25, 200. doi:10.1038/ejhg.2016.154 10.1038/ejhg.2016.154https://www.nature.com/articles/ejhg2016154#supplementary-informationhttps://www.nature.com/articles/ejhg2016154#supplementary-information [DOI] [PMC free article] [PubMed] [Google Scholar]
- Masutani H, Takahashi H, & Sando I (1992). Dark Cell Pathology in Meniere’s Disease. Acta Otolaryngol, 112(3), 479–485. doi: 10.3109/00016489209137429 [DOI] [PubMed] [Google Scholar]
- Meza G, & Hinojosa R (1987). Ontogenetic approach to cellular localization of neurotransmitters in the chick vestibule. Hear Res, 28(1), 73–85. [DOI] [PubMed] [Google Scholar]
- Miao HQ, Soker S, Feiner L, Alonso JL, Raper JA, & Klagsbrun M (1999). Neuropilin-1 mediates collapsin-1/semaphorin III inhibition of endothelial cell motility: functional competition of collapsin-1 and vascular endothelial growth factor-165. Journal of Cell Biology, 146(1), 233–242. [DOI] [PMC free article] [PubMed] [Google Scholar]
- Molea D, Stone JS, & Rubel E. W. J. J. o. C. N. (1999). Class III β‐tubulin expression in sensory and nonsensory regions of the developing avian inner ear 406(2), 183–198. [PubMed] [Google Scholar]
- Moret F, Renaudot C, Bozon M, & Castellani V (2007). Semaphorin and neuropilin co-expression in motoneurons sets axon sensitivity to environmental semaphorin sources during motor axon pathfinding. Development, 134(24), 4491. [DOI] [PubMed] [Google Scholar]
- Morgan BA, & Fekete DM (1996). Manipulating gene expression with replication-competent retroviruses. Methods Cell Biol, 51, 185–218. [DOI] [PubMed] [Google Scholar]
- Morita A, Yamashita N, Sasaki Y, Uchida Y, Nakajima O, Nakamura F, Yagi T, Taniguchi M, Usui H, Katoh-Semba R, Takei K, & Goshima Y (2006). Regulation of Dendritic Branching and Spine Maturation by Semaphorin3A-Fyn Signaling. The Journal of Neuroscience, 26(11), 2971. [DOI] [PMC free article] [PubMed] [Google Scholar]
- Munnamalai V, Sienknecht UJ, Duncan RK, Scott MK, Thawani A, Fantetti KN, Atallah NM, Biesemeier DJ, Song KH, Luethy K, Traub E, & Fekete DM (2017). Wnt9a Can Influence Cell Fates and Neural Connectivity across the Radial Axis of the Developing Cochlea. Journal of Neuroscience, 37(37), 8975–8988. doi: 10.1523/jneurosci.1554-17.2017 [DOI] [PMC free article] [PubMed] [Google Scholar]
- Nakamura F, Kalb RG, & Strittmatter SM (2000). Molecular basis of semaphorin-mediated axon guidance. Journal of Neurobiology, 44(2), 219–229. [DOI] [PubMed] [Google Scholar]
- Oesterle EC, Cunningham DE, & Rubel EW (1992). Ultrastructure of hyaline, border, and vacuole cells in chick inner ear. Journal of Comparative Neurology, 318(1), 64–82. [DOI] [PubMed] [Google Scholar]
- Paradis S, Harrar DB, Lin Y, Koon AC, Hauser JL, Griffith EC, Zhu L, Brass LF, Chen C, & Greenberg ME (2007). An RNAi-based approach identifies molecules required for glutamatergic and GABAergic synapse development. Neuron, 53(2), 217–232. doi: 10.1016/j.neuron.2006.12.012 [DOI] [PMC free article] [PubMed] [Google Scholar]
- Perez S, Rebelo S, & Anderson D (1999). Early specification of sensory neuron fate revealed by expression and function of neurogenins in the chick embryo. Development, 126(8), 1715. [DOI] [PubMed] [Google Scholar]
- Potts WM, Olsen M, Boettiger D, & Vogt VM (1987). Epitope mapping of monoclonal antibodies to gag protein p19 of avian sarcoma and leukaemia viruses. Journal of General Virology, 68(Pt 12), 3177–3182. [DOI] [PubMed] [Google Scholar]
- Rebillard M, & Pujol R (1983). Innervation of the chicken basilar papilla during its development. Acta Otolaryngol, 96(5–6), 379–388. [DOI] [PubMed] [Google Scholar]
- Salehi P, Ge MX, Gundimeda U, Michelle Baum L, Lael Cantu H, Lavinsky J, Tao L, Myint A, Cruz C, Wang J, Nikolakopoulou AM, Abdala C, Kelley MW, Ohyama T, Coate TM, & Friedman RA (2017). Role of Neuropilin-1/Semaphorin-3A signaling in the functional and morphological integrity of the cochlea. PLoS Genetics, 13(10), e1007048. doi: 10.1371/journal.pgen.1007048 [DOI] [PMC free article] [PubMed] [Google Scholar]
- Sanchez-Calderon H, Martin-Partido G, & Hidalgo-Sanchez M (2004). Otx2, Gbx2, and Fgf8 expression patterns in the chick developing inner ear and their possible roles in otic specification and early innervation. Gene Expr Patterns, 4(6), 659–669. [DOI] [PubMed] [Google Scholar]
- Sanyas I, Bozon M, Moret F, & Castellani V (2012). Motoneuronal Sema3C is essential for setting stereotyped motor tract positioning in limb-derived chemotropic semaphorins. Development, 139(19), 3633–3643. doi: 10.1242/dev.080051 [DOI] [PubMed] [Google Scholar]
- Serini G, Valdembri D, Zanivan S, Morterra G, Burkhardt C, Caccavari F, Zammataro L, Primo L, Tamagnone L, Logan M, Tessier-Lavigne M, Taniguchi M, Puschel AW, & Bussolino F (2003). Class 3 semaphorins control vascular morphogenesis by inhibiting integrin function. Nature, 424(6947), 391–397. doi: 10.1038/nature01784 [DOI] [PubMed] [Google Scholar]
- Sienknecht UJ, & Fekete DM (2008). Comprehensive Wnt-related gene expression during cochlear duct development in chicken. Journal of Comparative Neurology, 510(4), 378–395. doi: 10.1002/cne.21791 [DOI] [PMC free article] [PubMed] [Google Scholar]
- Sienknecht UJ, & Fekete DM (2009). Mapping of Wnt, frizzled, and Wnt inhibitor gene expression domains in the avian otic primordium. Journal of Comparative Neurology, 517(6), 751–764. doi: 10.1002/cne.22169 [DOI] [PMC free article] [PubMed] [Google Scholar]
- Storey K, Crossley J, De Robertis E, Norris W, & Stern C (1992). Neural induction and regionalisation in the chick embryo. Development, 114(3), 729. [DOI] [PubMed] [Google Scholar]
- Takasaka T, & Smith CA (1971). The structure and innervation of the pigeon’s basilar papilla. J Ultrastruct Res, 35(1), 20–65. [DOI] [PubMed] [Google Scholar]
- Takase Y, Tadokoro R, & Takahashi Y (2013). Low cost labeling with highlighter ink efficiently visualizes developing blood vessels in avian and mouse embryos. Development Growth & Differentiation, 55(9), 792–801. doi: 10.1111/dgd.12106 [DOI] [PubMed] [Google Scholar]
- Tanaka K, & Smith CA (1978). Structure of the chicken’s inner ear: SEM and TEM study. Am J Anat, 153(2), 251–271. [DOI] [PubMed] [Google Scholar]
- Terriente J, Gerety SS, Watanabe-Asaka T, Gonzalez-Quevedo R, & Wilkinson DG (2012). Signalling from hindbrain boundaries regulates neuronal clustering that patterns neurogenesis. Development, 139(16), 2978–2987. doi: 10.1242/dev.080135 [DOI] [PMC free article] [PubMed] [Google Scholar]
- Tillo M, Ruhrberg C, & Mackenzie F (2012). Emerging roles for semaphorins and VEGFs in synaptogenesis and synaptic plasticity. Cell Adh Migr, 6(6), 541–546. doi: 10.4161/cam.22408 [DOI] [PMC free article] [PubMed] [Google Scholar]
- Tran TS, Rubio ME, Clem RL, Johnson D, Case L, Tessier-Lavigne M, Huganir RL, Ginty DD, & Kolodkin AL (2009). Secreted semaphorins control spine distribution and morphogenesis in the postnatal CNS. Nature, 462, 1065. doi:10.1038/nature08628 10.1038/nature08628https://www.nature.com/articles/nature08628#supplementary-informationhttps://www.nature.com/articles/nature08628#supplementary-information [DOI] [PMC free article] [PubMed] [Google Scholar]
- Wangemann P (1995). Comparison of ion transport mechanisms between vestibular dark cells and strial marginal cells. Hearing Research, 90(1), 149–157. doi: 10.1016/0378-5955(95)00157-2 [DOI] [PubMed] [Google Scholar]
- Whitehead MC, & Morest DK (1985). The growth of cochlear fibers and the formation of their synaptic endings in the avian inner ear: A study with the electron microscope. Neuroscience, 14, 277–300. [DOI] [PubMed] [Google Scholar]
- Yang J, Zeng Z, Wei J, Jiang L, Ma Q, Wu M, Huang X, Ye S, Li Y, Ma D,& Gao Q (2013). Sema4d is required for the development of the hindbrain boundary and skeletal muscle in zebrafish. Biochemical and Biophysical Research Communications, 433(2), 213–219. doi: 10.1016/j.bbrc.2013.02.085 [DOI] [PubMed] [Google Scholar]
- Yazdani U, & Terman JR (2006). The semaphorins. Genome Biol, 7(3), 211. doi: 10.1186/gb-2006-7-3-211 [DOI] [PMC free article] [PubMed] [Google Scholar]
- Zhou Y, Gunput RA, & Pasterkamp RJ (2008). Semaphorin signaling: progress made and promises ahead. Trends in Biochemical Sciences, 33(4), 161–170. doi: 10.1016/j.tibs.2008.01.006 [DOI] [PubMed] [Google Scholar]