

Abstract
Liver cancer is one of the most malignant tumors with poor prognosis. Finding molecular markers that can predict prognosis is very important for the treatment of liver cancer. The present research is trying to find a new biomarker for human liver cancer. The analysis of abnormal expression genes and prognosis value on liver cancer by Gene Expression Profiling Interactive Analysis (GEPIA) database, the Pathology Atlas of the Human Protein Atlas (HPA), and Kaplan Meier-plotter (KM plotter), proved that B3GAT3 might be one of the important candidates. Furthermore, we investigated the specific role of B3GAT3 on liver cancer through the transfection of B3GAT3 siRNA in HepG2 cells. The proliferation was detected using CCK8, and migration and invasion were determined using Transwell assay. Our results proved that knockdown of B3GAT3 inhibited the proliferation, migration, and invasion. Moreover, B3GAT3 knockdown inhibited the expression of EMT related proteins, N-cad, Snail, and Twist, while promoting the expression of E-cad, suggesting that B3GAT3 knockdown reversed the EMT process of liver cancer cells. In conclusion, overexpressed B3GAT3 promotes the process of tumor EMT, which is an independent prognostic marker to predict the prognosis of liver cancer and might be a potential new target for liver cancer therapy.
Keywords: B3GAT3, Liver cancer, Prognosis, Proliferation, EMT
1. Introduction
Liver cancer is one of the most malignant tumors in the world with extremely high malignancy and poor prognosis. Although there are many kinds of treatment methods for liver cancer, the therapeutic effect is very limited and does not significantly prolong the survival of patients [1]. Tumor markers refer to a group of substances synthesized, released by the tumor cells, or produced by the response of organisms to the tumor cells in the process of tumorigenesis and proliferation. Its expression level is generally well correlated with the occurrence, development, regression, and recurrence of tumors. Detection of these markers can provide information on early diagnosis, treatment effect, and prognosis of related malignant tumors [2, 3]. At present, the prognosis of liver cancer is still not satisfactory due to the high rate of postoperative recurrence and metastasis. Therefore, finding molecular markers that can guide prognosis is very important for the treatment of liver cancer. The present research is trying to find a new biomarker for human liver cancer.
The protein encoded by Beta-1,3-glucuronyltrans-ferase3 (B3GAT3) operated as a glycosyltransferase to add the final glucuronic acid in the linker region tetrasaccharide, xylose-galactose-galactose-glucuronic acid, which is attached to specific serine residues on core proteins [4, 5]. In the present study, we proved that B3GAT3 was over-expressed and unfavorable to prognosis in liver cancer. B3GAT3 was knocked down in liver cancer cell line HepG2 to investigate its specific role on tumor progression. Our results proved that knockdown of B3GAT3 inhibited the proliferation and metastasis, as well as reversing the epithelial mesenchymal transition (EMT) process. This is the first report of the prognostic value of B3GAT3 in human cancer and its role in tumor progression. These findings suggest that B3GAT3 potentially serves as a novel bio-marker for prognosis and an oncogene in liver cancer progression.
2. Materials and methods
2.1. Expression and survival analysis
The expression and survival analysis of B3GAT3 was performed using online software, Gene Expression Profiling Interactive Analysis (GEPIA)[6]. Liver hepatocellular carcinoma (LIHC) matched the Cancer Genome Atlas (TCGA) normal and Genotype-Tissue Expression (GTEx) data were used for the expression analysis, and log2 (TPM+1) was used for log-scale. Overall survival (OS) and disease free survival (DFS) analysis was performed based on gene expression, using Log-rank test, a.k.a the Mantel–Cox test, for hypothesis test on GEPIA.
The prognostic value of B3GAT3 was also analyzed using other two online dataset, the Pathology Atlas of the Human Protein Atlas (HPA)[7], and Kaplan Meier-plotter (KM plotter) [8]. The Pathology Atlas of HPA is an interactive open-access database containing the mRNA and protein expression data based on the integration of publicly available data from TCGA and data generated within the framework of the HPA[7]. The survival curve of the proteins in patients with the respective cancer types including liver cancer are plotted in best expression cut off. KM plotter database can analyze prognostic values of gene mRNA expressions in five type of cancers, including liver cancer. Samples with gene expression data and prognosis information used in Kaplan Meier-plotter are downloaded from TCGA, EGA, and GEO (Affymetrix microarrays only). In this on line dataset, the hazard ratio (HR) with 95% confidence intervals (95% CI) and P value were calculated [8]. The analysis was performed in best cut off of B3GAT3 expression. The package ‘‘survival’’ is used to calculate and proportional hazard was computed by the ‘‘coxph’’ package as previously reported [9].
2.2. Cell culture and transfection
Human liver cancer cell lines, SMMC-7721, HUH7, HepG2, and Hep3B, were all purchased from the Type Culture Collection of the Chinese Academy of Sciences. DMEM medium supplemented with 10% FBS and 1% penicillin and streptomycin combination was used for cell culture. When it reached approximately 70% confluency, HepG2 cells were transfected with B3GAT3 specific siRNA (si-B3GAT3) or negative control siRNA (si-NC) by Lipo-fectamine 2000. The cells were incubated under normal conditions for 24 h at 37 °C.
2.3. Cell proliferation assay
Cell Counting Kit-8 (CCK-8) assay was used for the detection of cell proliferation. The HepG2 cells were transferred in a 96-well plate at a concentration of 500 cells/ well, and then incubated with 10ml of CCK-8 solutions for 1.5 h. The absorbance was measured at 450 nm on a microplate reader. The OD value was checked every 24 h. Each experiment was performed in triplicate.
2.4. Transwell assay
The migration and invasion of HepG2 was detected using transwell assay. After transfection, cells were transferred into the upper well of transwell chamber (Millipore). For invasion assay, 100 μL matrigel (BD) was added into the upper well, while 500 μL serum-free medium was added into bottom well of transwell chamber. After incubation for 48 h, cells were migrated to the lower chamber and stained with crystal violet for 10 min. Photomicrographs were captured and the number of cells was counted. Each experiment was performed in triplicate.
2.5. Western blot
The total protein was extracted from each sample using RIPA buffer containing protease inhibitors. Sodium dodecyl sulfate-polyacrylamide gel electrophoresis (SDS-PAGE) was used for the separation of protein sample. After being transferred to a PVDF membrane, the sample was blocked with 5% fat-free milk for 1 h, and incubated with primary antibodies for 1 h and with secondary antibodies for 1 h. The primary antibodies, including B3GAT3 (1:500, ab170795, Abcam, United Kingdom), P70 (1:1000, ab109393, Abcam, United Kingdom), E-cad (1:1000, ab40772, Abcam, United Kingdom), N-cad (1:1000, ab18203, Abcam, United Kingdom), Snail (1:2000, ab216347), Abcam, United Kingdom), Twist (1:1000, ab50581, Abcam, United Kingdom), and GAPDH (1:5000, 10494-1-AP, PTG, USA) were used in the present research. HRP sheep anti rabbit/ mouse secondary antibodies (1:5000) were purchased from PTG Company (USA). The blots were visualized using ECL assay. Each experiment was performed in triplicate.
2.6. Statistical analyses
Statistical analysis of results was performed using SPSS 18.0 software. The data were expressed as means ± SD. Student’s t test or One-way ANOVA analysis were used to assess differences between groups. Differences were considered statistically significant for values of P<0.05.
3. Results
3.1. B3GAT3 is upregulated in human liver cancer
To find a new biomarker for human liver cancer, we first investigated the abnormal expression genes in LIHC samples. GEPIA database included 369 LIHC and 160 normal liver tissues, which were used for the expression analysis [6]. From our results, B3GAT3 was observed to be overexpressed in LIHC compared with normal liver tissues, and the boxplot was plotted (Fig. 1, P<0.05). This result suggested that B3GAT3 might play a specific role in human liver cancer.
Figure 1.
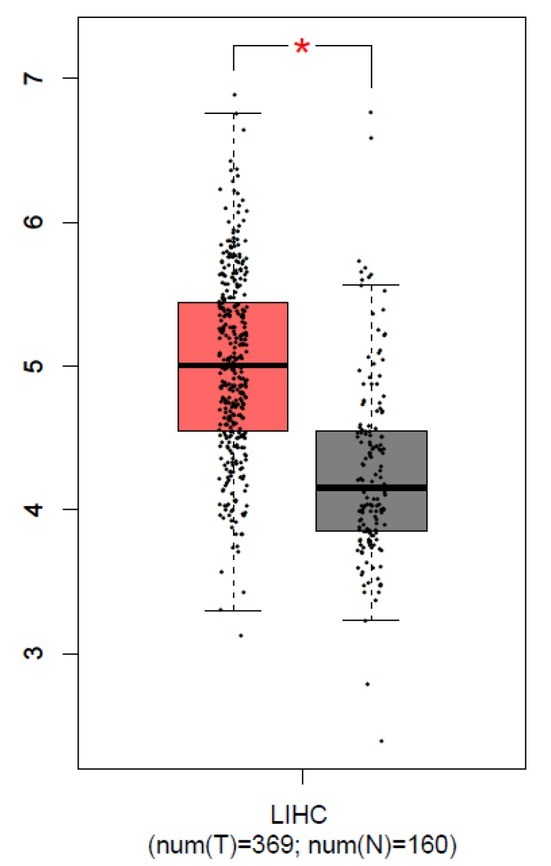
B3GAT3 was up-regulated in human liver cancer. GEPIA was used for the analysis of B3GAT3 expression, and the boxplot was plotted. The red and gray boxes represent LIHC and normal liver tissues respectively. *P<0.05 compared with N. N, normal tissues. T, tumor tissues.
3.2. High B3GAT3 expression was unfavorable for the prognosis in human liver cancer
The prognosis value of B3GAT3 was analyzed using three different online dataset, GEPIA, the pathology atlas of HPA, and KM plotter. Overall survival (OS) and disease free survival (DFS) analysis were performed using GEPIA. As shown in Fig. 2A and B, high B3GAT3 expression was associated with poor OS (P<0.0001) or DFS (P=0.0066) in liver cancer patients. To further confirm the prognosis value of B3GAT3 on liver cancer, we analyzed it in the pathology atlas of HPA. As shown in Fig. 2C, at best expression cut off 21.32%, 144 high B3GAT3 patients showed worse OS compared with 221 low B3GAT3 patients (P<0.0001). KM plotter is an online software specially designed for prognostic analysis, thus we further performed the analysis on which (Affymetrix ID=26229, Fig. 2D). Consistent with the above results, high B3GAT3 indicated poor prognosis in all liver cancer patients at the best expression cutoff, suggesting that it was an unfavorable biomarker for the prognosis in liver cancer (HR=1.67, 95% CI 1.18-2.36, P=0.0034).
Figure 2.
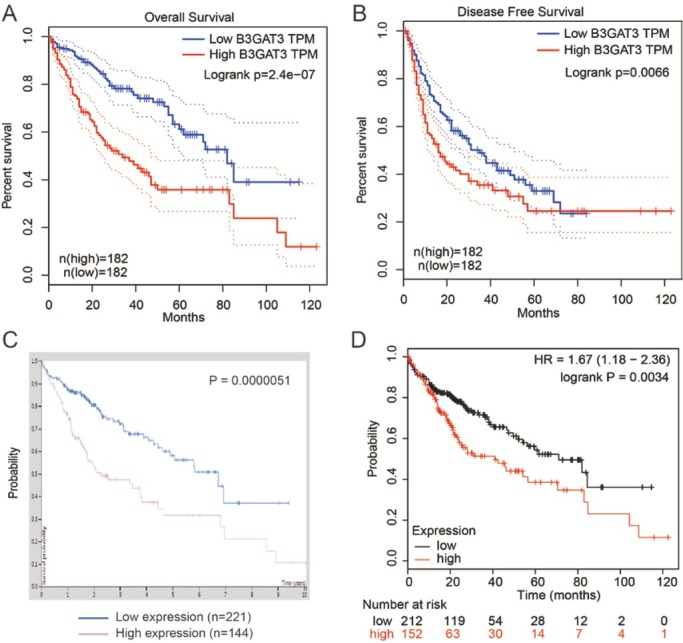
High B3GAT3 expression was unfavorable for the prognosis in human liver cancer. GEPIA was used for the analysis of OS (A) and DFS (B) of patients with differences in B3GAT3 expression level. (C) The human protein atlas was used to analyze the prognostic role of B3GAT3. (D) B3GAT3 prognostic value was also investigated in KM plotter, and the desired Affymetrix IDs was 26229. All the above results showed that high B3GAT3 level was associated with poor prognosis.
3.3. Prognostic role of B3GAT3 in liver cancer patients with different pathological characteristics
Furthermore, we estimated prognostic value of B3GAT3 in liver cancer patients with different pathological characteristics, including clinical stages, pathological grades, gender, alcohol consumption, and hepatitis virus status on KM plotter. As shown in Table 1, high B3GAT3 level was associated to poor OS in stage 1 and 2 liver cancer patients (stage 1: HR=2.73, 95% CI 1.44-5.18, P=0.0014; stage 2: HR=3.11, 95% CI 1.17-8.27, P=0.017). High B3GAT3 level was correlated to grade 2 and 3 patients (grade 2: HR=2, 95% CI 1.16-3.46, P=0.012; grade 3: HR=1.93, 95% CI 1.04-3.59, P=0.034). In both male and female patients, high B3GAT3 expression was observed to be associated to poor prognosis (male: HR=1.96, 95% CI 1.14-3.36, P=0.013; female: HR=1.74, 95% CI 1-3.03, P=0.049). Furthermore, B3GAT3’s high expression was associated to worse OS in patients without alcohol consumption (HR=1.83, 95% CI 1.15-2.9, P=0.0096) or hepatitis virus (HR=2.23, 95% CI 1.26-3.93, P=0.0046). However, high B3GAT3 level was modestly correlated to worse OS in patients with positive alcohol consumption or hepatitis virus status without statistically significant. Taken together, there still requires more clinical case studies to reveal the prognostic role of B3GAT3 in patients with different pathological features of liver cancer.
3.4. B3GAT3 knockdown inhibited the proliferation of liver cancer cells
Then, we detected the expression of B3GAT3 in four liver cancer cell lines, SMMC-7721, HUH7, HepG2, and Hep3B. As shown in Fig. 3A, B3GAT3 level was highest in HepG2 cells. The B3GAT3 knockdown was generated by the transfection of B3GAT3 specific siRNA in HepG2 cell to investigate its role on liver cancer progression (Fig. 3B). The proliferation of HepG2 cells was determined by CCK8 assay. Compared with si-NC cells, the OD value of si-B3GAT3 declined significantly after the transfection for 48 h and 72 h (P<0.05, Fig. 3C). Our data proved that B3GAT3 knock-down inhibited the proliferation of liver cancer cells.
Figure 3.
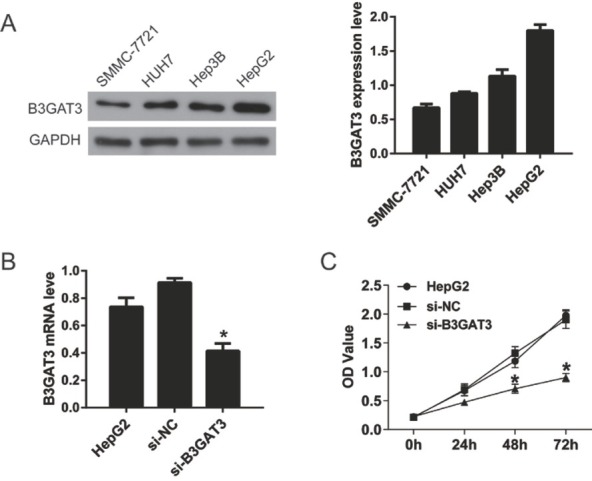
Knockdown of B3GAT3 inhibited the proliferation of liver cancer cells. (A) Western blot was performed to detect the expression of B3GAT3 in four liver cancer cell lines, SMMC-7721, HUH7, Hep3B, and HepG2. Statistical results showed that B3GAT3 expression was highest in HepG2 cells. (B) B3GAT3 was knocked down in HepG2 cells and its mRNA level was detected using qPCR. (C) The proliferation of HepG2 cells was determined by CCK8 assay. *P<0.05 compared with si-NC.
3.5. B3GAT3 knockdown inhibited the migration and invasion of liver cancer cells
Transwell assay was performed to investigate the effect of B3GAT3 on the migration and invasion of HepG2 cells. As shown in Fig. 4A, B3GAT3 knockdown declined the migrated cell number (156±20) in comparison to the si-NC group (336±47) (P<0.05). Moreover, after the transfection of B3GAT3 siRNA, the invasive cell number (52±10) also decreased compared with the si-NC group (193±25) (P<0.05, Fig. 4BFig. 4B). These data suggested that B3GAT3 knockdown suppressed the migration and invasion of liver cancer cells.
Figure 4.
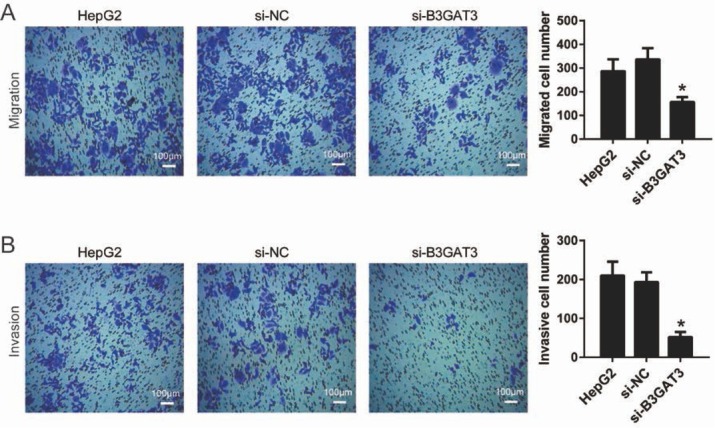
Knockdown of B3GAT3 inhibited the migration and invasion of liver cancer cells. Transwell assay was performed to investigate the effect of B3GAT3 on cell migration (A) and invasion (B). Representative images were captured after the transfection for 48 h. Bar = 100 μm. *P<0.05 compared with si-NC.
3.6. B3GAT3 knockdown reversed the EMT process of liver cancer cells
To elucidate the molecular mechanism of the effect of B3GAT3 on cancer cells, we detected the expression levels of P70 and EMT related genes by western blot (Fig. 5A). P70 is a crucial gene for cell proliferation and up-regulated in most tumors[10]. EMT plays an important role in the motility of tumor cells and is a vital process in the origin and metastasis of solid tumors[11]. As shown in Fig. 5B, the expression of P70 was inhibited after the transfection of B3GAT3 siRNA, suggesting the molecular mechanism of the effect of B3GAT3 on cell proliferation. Furthermore, we proved that B3GAT3 knockdown inhibited the expression of N-cad, Snail, and Twist, and promoted the expression of E-cad. These results demonstrated that the suppression of B3GAT3 reversed the EMT process of liver cancer cells.
Figure 5.
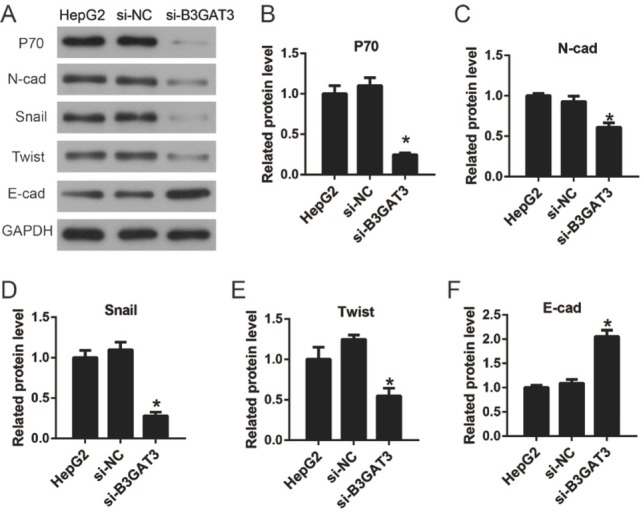
Knockdown of B3GAT3 reversed the EMT process of liver cancer cells. (A) The expression levels of P70 and EMT related genes were detected by western blot. (B-F) The values of the band intensity represent the densitometry estimation of each band normalized to GAPDH. *P<0.05 compared with si-NC.
4. Discussion
In the present study, we proved that B3GAT3 was a new biomarker of prognosis in liver cancer. B3GAT3, also known as GLCATI, is a glycosyltransferase that plays an important role in proteoglycan (PG) biosynthesis[12]. PG is an important and unique family of proteins, and is one of the major components (collagen family, PG, elastin and glycoprotein) that make up the extracellular matrix (ECM), which plays an important role in tumor cell invasion and metastasis[13, 14]. Studies have shown that PG can directly affect the cell cycle[15, 16]. Matrix molecule receptors and proteases, which are highly expressed in tumor cells, are involved in the malignant growth of tumor cells[17, 18]. Among numerous macromolecules involved in the function of tumor cells, PG plays an important role in the formation of neovascularization and the proliferation of malignant cells in tumor tissues[19, 20]. Therefore, we speculate that B3GAT3 may be involved in tumor progression as one of the synthetic enzymes of PG.
In this study, for the first time, we found that B3GAT3 was highly expressed in liver cancer cells through online database analysis, and found that the high expression of B3GAT3 was unfavorable to the prognosis of liver cancer patients through a variety of database analysis. Research shows that transforming growth factor b1 (TGFb1) upregulates the expression of B3GAT3 in lung fibroblasts, and signaling through TGFb1 receptor/p38 MAPK is required for TGFb1-mediated B3GAT3expression in fibroblasts[21, 22]. We speculated that B3GAT3 might be highly expressed through the upregulation of TGFb1 in cancer cells as one of the PG synthases, which required further experimental confirmation.
Next, we estimated prognostic value of B3GAT3 in liver cancer patients with different pathological characteristics. According to our results, high B3GAT3 level was associated to poor OS in stage 1 and 2, grade 2 and 3, male and female patients. Furthermore, B3GAT3’s high expression was associated to worse OS in patients without alcohol consumption or hepatitis virus. However, high B3GAT3 level was modestly correlated to worse OS in patients with positive alcohol consumption or hepatitis virus status without statistically significant. Therefore, we predicted that in patients with alcohol consumption or hepatitis virus, the prognosis might be affected by more factors, thus interfering with the prognostic guidance of B3GAT3 [23, 24]. Taken together, there still requires more clinical case studies to reveal the prognostic role of B3GAT3 in patients with different pathological features of liver cancer.
Then, we found that B3GAT3 knockdown inhibited the proliferation, migration and invasion, and also reversed the EMT process in HepG2 cells. Cell migration is an ubiquitous life phenomenon in organisms and plays a key role in tumor cell invasion and metastasis [25]. By interaction between cells and cells, cells and ECM, cells can migrate depending on the corresponding signals. Studies have shown that the ECM is involved in cell metastasis by limiting and regulating the proliferation and evolution of epithelial cells through physiological and physical actions [26]. At the same time, cells that have undergone EMT secrete large amounts of ECM and related enzymes, which can lead to cell proliferation, morphological changes, and the acquisition of metastasis ability. TGFb, the transcriptional regulator of B3GAT3, is also a potent inducer of EMT [22, 27]. TGFb acts primarily through the β-integrin signaling pathway and promotes Smad3-de-pendent cellular transcriptional processes, as well as through the non-Smad3-dependent P38 MAP kinase and the GTPase-mediated signaling pathways [27, 28]. In fact, in a variety of tumors with high TGFb expression, TGFb can act on both the tumor cells itself in an autocrine form and the extracellular matrix in a paracrine manner [29]. The complex biological interaction between epithelial cells and stromal cells may be an important inducer of EMT, but the specific mechanism is still unclear. Therefore, B3GAT3 may be a key molecule in the TGF/P38MAP/ EMT pathway, and it may become a clinical target in the treatment of tumor metastasis.
In conclusion, B3GAT3 is a good indicator of liver cancer biology. As an independent prognostic marker, it can be used clinically to predict the prognosis of patients with liver cancer. At the same time, B3GAT3 plays an important role in the process of tumor EMT, suggesting that it has the potential to become a new target for targeted therapy of liver cancer.
Footnotes
Conflict of interest: The authors declare no conflict of interest.
Reference
- [1].Bosch FX, Ribes J, Díaz M, Cléries R. Primary liver cancer: Worldwide incidence and trends. Gastroenterology. 2004;127(5):S5. doi: 10.1053/j.gastro.2004.09.011. –. [DOI] [PubMed] [Google Scholar]
- [2].Harris L, Fritsche H, Mennel R, Norton L, Ravdin P, Taube S. American Society of Clinical Oncology 2007 Update of Recommendations for the Use of Tumor Markers in Breast Cancer. Journal of Clinical Oncology Official Journal of the American Society of Clinical Oncology. 2007;25(33):5287. doi: 10.1200/JCO.2007.14.2364. et al. –. [DOI] [PubMed] [Google Scholar]
- [3].Fan B, Xiong B. Investigation of serum tumor markers in the diagnosis of gastric cancer. Hepato-gastroenterology. 2016;58(105):239. [PubMed] [Google Scholar]
- [4].Job F, Mizumoto S, Smith L, Couser N, Brazil A, Saal H. Functional validation of novel compound heterozygous variants in B3GAT3 resulting in severe osteopenia and fractures: expanding the disease phenotype. Bmc Medical Genetics. 2016;17(1):86. doi: 10.1186/s12881-016-0344-9. et al. [DOI] [PMC free article] [PubMed] [Google Scholar]
- [5].Pedersen LC, Tsuchida K, Kitagawa H, Sugahara K, Darden TA, Negishi M. Heparan/chondroitin sulfate biosynthesis. Structure and mechanism of human glucuronyltransferase I. Journal of Biological Chemistry. 2000;275(44):34580. doi: 10.1074/jbc.M007399200. [DOI] [PubMed] [Google Scholar]
- [6].Tang Z, Li C, Kang B, Gao G, Li C, Zhang Z. GEPIA: a web server for cancer and normal gene expression profiling and interactive analyses. Nucleic Acids Research. 2017;45 doi: 10.1093/nar/gkx247. Web Server issue. [DOI] [PMC free article] [PubMed] [Google Scholar]
- [7].Thul PJ, Å L, Wiking M, Mahdessian D, Geladaki A, Ait BH. A subcellular map of the human proteome. Science. 2017;356(6340) doi: 10.1126/science.aal3321. et al. [DOI] [PubMed] [Google Scholar]
- [8].Szász AM, Lánczky A, Nagy Á, Förster S, Hark K, Green JE. Cross-validation of survival associated biomarkers in gastric cancer using transcriptomic data of 1,065 patients. Oncotarget. 2016;7(31):49322. doi: 10.18632/oncotarget.10337. et al. –. [DOI] [PMC free article] [PubMed] [Google Scholar]
- [9].Lánczky A, Nagy Á, Bottai G, Munkácsy G, Szabó A, Santarpia L. miRpower: a web-tool to validate survival-associated miRNAs utilizing expression data from 2178 breast cancer patients. Breast Cancer Res Treat. 2016;160(3):439. doi: 10.1007/s10549-016-4013-7. et al. –. [DOI] [PubMed] [Google Scholar]
- [10].Zhang Z, Lei M, Wu X, Liu G, Peng Y, Xin X. Carnosine Inhibits the Proliferation of Human Gastric Carcinoma Cells by Retarding Akt/mTOR/p70S6K Signaling. Journal of Cancer. 2014;5(5):382. doi: 10.7150/jca.8024. et al. –. [DOI] [PMC free article] [PubMed] [Google Scholar]
- [11].Huang M, Wu S, Hu Q, Wu H, Wei S, Xie H. Agkihpin, a novel SVAE may inhibit the migration and invasion of liver cancer cells associated with the inversion of EMT induced by Wnt/β-catenin signaling inhibition. Biochemical & Biophysical Research Communications. 2016;479(2):283. doi: 10.1016/j.bbrc.2016.09.060. et al. –. [DOI] [PubMed] [Google Scholar]
- [12].Barré L, Venkatesan N, Magdalou J, Netter P, Fournel-Gigleux S, Ouzzine M. Evidence of calcium-dependent pathway in the regulation of human beta1,3-glucuronosyltransferase-1 (GlcAT-I) gene expression: a key enzyme in proteoglycan synthesis. Faseb Journal Official Publication of the Federation of American Societies for Experimental Biology. 2006;20(10):1692. doi: 10.1096/fj.05-5073fje. [DOI] [PubMed] [Google Scholar]
- [13].Wight TN. Versican: a versatile extracellular matrix proteoglycan in cell biology. Current Opinion in Cell Biology. 2002;14(5):617. doi: 10.1016/s0955-0674(02)00375-7. –. [DOI] [PubMed] [Google Scholar]
- [14].Lu P, Weaver VM, Werb Z. The extracellular matrix: A dynamic niche in cancer progression. Journal of Cell Biology. 2012;196(4):395. doi: 10.1083/jcb.201102147. [DOI] [PMC free article] [PubMed] [Google Scholar]
- [15].Katohsemba R, Oohira A. Core proteins of soluble chondroitin sulfate proteoglycans purified from the rat brain block the cell cycle of PC12D cells. Journal of Cellular Physiology. 2010;156(1):17. doi: 10.1002/jcp.1041560104. –. [DOI] [PubMed] [Google Scholar]
- [16].Fedarko NS, Ishihara M, Conrad HE. Control of cell division in hepatoma cells by exogenous heparan sulfate proteoglycan. Journal of Cellular Physiology. 2010;139(2):287. doi: 10.1002/jcp.1041390210. –. [DOI] [PubMed] [Google Scholar]
- [17].Kwon Y, Cukierman E, Godwin AK. Differential Expressions of Adhesive Molecules and Proteases Define Mechanisms of Ovarian Tumor Cell Matrix Penetration/Invasion. Plos One. 2011;6(4):e18872. doi: 10.1371/journal.pone.0018872. [DOI] [PMC free article] [PubMed] [Google Scholar]
- [18].Nagle RB, Knox JD, Wolf C, Bowden GT, Cress AE. Adhesion molecules, extracellular matrix, and proteases in prostate carcinoma. J Cell Biochem Suppl. 1994;19(43):232. –. [PubMed] [Google Scholar]
- [19].Iozzo RV, Sanderson RD. Proteoglycans in cancer biology, tumour microenvironment and angiogenesis. Journal of Cellular & Molecular Medicine. 2011;15(5):1013. doi: 10.1111/j.1582-4934.2010.01236.x. –. [DOI] [PMC free article] [PubMed] [Google Scholar]
- [20].Dreyfuss J. L, Regatieri C. V, Melo G. B. New Approach to Study Choroidal Neovascularization: Correlation of Angiofluoresceinogram and Heparan Sufate Proteoglycans Expression. Invest Ophthalmol Vis Sci. 2008 et al. [Google Scholar]
- [21].Narayanan V, Mohamed O, Martin K, Patrick N, Ludwig MS. Increased deposition of chondroitin/dermatan sulfate glycosaminoglycan and upregulation of β1,3-glucuronosyl-transferase I in pulmonary fibrosis. Am J Physiol Lung Cell Mol Physiol. 2011;300(2):L191. doi: 10.1152/ajplung.00214.2010. [DOI] [PubMed] [Google Scholar]
- [22].Hiyama A, Gogate SS, Gajghate S, Mochida J, Shapiro IM, Risbud MV. BMP-2 and TGF-β stimulate expression of β1,3-glucuronosyl transferase 1 (GlcAT-1) in nucleus pulposus cells through AP1, TonEBP, and Sp1: Role of MAPKs. Journal of Bone & Mineral Research. 2010;25(5):1179. doi: 10.1359/jbmr.091202. –. [DOI] [PMC free article] [PubMed] [Google Scholar]
- [23].Wang H, He L, Dong J. Risk factors affecting the prognosis of primary liver cancer after surgical treatment. Journal of Navy Medicine. 2017 [Google Scholar]
- [24].Xie JG, Hospital WP Suzhou. Analysis of Prognostic Factors in Patients with Primary Liver Cancer after Interventional Therapy. China & Foreign Medical Treatment. 2018 [Google Scholar]
- [25].Oudin MJ, Weaver VM. Physical, Chemical Gradients. in the Tumor Microenvironment Regulate Tumor Cell Invasion, Migration, and Metastasis. Cold Spring Harb Symp Quant Biol. 2016;81(1):189. doi: 10.1101/sqb.2016.81.030817. –. [DOI] [PubMed] [Google Scholar]
- [26].Armstrong SJ, Wiberg M, Terenghi G, Kingham PJ. ECM molecules mediate both Schwann cell proliferation and activation to enhance neurite outgrowth. Tissue Engineering Part A. 2007;13(12):2863. doi: 10.1089/ten.2007.0055. –. [DOI] [PubMed] [Google Scholar]
- [27].Risolino M, Mandia N, Iavarone F, Dardaei L, Longobardi E, Fernandez S. Transcription factor PREP1 induces EMT and metastasis by controlling the TGF-β–SMAD3 pathway in non-small cell lung adenocarcinoma. Proceedings of the National Academy of Sciences. 2014;111(36):E3775. doi: 10.1073/pnas.1407074111. et al. [DOI] [PMC free article] [PubMed] [Google Scholar]
- [28].Yu L, Hébert MC, Zhang YE. TGF‐β receptor‐activated p38 MAP kinase mediates Smad‐independent TGF‐β responses. Embo Journal. 2014;21(14):3749. doi: 10.1093/emboj/cdf366. –. [DOI] [PMC free article] [PubMed] [Google Scholar]
- [29].Zheng G, Lyons JG, Tan TK, Wang Y, Hsu TT, Min D. Disruption of E-Cadherin by Matrix Metalloproteinase Directly Mediates Epithelial-Mesenchymal Transition Downstream of Transforming Growth Factor-β1 in Renal Tubular Epithelial Cells. American Journal of Pathology. 2009;175(2):580. doi: 10.2353/ajpath.2009.080983. et al. –. [DOI] [PMC free article] [PubMed] [Google Scholar]