

Abstract
Objective:
The goal of this study was to investigate the role of leisure time physical activity (LTPA) on the association between sleep quality and the cortisol awakening response (CAR) in people with an occupation that exposes them to high levels of stress.
Methods:
Participants were 275 police officers (age=42 years±8.3, 27% women) enrolled in the Buffalo Cardio-Metabolic Occupational Police Stress (BCOPS) study (conducted between 2004 and 2009). Officers provided four salivary cortisol samples (on awakening and 15, 30, and 45 min after awakening). Hours of leisure time physical activity were assessed using the Seven-Day Physical Activity Recall questionnaire. Sleep quality (good/poor) was evaluated using the Pittsburgh Sleep Quality Index (PSQI) scale. Analysis of covariance and repeated measures models were used to examine the association of sleep quality to the two aspects of CAR: cortisol levels (total area under the curve (AUCG), mean, and peak cortisol) and cortisol profiles (the overall pattern in cortisol level during the 45 min period following awakening, the increase in cortisol from baseline to average of post awakening values (mean increase), and area under the curve with respect to increase (AUCI)). Analyses were stratified by participant level of reported LTPA (sufficiently vs. insufficiently active, defined as ≥ 150 vs. < 150 min/week of moderate intensity activity, respectively). Since cortisol activity is known to be influenced by gender, we conducted additional analyses also stratified by gender.
Results:
Overall, results demonstrated that LTPA significantly moderated the association of sleep quality with CAR. Among participants who were sufficiently active, CAR did not differ by sleep quality. However, in those who were insufficiently active during their leisure time, poor sleep quality was associated with a significantly reduced level of total awakening cortisol secretion (AUCG (a.u.)=777.4 ± 56 vs. 606.5 ± 45, p=0.02; mean cortisol (nmol/l) = 16.7 ± 1.2 vs. 13.3 ± 0.9, p=0.03; peak cortisol (nmol/l)=24.0 ± 1.8 vs. 18.9 ± 1.5, p=0.03 for good vs. poor sleep quality, respectively). The normal rise in cortisol after awakening was also significantly lower in inactive officers with poor sleep quality than in those with good sleep quality (mean increase (nmol/l)=6.7 ± 1.5 vs. 2.3 ± 1.2, p=0.03; AUCI (a.u.)=249.3 ± 55 vs. 83.3 ± 44, p=0.02 for those with good vs. poor sleep quality, respectively). While findings for male officers were consistent with the overall results, CAR did not differ by sleep quality in female officers regardless of LTPA level.
Conclusion:
Findings of this study suggest that poor sleep quality is associated with diminished awakening cortisol levels and dysregulated cortisol patterns over time, but only among officers who were inactive or insufficiently active during their leisure time. In contrast, sleep quality was not associated with any measures of CAR in officers who reported sufficient activity, suggesting a potential protective effect of LTPA. In analyses stratified by gender, findings for male officers were similar to those in the pooled sample, although we found no evidence for a modifying effect of LTPA in women. Future longitudinal studies in a larger population are needed to confirm these findings and further elucidate the relationships between LTPA, sleep quality, and cortisol response.
Keywords: Cortisol awakening response, CAR, Physical activity, Police officers, Pittsburgh Sleep Quality Index, HPA axis
1. Introduction
Poor sleep quality is a serious public health concern in the United States (Colten et al., 2006) and disproportionately affects chronically stressed populations, including those working in law enforcement and other stressful occupations. For example, in a controlled study of 1063 variable and stable shift workers, the prevalence of poor sleep quality was significantly higher among police officers than in those not involved in emergency services (64 vs. 45%, respectively) (Neylan et al., 2002). In a recent study of U.S. and Canadian police officers, 29% reported excessive sleepiness, 26% reported falling asleep while driving at least once in a month, 34% had obstructive sleep apnea, and 40% had at least one sleep disorder (Rajaratnam et al., 2011). Poor sleep quality has been linked to numerous chronic health conditions (Buxton and Marcelli, 2010) and to elevated risk for both fatal and non-fatal injuries (Vila and Kenney, 2002). Poor sleep quality is also thought to promote activation of the autonomic sympathoadrenal system and the hypothalamic-pituitary-adrenal (HPA) axis, the major neuroendocrine stress systems that enable us to deal with everyday challenges (Meerlo et al., 2008). Meerlo et al. contend that sleep deprivation may not only have a direct activating effect by itself but, in the long run, may also affect the reactivity of these systems to other stressors and challenges.
The stress hormone cortisol is the end product of the HPA axis and facilitates the organism’s ability to adjust and adapt to internal and external demands (Fries et al., 2009). The change in cortisol levels follow a circadian rhythm (Clow et al., 2010; Fries et al., 2009) that involves three discrete components: (1) the first phase of cortisol circadian rhythm is the cortisol awakening response (CAR) which is defined as the sharp rise in cortisol levels that occurs immediately after awakening, followed by sharp decline during the next few hours, (2) a gradual decline in cortisol levels during the remainder of the day, reaching the lowest point during the first half of the sleep period (approximately midnight), and (3) an increase in cortisol levels during the second half of the sleep period until waking. A detailed discussion including graphical illustration of these three distinct phases of cortisol circadian rhythm is reported elsewhere (Elder et al., 2014; Debono et al., 2009; Selmaoui and Touitou, 2003; Weitzman et al., 1971). Typically, the CAR is characterized by a rapid increase in cortisol levels that peaks around 30 min post awakening (Clow et al., 2010, 2004; Wust et al., 2000; Fries et al., 2009). During the CAR period, cortisol levels typically increase by 38%–75% relative to the baseline cortisol value at awakening.
The CAR has been extensively used as biomarker of HPA axis sensitivity to stress. As a marker of HPA axis function, CAR is a considered a reliable measure of cumulative or ‘allostatic’ load on the body (Kudielka and Kirschbaum, 2005). For example, aberrant CAR has been linked to cardiovascular disease, susceptibility to infectious diseases, major depression (Kudielka and Kirschbaum, 2005), impaired telomere maintenance (Tromiyam et al., 2012), and psychological stress (Violanti et al., 2017; Duan et al., 2013; Steptoe et al., 2000; Pruessner et al., 1999). In addition, prospective studies have shown CAR to predict psychological health outcomes including peritraumatic dissociation, acute stress disorder, and major depression in police officers and other populations (Vrshek-Schallhorn et al., 2013; Inslicht et al., 2011). This particular measure of HPA axis activity has, therefore, garnered increasing interest as an overarching biomarker for health status and risk for morbidity and mortality. With the advent of convenient home sampling devices, cortisol can be reliably measured in saliva, providing a non-invasive index of HPA activity. Because of the relatively low cost and ease of collection of saliva samples in field settings, salivary CAR is especially relevant in epidemiologic studies of large populations where the use of invasive measures is too costly or impractical to implement. In this context, it is generally agreed that the CAR provides a reliable, non-invasive measure of this hypothalamic adrenocortical activity, especially because it also accurately reflects free cortisol levels (Wust et al., 2000; Pruessner et al., 1997). For these reasons, salivary cortisol measures have been a preferred method of risk assessment in many occupational health studies (Adam and Kumari, 2009; Koh and Koh, 2007; Violanti et al., 2006).
Despite considerable research on causes and correlates of HPA axis activation, there is limited information on the role of HPA axis activity in sleep and specifically, on CAR’s relationship to sleep (Devine and Wolf, 2016; Elder et al., 2014). Systematic reviews of prior epidemiologic and experimental studies that examined the association of sleep measures with CAR reported inconsistent findings (Elder et al., 2014; Garde et al., 2011); both increases and decreases in CAR with poor sleep quality have been reported. One potential reason for variation in findings could be of the failure to consider modifiable lifestyle factors that could play a moderating role. Physical activity is known to improve cardiovascular fitness (Meyers et al., 2015), and recent reviews of both cross-sectional and longitudinal studies suggest that physical activity can have beneficial effects on a broad spectrum of physical and mental health outcomes (Brand et al., 2010; Flishner, 2005; Hamer, 2012; Penedo and Dahn, 2005). Regular leisure time physical activity also has a moderate, dose-dependent beneficial effect on sleep quality (Kredlow et al., 2015). However, to our knowledge, no studies have yet examined the potential modifying effects of leisure time physical activity on the association between sleep quality and CAR in any population, including those working in law enforcement and other high stress occupations. In this cross-sectional study of Buffalo police officers, we seek to address this gap; specifically, we investigate the potential differential associations of sleep quality with CAR in those who report high vs. low physical activity. Because gender and particularly sex steroids have been shown to influence cortisol response (McEwen, 2002; Pruessner et al., 1997; Wright and Steptoe, 2005), we also assess the potential modifying effects of gender on these associations.
2. Methods
2.1. Study population and design
Participants were officers enrolled in the Buffalo Cardio-Metabolic Occupational Police Stress (BCOPS) study. The BCOPS study was a cross-sectional study, with a prospective component, aimed at investigating the associations of occupational stressors with the psychological and physiological health of police officers. A total of 710 police officers who worked with the Buffalo, New York Police Department were invited to participate in the baseline study; 464 (65.4%) officers agreed to participate and were examined once during 2004–2009. No specific inclusion criteria were indicated for the study, only that participants be sworn police officers and willing to participate (Hartley et al., 2011; Violanti et al., 2006). A written informed consent was collected from each participant. The study was approved by the Internal Review Boards of the State University of New York at Buffalo, and the National Institute for Occupational Safety and Health (NIOSH).
2.2. Measures
Data regarding demographic, lifestyle, physical, biological, occupational, and psychosocial characteristics were collected from each BCOPS study participant using standardized instruments and protocols. Specific measures included in this study are detailed below. Leisure time physical activity (LTPA) level was assessed using the Seven-Day Physical Activity Recall questionnaire and the variable was utilized as a potential effect modifier. Demographic and life style characteristics were used as potential confounders for adjustment of the main association of interest between sleep quality and awakening cortisol response.
2.2.1. Major exposure variable: sleep quality
Sleep quality was assessed using the Pittsburgh Sleep Quality Index (PSQI), a well-established instrument validated in a wide range of populations (Buysse et al., 1989). Designed to assess sleep quality during the previous month, the PSQI consists of 19 items in addition to a five-item rating made by a bed partner that is not included in scoring. Respondents indicate the amount of sleep they obtained and rate the extent to which various factors interfered with their sleep on a four-point Likert-type scale. Responses to the 19 items are grouped into seven components or subscales including: subjective sleep quality (0 = very good, 1 = fairly good, 2 = fairly bad, 3 = very bad), sleep efficiency (0 =≥85%, 1=75 to 85%, 2=65 to 75%, 3=<65%), sleep latency (0 =<15 min, 1=15 to 30 min, 2=30 to 60 min, 3 =>60 min), sleep duration (0 =>7 h, 1=6 to 7 h, 2=5 to 6 h, 3 =<5 h), sleep disturbance, sleep medication use, and daytime dysfunction due to sleepiness; the last three were rated as: 0 = not during the past month, 1 = less than once a week, 2 = once or twice a week, and 3 = three or more times a week. The components are weighted equally on a 0 to 3 scale and are summed to obtain a global PSQI score ranging from 0 to 21, with higher scores indicating poorer sleep quality. A participant was considered to have poor sleep quality if the global PSQI score was above 5 (Buysse et al., 1989). The PSQI is a stable measure of sleep quality and has high internal homogeneity, reliability, and validity (Buysse et al., 1989; Knutson et al., 2006).
2.2.2. Major outcome variables: CAR
For assessment of CAR, subjects were instructed to collect saliva samples immediately after awakening (AC0), and 15 (AC15), 30 (AC30), and 45 (AC45) minutes thereafter. The first saliva sample was to be collected IMMEDIATELY after waking BEFORE getting out of bed. During their clinic examination, participants were provided with a preprinted log sheet on which they noted their time of waking, and times of each of the cortisol samples. Participants were also instructed on proper saliva sampling techniques, including adherence to specific sampling times, which were reiterated on the log sheet given to each participant. The officers were required to come to the clinic examination on the last day of their off workdays. The typical work schedule included 4 days of work, 4 days off work, 4 days of work, and 3 days off work. Therefore, the awakening salivary cortisol samples were collected the day after the clinic examination when the officers had been off-duty for at least 3 days. To avoid contamination of saliva with food or blood caused by micro-injuries of the oral cavity, participants were asked to refrain from taking stimulant medication, smoking, eating and drinking, and brushing their teeth before completing salivary sampling. The wakening saliva samples were collected during a single day and occurred on the day after the clinic examination. Participants were provided Medication Events Monitoring System (MEMS) bottles with salivettes (Sarstedt, USA), a commercially available collection device consisting of a dental roll and a centrifuge tube, for the collection of saliva samples. At the designated collection time, the officers removed the dental roll from the centrifuge tube and placed it in their mouth for approximately two minutes allowing for saturation of the roll. The roll was then returned to the tube and samples were returned to the clinic and subsequently sent to the laboratory. The officers were told that times when the MEMS cap is opened and closed would be recorded by the device, thereby reinforcing protocol adherence. Upon delivery the tubes were centrifuged to provide a non-viscous saliva sample for assay of cortisol. Samples were stored in a freezer at −20 °C until sent to the Technical University of Dresden (Germany) for analysis. After thawing, salivettes were centrifuged at 3000 rpm for 5 min, which resulted in a clear supernatant of low viscosity. Salivary concentrations were measured using commercially available chemiluminescence immunoassay with high sensitivity (IBL International, Hamburg, Germany). Sample and reagent handling was semi-automated using a liquid handling robot (Genesis, Tecan, Switzerland) and quality control samples of low, medium, and high cortisol concentrations were run on each microtiter plate assayed. The intra and inter assay coefficients for cortisol were both below 8%.
The four salivary cortisol samples and the corresponding times of collection were used to derive seven CAR indices (see Fig. 1 for illustration of the various derived CAR parameters). These were (1) total area under the curve (AUCG), (2) area under the curve with respect to increase (AUCI), (3) average of the four cortisol measurements (AVE), (4) the peak value (PK), (5) time from baseline to peak (TBP) which represents the duration, in minutes, from awakening to time of peak cortisol, (6) decline in cortisol following peak (DCFP), and (7) the post-awakening increase in cortisol. Decline in cortisol following peak (DCFP) refers to the amount of reduction in cortisol after the morning peak is achieved and is calculated by subtracting the last (fourth) cortisol value from the peak cortisol value. The increase in cortisol with respect to the first awakening sample was calculated three different ways: (1) subtracting the cortisol value at awakening from the cortisol value at 30 min post awakening (30Inc); (2) subtracting the cortisol value at awakening from the peak cortisol level observed during the post-awakening period (PkInc), and (3) subtracting the cortisol value at awakening from the average of all post-awakening samples (MnInc). Three of the CAR indices (AUCG, AVE, and PK) are indicative of the total awakening cortisol production during the CAR period while the remaining four parameters (AUCI, TBP, DCFP, and post-awakening increase in cortisol) are indicative of the dynamic of CAR (change in cortisol over time). These derived cortisol parameters served as the outcome variables of interest for our study. Further details in the concept and derivation of these CAR indices including formulas are described elsewhere (Pruessner et al., 2003; Clow et al., 2004).
Fig. 1.

Sketch illustrating the various CAR indices: (1) total area under the curve (AUCG: area of the region under the curve to the ground), (2) area under the curve with respect to increase (AUCI: shaded portion), (3) average of the four cortisol measurements (AVE), (4) the peak value (PK), (5) time from baseline to peak (TBP), (6) decline in cortisol following peak (DCFP), and (7) the post-awakening increase in cortisol (30Inc, PkInc, and MnInc). Note that in this particular sketch, 30Inc and PkInc are identical because the peak also happen to occur at AC30.
In subjects who comply with the saliva sampling protocol for assessment of CAR, the typical awakening cortisol response is an increase of at least 2.5 nmol/l from baseline cortisol levels (Wust et al., 2000), and this value has been used as an indicator for normal cortisol response in research and clinical fields (Kudielka et al., 2003). A participant is considered as a CAR responder if he/she shows a cortisol increase of at least 2.5 nmol/l above the baseline value (i.e., AC30 (cortisol value at 30 min following awakening)-AC0 (baseline cortisol at awakening)>2.5).
2.2.3. Modifying variable: LTPA
LTPA was assessed using the Seven-Day Physical Activity Recall (PAR) questionnaire, an interviewer administered questionnaire developed in the Stanford Five-City Project (Sallis et al., 1985). Officers were asked to provide the number of hours they spent on three types of physical activity (occupational, sports or leisure time, and household) during the previous 7 days (5 weekdays and 2 weekend days) at each of the following intensities: moderate, hard, and very hard. Examples of occupational, household, and sports activities for each intensity level are described elsewhere (Ma et al., 2011). Total minutes of LTPA per week were then computed by counting 1-min of hard or very hard-intensity activity as 2-min of moderate-intensity activity (i.e., total minutes of moderate-intensity activity/week=minutes of moderate-intensity activity/week + 2 × min of hard or very hard-intensity activity/week). The officers were then categorized into two groups based on the 2008 US Department of Health and Human Services guideline on physical activity for adults (Physical Activity Guidelines Advisory Committee, 2008): (1) sufficiently active (reporting at least 150 min of moderate-intensity physical activity/week or 75-min of vigorous-intensity activity/week or an equivalent combination) and (2) insufficiently active/inactive (those reporting less than the recommended physical activity minutes/week). LTPA (insufficiently active vs. sufficiently active) served as potential effect modifier of the association between sleep quality and awakening cortisol response. The instrument is reliable and valid; detailed description including reliability and validity data are reported by Pereira et al. (1997) and Dishman and Steinhardt (1988).
2.2.4. Covariates
Study participants self-reported demographic and lifestyle characteristics, including age, gender, race/ethnicity, marital status, education, rank, years of service, smoking, and alcohol consumption. Height and weight were measured with shoes removed, recorded to the nearest half centimeter and rounded up to the nearest quarter of a pound, respectively; body mass index (BMI) was calculated as weight in kilograms divided by height in meters squared. Alcohol consumption was ascertained using Food Frequency Questionnaire (FFQ) data regarding drinking patterns; specifically, officers reported how often they drank the following amounts of alcoholic beverages: beer (12 Oz), red wine (6 Oz), white or rose wine (6 Oz), and liquor and mixed drinks (1.5 Oz). The number of drinks per week was calculated as the sum of consumption of these amounts from the four types of alcoholic beverages. A number of psychosocial variables, including posttraumatic stress disorder (PTSD), depression, anxiety, and hopelessness were also assessed in the study population. PTSD was assessed using the PTSD checklist civilian version (PCL-C) (Weathers et al., 1993). Depressive symptoms were measured using the Center for Epidemiological Studies Depression (CES-D) scale (Radloff, 1977). Anxiety was assessed using the Beck Anxiety Inventory (BAI), an instrument that measures the symptoms of anxiety that are largely independent of depression (Beck and Steer, 1990). Hopelessness was assessed using the Beck Hopelessness Scale (BHS) which measures the degree of pessimism and negativity about the future (Beck and Steer, 1993).
2.3. Statistical analysis
Among the 464 BCOPS study participants, 348 had complete data on sleep quality, hours of physical activity, and all four waking cortisol values along with the corresponding collection times. Of the 348 participants, only those who were compliant with the salivary cortisol sampling protocol (i.e. collected samples every 15 min) were included in our analytic sample (n=275); a participant is considered compliant if he/she collected the 2nd, 3rd, and 4th saliva samples at exactly at 15, 30, and 45 min following awakening, respectively (Fig. 2). Initial analyses included descriptive results to characterize the demographic and lifestyle characteristics of the study sample. Characteristics of those with good vs. poor sleep quality were compared using chi-square tests and analysis of variance (ANOVA). Two statistical approaches were utilized for the main analyses depending on the nature of the research question. We used analysis of variance/covariance to compare mean levels of the seven CAR summary measures between those with poor vs. good sleep quality. Mixed model analyses for repeated measures were used to determine between group (good vs. poor sleep) differences in cortisol patterns over time (awakening cortisol profile).
Fig. 2.

Sample size tracing for analysis of sleep quality (SQ), leisure time physical activity (LTPA), and CAR: The BCOPS baseline study.
In the first approach, the four cortisol measurements for each subject were transformed into summary parameters representing different aspects of cortisol secretion as detailed above. The primary research question of interest (does the association between sleep quality and awakening cortisol parameters vary by physical activity?) was examined by performing stratified analyses across the two categories of LTPA (inactive/insufficiently active and sufficiently active). In each physical activity category, mean values of the cortisol parameters were compared between those with poor vs. good sleep quality using analysis of variance and covariance. The unadjusted and multivariable adjusted associations were examined. Multivariate models were initially adjusted for demographic variables (age, gender, race/ethnicity, education, marital status, and rank). Additional adjustment was made to assess the impact of lifestyle factors (smoking, alcohol consumption, BMI), awakening time, and psychological measures on our findings. Time of awakening (estimated by time of saliva collection for the first sample) was entered into the statistical model as continuous covariate. A characteristic was included as a covariate in the multivariate model based on prior evidence from the literature and on observed associations (p < 0.05) with either the exposure or the outcome. Prior to stratified analyses, an interaction model relating each outcome (cortisol summary parameter) to sleep quality, LTPA, and an interaction term between sleep quality and LTPA was fit, adjusting for covariates. The statistical significance of the interaction terms was used to assess whether the association between each cortisol parameter and sleep quality differed by LTPA.
In the second approach, a repeated measures analysis was performed to examine the potential modifying influence of LTPA on the relation between officer sleep quality (good vs. poor) and pattern of cortisol change over time (i.e., awakening profile). We fit a three-way repeated measures model (with time as the within-subject factor) involving interaction between LTPA, sleep quality (SQ), and time of saliva collection (defined as time since awakening in minutes entered into the model as a linear predictor). The statistical significance of the interaction term (LTPA×SQ×Time) was used to determine whether association of sleep quality (good vs. poor) to pattern of cortisol change was modified by LTPA. The MIXED procedure in SAS was used to model the repeated measures by applying the autoregressive covariance structure as a model for correlations among measurements made on the same subject. Residuals from the fitted models (ANOVA, ANCOVA, repeated measures models) were tested for normality using formal and graphical procedures. The analyses in approaches I and II were repeated stratifying the data by sex (for men and women officers separately). All statistical analyses were performed using the SAS software version 9.3 (SAS Institute, Inc., Cary, NC). Significance level was set at 5% except for interaction terms (10%). The type I error rate for interaction tests was raised to 10% to account for reduced power of testing interaction terms.
3. Results
3.1. Demographic and lifestyle characteristics
The demographic and lifestyle characteristics of the sample (n=275) and their association with sleep quality are presented in Table 1. The study population was predominantly male (74%), non-Hispanic white (79%), married (75%), and overweight or obese (83%, BMI≥25); the majority held the rank of patrol officer (66%). The mean age was 42.4 years (SD=8.3). Over half of the study participants reported poor sleep quality (prevalence=53%, 95% CI: 47.1–59.0). Demographic and lifestyle factors did not differ significantly between those with poor vs. good sleep quality (Table 1) except for hours spent on household activity which was significantly higher in officers with poor vs. good sleep quality (5.3 vs. 3.6, p=0.02). Participants, on average, collected their first waking cortisol sample at 7:30 AM ± 2.2 h. Over 60% of the officers reported sufficient (≥ 150 min/week) LTPA (prevalence=62%, 95% CI: 56.3–67.8) while 19% had insufficient leisure time physical activity (10 –<150 min/week) and 20% were inactive (0 min/week). Demographic and lifestyle factors did not differ significantly by LTPA (data not shown). Unsurprisingly, relative to officers who met LTPA guidelines, those who reported insufficient LTPA indicated a higher overall prevalence of poor sleep quality (60% vs. 48.2%), a higher global sleep quality score (6.9 ± 3.4 vs. 6.0 ± 3.3), and earlier average waking times (7:27AM±1.9 vs. 7:37AM±2.6, p=0.01). Overall, 16% of our sample had PTSD, 11% had depressive symptoms, and 31% and 18% had mild to severe anxiety and hopelessness, respectively (Table 1). The prevalence of psychological dysfunction was significantly higher among officers with poor sleep quality compared to those with good sleep quality (PTSD: 22.1% vs. 9.2%, p=0.01; depression: 18.1% vs. 2.3%, p=0.01); mild to severe anxiety: 43.9% vs. 28.2%, p=0.01; mild to severe hopelessness 22.0% vs. 12.3%, p=0.01).
Table 1.
Demographic and lifestyle characteristics of study participants by sleep quality: BCOPS Study 2004–2009.
| Sleep quality |
||||
|---|---|---|---|---|
| Characteristics | All (n=275) |
Good (n=130) |
Poor (n=145) |
P-valuea |
| Gender | ||||
| Male | 202 (73.5) | 96 (73.9) | 106 (73.1) | 0.89 |
| Female | 73 (26.6) | 34 (26.2) | 39 (26.9) | |
| Race | ||||
| White | 215 (79.3) | 99 (77.3) | 116 (81.1) | 0.76 |
| Black | 50 (18.5) | 26 (20.3) | 24 (16.8) | |
| Hispanic | 6 (2.2) | 3 (2.3) | 3 (2.1) | |
| Education | ||||
| ≤ High school | 34 (12.4) | 18 (13.9) | 16 (11.0) | 0.68 |
| College<4 years | 157 (57.1) | 71 (54.6) | 86 (59.3) | |
| College + 4 years | 84 (30.6) | 41 (31.5) | 43 (29.7) | |
| Marital status | ||||
| Single | 34 (12.4) | 19 (14.6) | 15 (10.3) | 0.36 |
| Married | 205 (74.6) | 97 (74.6) | 108 (74.5) | |
| Divorced | 36 (13.1) | 14 (10.8) | 22 (15.2) | |
| Rank | ||||
| Police officer/ Sergeant | 181 (65.8) | 89 (68.5) | 92 (63.5) | 0.20 |
| Lieutenant/ Captain | 36 (13.1) | 12 (9.2) | 24 (16.6) | |
| Detective/Other | 58 (21.1) | 29 (22.3) | 29 (20.0) | |
| Smoking | ||||
| Current | 43 (15.7) | 22 (17.1) | 21 (14.5) | 0.36 |
| Former | 68 (24.8) | 27 (20.9) | 41 (28.3) | |
| Never | 163 (59.5) | 80 (62.0) | 83 (57.2) | |
| Work load | ||||
| Low | 93 (35.0) | 43 (35.0) | 50 (35.0) | 0.99 |
| Moderate/High) | 173 (65.0) | 80 (65.0) | 93 (65.0) | |
| Sufficiently activeb | 170 (61.8) | 88 (67.7) | 82 (56.6) | 0.06 |
| Age, years | 42.4 ± 8.3 | 42.2 ± 8.6 | 42.6 ± 8.0 | 0.66 |
| Years of services, years | 15.4 ± 8.2 | 15.4 ± 8.8 | 15.4 ± 7.7 | 0.99 |
| Physical activity, hours/wk.c | 15.4 ± 13.4 | 14.4 ± 11.7 | 16.3 ± 14.9 | 0.24 |
| Occupational, hours/wk. | 6.2 ± 10.6 | 5.7 ± 7.8 | 6.7 ± 12.7 | 0.47 |
| Household, hours/wk. | 4.5 ± 6.6 | 3.6 ± 4.3 | 5.3 ± 6.9 | 0.02 |
| Leisure time, hours/wk. | 4.7 ± 5.2 | 5.1 ± 5.3 | 4.4 ± 5.1 | 0.27 |
| Body mass index, kg/m2 | 29.0 ± 4.4 | 28.9 ± 3.9 | 29.1 ± 4.8 | 0.71 |
| Alcohol, drinks/wk. | 5.6 ± 9.9 | 4.8 ± 9.3 | 6.4 ± 10.3 | 0.21 |
| Waking timed | 7:30AM ± 2.2 hrs. | 7:25AM ± 2.0 | 7:36AM ± 2.4 | 0.57 |
| Psychosocial measures (%)e | ||||
| PTSD symptom | 40 (16.0) | 11 (9.2) | 29 (22.1) | 0.01 |
| Depression | 29 (11.0) | 3 (2.3) | 26 (18.1) | 0.01 |
| Beck Anxiety | 0.01 | |||
| Minimal | 187 (70.0) | 104 (82.0) | 83 (58.5) | |
| Mild | 53 (20.0) | 18 (14.2) | 35 (27.0) | |
| Moderate | 22 (8.2) | 5 (14.0) | 17 (12.0) | |
| Severe | 7 (2.6) | 0 (0.0) | 7 (4.9) | |
| Beck Hopelessness | 0.01 | |||
| Minimal | 225 (83.0) | 114 (88.0) | 111 (78.2) | |
| Mild | 37 (14.0) | 16 (12.3) | 21 (15.0) | |
| Moderate | 10 (4.0) | 0 (0.0) | 10 (7.0) | |
| Severe | 0 (0.0) | 0 (0.0) | 0 (0.0) | |
Results are n (%) for categorical variables and means ± SD for the continuous variables.
P-values are from χ2 tests of independence or Fisher’s exact test for categorical variables and from ANOVA testing differences in means between good and poor sleep quality.
Sufficiently active refers to meeting the recommend at least 150-min/week of leisure time moderate intensity activity.
Physical activity hours include occupational, household, and leisure time activities.
Walking time is the time of collection of the first saliva sample.5Missing values for psychosocial variables were (n=25 for PTSD, n=3 for depression, n=6 for anxiety, and n=3 for hopelessness).
There were some gender differences in demographic and lifestyle characteristics (data not shown). The proportion of current smokers (26% vs. 12%, p < 0.01) and those who reported low workload (46% vs. 31%, p=0.02) was higher among female officers while the percentage of those who were married was lower in female compared to male officers (56% vs. 81%, p < 0.01). Male officers reported longer years of service (16 ± 9 vs. 13 ± 6, p=0.01), consuming more drinks per week (6.4 ± 11 vs. 3.4 ± 5, p=0.03), and engagement in fewer household activity hours per week (3.7 ± 5 vs. 6.7 ± 8, p < 0.01) compared to female officers.
Those who did not comply with the cortisol sampling protocol (n=73, Fig. 2) and were thus excluded from analysis were similar to those who complied (n=275) except for a lower percentage of female officers (12.3% vs. 26.6%, p=0.01) and a higher percentage of college graduates (51.4% vs. 30.6%, p=0.003) in the non-compliant group.
3.2. Sleep quality and the CAR indices
The multivariable adjusted associations between sleep quality and awakening cortisol parameters, stratified by LTPA, are shown in Table 2 (for the pooled sample). In the pooled sample (N=275), the association between sleep quality and mean levels of awakening cortisol parameters varied significantly by LTPA (p-values for interaction ≤ 0.05 for seven of the nine cortisol parameters). As detailed in Table 2, sleep quality was significantly associated with mean levels of awakening cortisol parameters in officers who were inactive or insufficiently active, but not among those who were sufficiently active (Table 2). Among officers who were sufficiently active, the mean levels of awakening cortisol parameters did not differ significantly between those with good versus poor sleep quality (p-values>0.20 for all parameters). On the other hand, among officers who were inactive or insufficiently active, the adjusted mean levels of awakening cortisol parameters were significantly higher for those with good sleep quality compared to those with poor sleep quality (Table 2) (AUCG : 777.4 vs. 606.5, p=0.02; AUCI : 249.3 vs. 83.3, p=0.02; average awakening cortisol: 16.7 vs. 13.3, p=0.03); peak cortisol: 24.0 vs. 18.9, p=0.03; and the increase in cortisol post-awakening (30Inc: 8.1 vs. 2.9, p < 0.05; PkInc: 12.3 vs. 7.2, p=0.02; MnInc: 6.7 vs. 2.3, p=0.03).
Table 2.
Multivariable-adjusteda mean values of awakening cortisol parameters (±SE), by sleep quality, stratified by leisure time physical activity for all participants in the study sample (N=275, pooled sample): BCOPS Study.2004–2009.
| Sufficient LTPAb |
Inactive/Insufficient LTPAb |
||||||
|---|---|---|---|---|---|---|---|
| Sleep Quality |
Sleep Quality |
||||||
| CAR parameter (unit) | Good (n=88) |
Poor (n=82) |
p-value | Good (n=42) |
Poor (n=63) |
p-value | p-value for interaction |
| AUCG (nmol/liter×minutes) | 650.2 ± 30.9 | 642.7 ± 32.3 | 0.87 | 777.4 ± 56.0 | 606.5 ± 44.7 | 0.02 | 0.03 |
| AUCI (nmol/liter×minutes) | 138.7 ± 26.1 | 157.1 ± 27.2 | 0.63 | 249.3 ± 55.2 | 83.3 ± 44.1 | 0.02 | 0.01 |
| Average cortisol (nmol/l)c | 14.2 ± 0.7 | 14.0 ± 0.7 | 0.84 | 16.7 ± 1.2 | 13.3 ± 0.9 | 0.03 | 0.05 |
| Peak cortisol (nmol/l) | 19.1 ± 0.9 | 18.7 ± 1.0 | 0.78 | 24.0 ± 1.8 | 18.9 ± 1.5 | 0.03 | 0.05 |
| Time from baseline to peak (minutes) | 28.8 ± 1.7 | 26.0 ± 1.8 | 0.24 | 28.9 ± 2.6 | 23.9 ± 2.1 | 0.15 | 0.61 |
| Cortisol decline following peak (nmol/l) | 3.6 ± 0.5 | 3.3 ± 0.5 | 0.64 | 5.49 ± 1.2 | 4.7 ± 1.0 | 0.60 | 0.75 |
| 30Inc (nmol/l) | 4.5 ± 0.9 | 5.1 ± 0.9 | 0.69 | 8.08 ± 2.0 | 2.9 ± 1.6 | 0.05 | 0.03 |
| PkInc (nmol/l) | 7.7 ± 0.8 | 7.9 ± 0.8 | 0.86 | 12.3 ± 1.6 | 7.2 ± 1.3 | 0.02 | 0.02 |
| MnInc (nmol/l) | 3.8 ± 0.7 | 4.3 ± 0.8 | 0.64 | 6.67 ± 1.5 | 2.3 ± 1.2 | 0.03 | 0.02 |
Abbreviations: AUCG: Total area under the curve with respect to ground; AUCI: Area under the curve with respect to increase; 30Inc: increase in cortisol from baseline to 30 min post-awakening; PkInc: increase in cortisol from baseline to peak cortisol post-awakening; MnInc: increase in cortisol from baseline to average of post-awakening.
Test of normality: The quantile-quantile plot (Q-Q plot) of the residuals for each CAR parameter formed a line that was roughly straight suggesting that the distribution of the residuals were approximately symmetrical in both groups (sufficiently active and inactive).
Adjustment was made for age, gender, race, education, marital status, and rank.
According to the 2008 Physical Activity Guidelines for Americans, sufficiently active vs. inactive/insufficiently active is defined as meeting/exceeding vs. not meeting the recommended minimum of 150-min/week of moderate intensity activity. For each group, a model relating each outcome to sleep quality (yes/no), LTPA (inactive vs. sufficiently active), and interaction between the two was fit, adjusting for covariates.
Average of four cortisol measurements.
Table 3 details the association of cortisol parameters by LTPA further stratified by gender. As in the pooled sample, the association of sleep quality to measures of cortisol response varied significantly by LTPA in men (p-values for interaction≤0.05 for all but two cortisol measures), although not in women. In men who were inactive/insufficiently active, mean values of cortisol parameters were significantly larger in officers with good sleep quality relative to those with poor sleep quality (Table 3) (AUCG: 835 vs. 588, p < 0.01; AUCI: 264 vs. 67, p=0.03), average awakening cortisol: 18.0 vs. 12.9, p=0.01; peak cortisol: 26.0 vs. 17.6, p < 0.01); and the increase in cortisol post-awakening (30Inc: 8.7 vs. 2.0, p=0.04; PkInc: 13.3 vs. 6.0, p < 0.01; MnInc: 7.0 vs. 1.8, p=0.03). In contrast, among men who were sufficiently active mean cortisol parameters did not differ by sleep quality (Table 3). However, as indicated above, awakening cortisol parameters did not show significant differences by sleep quality in either the inactive or the sufficiently active group in the smaller sample of women officers (Table 3). Further adjustment for additional confounders including time of awakening and lifestyle factors (alcohol consumption, smoking, and body mass index) and psychological variables (PTSD, depression, anxiety, and hopelessness) did not appreciably alter the observed associations in either the pooled or the stratified samples.
Table 3.
Multivariable-adjusteda mean values of awakening cortisol parameters (±SE), by sleep quality, stratified by leisure time physical activity and gender: BCOPS Study 2004–2009.
| Sufficient LTPAb |
Inactive/Insufficient LTPAb |
|||||||
|---|---|---|---|---|---|---|---|---|
| Sleep Quality |
Sleep Quality |
|||||||
| Gender | CAR parameter (unit) | Good | Poor | Good | Poor | P-value for interaction | ||
| Men | (n=62) | (n=62) | p-value | (n=34) | (n=44) | p-value | ||
| AUCG (nmol/liter × minutes) | 682.0 ± 36.0 | 653.0 ± 37.0 | 0.59 | 835.0 ± 65.0 | 588.0 ± 56.0 | < 0.01 | 0.02 | |
| AUCI (nmol/liter × minutes) | 164.0 ± 30.0 | 177.0 ± 30.0 | 0.75 | 264.0 ± 64.0 | 67.0 ± 55.0 | 0.03 | 0.02 | |
| Average cortisol (nmol/l)c | 14.7 ± 0.8 | 14.2 ± 2.9 | 0.64 | 18.0 ± 1.4 | 12.9 ± 1.2 | 0.01 | 0.01 | |
| Peak cortisol (nmol/l) | 19.5 ± 1.0 | 19.1 ± 1.1 | 0.81 | 26.0 ± 2.1 | 17.6 ± 1.8 | < 0.01 | < 0.01 | |
| Time from baseline to peak (minutes) | 28.1 ± 1.9 | 26.0 ± 1.9 | 0.45 | 29.6 ± 2.9 | 22.6 ± 2.5 | 0.08 | 0.26 | |
| Cortisol decline following peak (nmol/l) | 4.5 ± 0.6 | 3.6 ± 0.6 | 0.30 | 6.4 ± 1.3 | 4.2 ± 1.1 | 0.22 | 0.54 | |
| 30Inc (nmol/l) | 5.5 ± 1.0 | 5.8 ± 1.1 | 0.87 | 8.7 ± 2.3 | 2.1 ± 2.0 | 0.04 | 0.03 | |
| PkInc (nmol/l) | 7.9 ± 0.9 | 8.5 ± 0.9 | 0.65 | 13.3 ± 1.8 | 6.0 ± 1.6 | < 0.01 | < 0.01 | |
| MnInc (nmol/l) | 4.2 ± 0.8 | 4.8 ± 0.9 | 0.65 | 7.0 ± 1.7 | 1.8 ± 1.5 | 0.03 | 0.02 | |
| Women | (n = 26) | (n = 20) | (n = 8) | (n = 19) | ||||
| AUCG (nmol/liter × minutes) | 577.0 ± 54.0 | 607.0 ± 63.0 | 0.73 | 609.0 ± 107.0 | 624.0 ± 67.0 | 0.91 | 0.95 | |
| AUCI (nmol/liter × minutes) | 75.0 ± 54.0 | 102.0 ± 62.0 | 0.75 | 196.0 ± 126.0 | 118.0 ± 79.0 | 0.62 | 0.59 | |
| Average cortisol (nmol/l)c | 13.1 ± 1.2 | 13.3 ± 1.4 | 0.92 | 13.1 ± 2.3 | 13.8 ± 1.4 | 0.81 | 0.73 | |
| Peak cortisol (nmol/l) | 18.4 ± 1.8 | 17.3 ± 2.0 | 0.69 | 19.3 ± 3.2 | 20.4 ± 2.0 | 0.78 | 0.34 | |
| Time from baseline to peak (minutes) | 30.6 ± 3.9 | 25.5 ± 4.5 | 0.42 | 23.4 ± 5.9 | 28.1 ± 3.7 | 0.53 | 0.31 | |
| Cortisol decline following peak (nmol/l) | 1.5 ± 0.6 | 2.7 ± 0.8 | 0.23 | 4.8 ± 2.9 | 4.5 ± 1.8 | 0.94 | 0.77 | |
| 30Inc (nmol/l) | 1.9 ± 1.8 | 3.3 ± 2.1 | 0.63 | 6.5 ± 4.4 | 4.3 ± 2.8 | 0.69 | 0.74 | |
| PkInc (nmol/l) | 7.2 ± 1.6 | 6.0 ± 1.8 | 0.64 | 10.1 ± 3.2 | 9.1 ± 2.0 | 0.81 | 0.59 | |
| MnInc (nmol/l) | 2.6 ± 1.5 | 2.8 ± 1.7 | 0.95 | 5.3 ± 3.4 | 3.4 ± 2.1 | 0.66 | 0.76 | |
Abbreviations: AUCG: Total area under the curve with respect to ground; AUCI: Area under the curve with respect to increase; 30Inc: increase in cortisol from baseline to 30 min post-awakening; PkInc: increase in cortisol from baseline to peak cortisol post-awakening; MnInc: increase in cortisol from baseline to average of post-awakening.
Test of normality: The quantile-quantile plot (Q-Q plot) of the residuals for each CAR parameter formed a line that was roughly straight suggesting that the distribution of the residuals were approximately symmetrical in both groups (sufficiently active and inactive) for men. The distribution of residuals for women were positively skewed which in part could be a function of the small sample size in this group.
Adjustment was made for age, gender, race, education, marital status, and rank.
According to the 2008 Physical Activity Guidelines for Americans, sufficiently active vs. inactive/insufficiently active is defined as meeting/exceeding vs. not meeting the recommended minimum of 150-min/week of moderate intensity activity. For each group, a model relating each outcome to sleep quality (yes/no), LTPA (inactive vs. sufficiently active), and interaction between the two was fit, adjusting for covariates.
Average of four cortisol measurements.
3.3. Sleep quality and the CAR profile (change overtime)
The statistical significance of the three-way interaction term (LTPA×SQ×Time) was used as a guide to test whether differences in the awakening cortisol pattern between officers with good and poor sleep quality depended on level of LTPA. After adjustment for potential confounders, the relation of sleep quality to awakening cortisol profiles again varied significantly by LTPA in both the overall sample (p-value for three-way interaction=0.05, Fig. 3) and in male officers (p-value for three-way interaction=0.01, Fig. 4A&B). In contrast, LTPA did not appear to moderate the association between sleep quality and awakening cortisol profile in female officers (p-value for three-way interaction= 0.67) (Fig. 4C&D).
Fig. 3.
Pooled sample. Awakening cortisol profile by sleep quality stratified by LTPA levels showing significant differences in pattern and total cortisol secretion by sleep quality only among those who were inactive or insufficiently active.
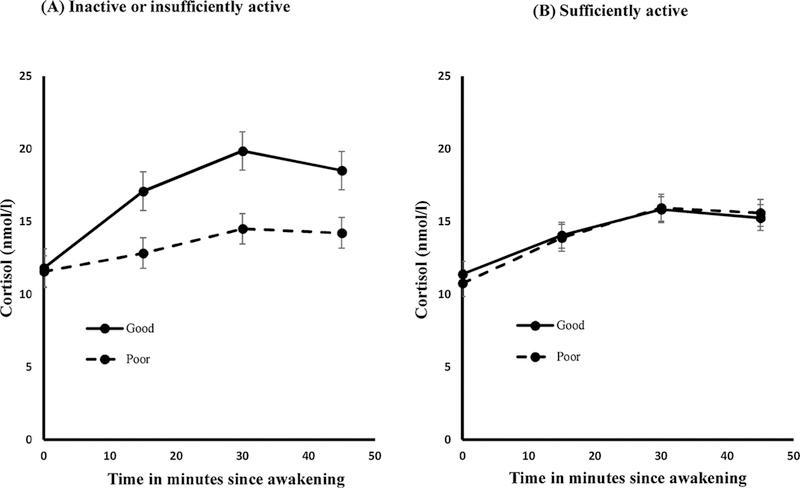
Following a significant three-way interaction term in the overall sample and men officers, the relation between sleep quality and awakening cortisol profile was then examined at each level of LTPA; a model relating awakening cortisol values to sleep quality, time, and interaction between sleep quality and time (SQ×Time) was fit separately for the pooled sample, men, and women. Among officers who were inactive or insufficiently active, the awakening cortisol profile was significantly flatter in officers with poor sleep quality compared to those with good sleep quality, in both the pooled sample (Fig. 3A, interaction p-value (SQ×Time)=0.09) and men (Fig. 4A, interaction p-value (SQ×Time)=0.05). In contrast, among officers who were sufficiently active, there were no differences in awakening cortisol profile between those with poor versus good sleep quality, in both the pooled sample (Fig. 3B, interaction p-value (SQ×Time)=0.50) and men (Fig. 4B, interaction p-value (SQ×Time) = 0.17). In women officers, the awakening cortisol profile did not differ significantly between those with poor versus good sleep quality regardless of LTPA (Fig. 4C&D, interaction p-value (SQ×Time)=0.9711 for inactive; p=0.3654 for sufficiently active); this was expected given that the three-way interaction term was not significant (p-value=0.67).
Fig. 4.

Stratified by gender. Awakening cortisol profile by sleep quality stratified by gender and LTPA levels; among men significant differences in profile and total cortisol secretion by sleep quality were observed only in those who were inactive or insufficiently active while among women there were no significant differences in either pattern or total cortisol secretion by sleep quality regardless of LTPA.
3.4. Sleep quality and awakening cortisol responder rates
Ancillary analyses to assess robustness of our findings showed that comparison of responder rates between those with good vs. poor sleep quality, stratified by LTPA yielded similar findings. In this sample of officers, responder rate did not differ by LTPA (57% vs. 63% for insufficiently vs. sufficiently active officers, p=0.35). However, among inactive officers, the proportion of responders was significantly higher in those with good sleep quality relative to those with poor sleep quality (73.8% vs 46.0%, p=0.01). In contrast, responder rate did not differ by sleep quality among officers who reported sufficient activity (61.4% vs. 64.6% for those with good versus poor sleep quality, respectively, p=0.66). Likewise, among inactive male participants, responder rate was significantly higher in those who reported good vs. poor sleep quality (73.5% vs. 40.9%, p < 0.01). As in the pooled sample, responder rates did not differ by sleep quality in active men (66.1% vs. 69.4% for good vs. poor sleep quality, respectively, p=0.70), or in women regardless of activity level (p-values>0.66). Lastly, we examined whether the awakening cortisol profile differed between CAR responders vs. CAR non-responders (Fig. 5). The result showed that (a) CAR non-responders exhibited a significantly inverted cortisol pattern compared to responders regardless of sleep quality in both inactive and sufficiently active group (P < 0.01), and (b) the extent or magnitude of inversion among CAR non-responders was significantly greater among officers who were inactive/insufficiently active relative to those who were sufficiently active (P=0.02).
Fig. 5.

Pooled sample. Awakening cortisol profile by CAR responder status stratified by LTPA levels and sleep quality showing significant differences in pattern by CAR responder status where non-responders exhibited inverted pattern regardless of LTPA and sleep quality.
4. Discussion
The aim of this study was to examine whether the association between sleep quality and CAR, a biomarker of the stress response system, was moderated by LTPA level in a high stress occupation. In this study of urban police officers, the association of sleep quality with the two aspects of the CAR (the total awakening cortisol output and the change in cortisol during the first hour following awakening) varied significantly by LTPA in the pooled sample. Among participants who were inactive or insufficiently active, poor sleep quality was associated with a significantly lower awakening cortisol output and a flatter profile after awakening (representing an attenuated cortisol response). In contrast, among officers who were sufficiently active, there were no significant differences by sleep quality in any measures of CAR, suggesting a possible protective effect of physical activity. Typically, healthy adults exhibit a sharp increase in cortisol following awakening (Wust et al., 2000). In our sample, level of LTPA also modified the association of sleep quality to both CAR and to CAR responder rate. In inactive officers, those with good sleep quality showed a significantly higher mean increase in cortisol (MnInc) and responder rate than did those with poor sleep quality. In contrast, neither the magnitude of increase in cortisol following awakening nor the CAR responder rate differed by sleep quality in officers who reported sufficient LTPA. Regardless of sleep quality, the cortisol profile of CAR non-responders was significantly inverted compared to CAR responders and the magnitude of inversion was significantly pronounced in officers who were inactive/insufficiently active.
In analyses stratified by gender, the association of sleep quality to CAR indices showed similar variation by LTPA in male officers; i.e., CAR parameters differed significantly by LTPA level only in those who were inactive or insufficiently active. In contrast, we found no evidence for a modifying influence of LTPA on the relationship between sleep quality and measures of CAR among female officers. While small sample sizes limit conclusions regarding gender disparities, previous studies have reported gender differences in factors affecting basal and stress related HPA axis activation that could in turn influence CAR. These include sexual dimorphism in brain structures modulating HPA axis activity as well as differences in gonadal steroid hormone secretion and corticosteroid binding globulin levels (Fries et al., 2009; Kirschbaum et al., 1999).
Earlier studies in this cohort of police officers reported that poor sleep quality was higher in men and women with high perceived stress than in those with low perceived stress scores (Charles et al., 2011), and that traumatic events at work were inversely associated with sleep quality (Bond et al., 2013), although the type of event varied by gender. Police officers also have among the poorest cardiovascular disease profiles of any occupation (Hartley et al., 2011). HPA axis activity is a strong marker of cardiovascular health (Kudielka and Kirschbaum, 2005), suggesting that improvement in this parameter could portend improvement in overall health. In our sample, good sleep quality was significantly more common among active officers (52%) than in inactive officers (40%). The improved sleep quality with sufficient physical activity is also observed in men (50% to 44%) and women (57% to 30%). Our results indicate an association between poor sleep quality and adverse changes in CAR in officers who were inactive, but not among those who exercised sufficiently, suggesting a potential protective effect of LTPA, i.e.,LTPA may help buffer the negative effects of poor sleep on CAR. Although we observed similar associations in male officers, we did not find evidence for a modifying influence of LTPA in female officers. However, the number of women in this study was small, limiting statistical power and potentially helping to explain the null findings in this group.
Systematic reviews of prior studies on sleep measures and CAR indices have reported inconsistent findings (Elder et al., 2014; Garde et al., 2011). It is important to note that the magnitude, direction, and statistical significance of the association between sleep quality and CAR could depend on a number of factors that render comparison of findings across studies challenging. These include heterogeneity in (1) the type of sleep measure used (overall sleep quality, sleep duration, number of awakenings, sleep disturbance, etc.) and the method of assessment (self-reports, actigraphy, PSG), (2) the number of saliva samples collected and the CAR indices employed (AC0, increase in cortisol post awakening, AUCG, AUCI, slope of the profile, etc.), and (3) the study design, sample size, population being studied, and statistical method used for analysis (ANOVA/ANCOVA, multilevel analysis).
Studies that examined overall sleep quality in relation to CAR reported lower morning cortisol output and lower increase in cortisol post awakening in those with poor sleep quality. In a cross-sectional study of 4489 Dutch civil servants (Hansen et al., 2012), poor sleep quality during the past month was associated with lower awakening cortisol concentrations. In addition, the prospective component of the same study (with follow-up at 3 months) showed that poor sleep quality at baseline predicted significantly lower cortisol at awakening and lower increase from awakening to peak. In a study by Backhaus et al. (2004), patients with insomnia had significantly lower awakening cortisol compared to healthy controls. In addition, cortisol level at awakening was negatively correlated with self-reported sleep complaints, including frequency of nightly awakenings (r = −0.50), and the Pittsburgh Sleep Quality Index (r = −0.43). Dahlgren et al. (2009) followed a sample of office workers for four consecutive weeks with collection of cortisol at awakening and 15 min post-awakening; subjective sleepiness from the previous day was associated with lower levels of cortisol at awakening. While, we found no significant correlation between sleep quality and cortisol level at awakening (the first sample) in either physical activity group (data not shown), analyses using summary measures of CAR (derived from four sampling points rather than a single measure at awakening) yielded results consistent with those of previous studies; i.e., both morning cortisol secretion and the post-awakening cortisol rise were significantly lower in officers with poor vs. good sleep quality among those who did not engage in sufficient LTPA.
Other studies of CAR relying on a single component of sleep quality (sleep duration) have shown positive associations between sleep duration and the increase in cortisol following awakening. A meta-analysis of data from four studies of healthy adults (total n=509) showed a negative correlation between self-reported sleep duration and a mean increase in awakening cortisol (MnInc), suggesting that subjects with shorter sleep duration experienced larger cortisol awakening response (Wust et al., 2000). A study of middle aged adults (Whitehall II study, n=2751) reported that participants with short sleep duration had a steeper rise in cortisol (from awakening to 30-min post awakening, 30Inc) compared to their counter parts (Kumari et al., 2009). In our sample, sleep duration was not associated with MnInc (data not shown) but inactive officers with poor sleep quality had a significantly lower MnInc (2.3 ± 1.2 vs. 6.7 ± 1.5, p = 0.03) and 30Inc (2.9 ± 1.6 vs. 8.1 ± 2.0, p=0.05) compared to their counterparts.
The disparity in findings of prior studies regarding sleep quality and CAR may in part reflect the moderating effects of lifestyle and other factors, including leisure time physical activity. Engagement in LTPA has been linked to numerous physical and psychosocial health benefits; in contrast physical inactivity is a well-established risk factor for multiple chronic conditions. A meta-analysis of prospective studies showed that performing a high level of LTPA reduced the risk of coronary heart disease (CHD) by 28% while engaging in moderate LTPA reduced the risk of CHD by 12% (Sofi et al., 2008). A prospective cohort study reported that LTPA significantly reduced the risk of mortality from cardiovascular diseases in both men and women regardless of occupational activity level (Holtermann et al., 2013). The findings by Holtermann et al. (2013) suggest that workers with physically demanding jobs have the same need for and receive the same benefit from LTPA as workers in sedentary occupations, underscoring the importance of LTPA. A study based on US national sample also reported similar findings (King et al., 2001); the likelihood of being obese was 50% lower for those who engaged in LTPA independent of their activity level at their jobs. A recent study by Tsenkova (2017) showed that not meeting the LTPA guideline was associated with higher prevalence of insulin resistance, but found no evidence of an association with occupational or household physical activity. An interesting study based on U.S. national data (Loprinzi et al., 2014) examined the “fit but fat” paradigm offered further support for the benefits of physical activity. The authors reported the following results: (1) active obese subjects have more favorable levels of biomarkers than inactive obese subjects, and (2) biomarkers did not differ between inactive normal weight subjects and overweight active individuals. Following numerous of scientific studies that indicated beneficial effects of physical activity and overall health, the US federal government issued its first-ever physical activity recommendations to children and adults in 2008. A recent meta-analytic review paper evaluated a broad range of studies regarding the effects of physical activity on sleep (Kredlow et al., 2015). The authors concluded that regular physical activity has a moderate beneficial effect on sleep quality, which is dependent on adherence. Additionally, a systematic review of studies that examined association of physical activity with CAR (Anderson and Wideman, 2017) suggested that a threshold of exercise may be required to alter the HPA axis and affect CAR, underscoring the value of adherence to regular LTPA.
The current study has several strengths, including the collection of four saliva samples. Availability of multiple samples allowed assessment of nine CAR parameters, including a measure of total cortisol secretion during the CAR period. The collection of saliva samples were timed by an electronic device (MEMS caps) to ensure correct timing of awakening. All samples were subject to quality control. Sleep quality was assessed following a standardized protocol. Additionally, information on a large number of covariates was collected as part of the BCOPS Study, allowing us to adjust for multiple potential confounders. The study sample, police officers, also represent an understudied occupational group with high job-related stress.
Despite these strengths, the findings from this study still need to be interpreted in the context of potential limitations. Both sleep quality and LTPA were assessed through self-report. The study population was restricted to urban police officers from the eastern U.S.; our findings may have limited generalizability to officers from other geographic locations or to other populations. Due to the cross-sectional design, no conclusions can be drawn about causation. The saliva samples were collected during a single morning, an issue that might affect the reliability of the cortisol measurements. However, while it has been argued that at least two days of monitoring are desirable for reliable assessment of CAR (Hellhammer et al., 2007), CAR has been shown to have moderate to high degree of intra-individual stability across two consecutive sampling days (Wust et al., 2000; Kunz-Ebrecht et al., 2004). The sample size for women officers was small, reducing statistical power and reliability of the estimates, and limiting interpretation of the apparent gender differences observed in this study. Finally, it is worth noting that in our analysis, we equate 90 min of moderate intensity activity with 45 min of high-intensity activity based on the official guidelines that currently exist. However, no studies to date have specifically investigated this question and the recommendations by the Department of Health and Human Services that the two will have similar impact on CAR has never been explicitly tested.
In conclusion, in the current population-based study of police officers, leisure time physical activity moderated the association of poor sleep quality with CAR. Among officers who were inactive or insufficiently active, poor sleep quality was associated with both attenuated total volume of morning cortisol secretion and dampened CAR profile (change over time). In contrast, among officers who reported sufficient LTPA, sleep quality was not associated with CAR, suggesting a potential protective effect of physical activity. If confirmed in larger prospective studies, these findings may have implications for the development of workplace policies and programs designed to improve participation in leisure time physical activity. Clearly, additional research is warranted.
Footnotes
Publisher's Disclaimer: Disclaimer
“The findings and conclusions in this report are those of the author (s) and do not necessarily represent the official position of the National Institute for Occupational Safety and Health, Centers for Disease Control and Prevention.”
Disclosure statement
This research was conducted at The State University of New York at Buffalo, Buffalo, NY, USA and was funded by the National Institute for Occupational Safety and Health (NIOSH), contract no.200-2003-01580.
Declaration of interest
The authors report no conflicts of interest. The authors alone are responsible for the content and writing of the paper.
References
- Adam EK, Kumari M, 2009. Assessing salivary cortisol in large-scale epidemiological research. Psychoneuroendocrinology 34, 1423–1436. [DOI] [PubMed] [Google Scholar]
- Anderson T, Wideman L, 2017. Exercise and the cortisol awakening response: a systematic review. Sports Med. Open 3, 37. [DOI] [PMC free article] [PubMed] [Google Scholar]
- Backhaus J, Junghanns K, Hohagen F, 2004. Sleep disturbances are correlated with decreased morning awakening salivary cortisol. Psychoneuroendocrinology 29, 1184–1191. [DOI] [PubMed] [Google Scholar]
- Beck AT, Steer RA, 1990. Manual for Beck Anxiety Inventory Psychological Corporation, San Antonio. [Google Scholar]
- Beck AT, Steer RA, 1993. Beck Hopelessness Scale Manual Harcourt Brace & Company, New York, NY. [Google Scholar]
- Bond J, Sarkisian K, Charles LE, Hartley TA, Andrew ME, Violanti JM, Burchfiel CM, 2013. Association of traumatic police event exposure with sleep quality and quantity in the BCOPS study cohort. Int. J. Emerg. Ment. Health 15, 255–265. [PMC free article] [PubMed] [Google Scholar]
- Brand S, Gerber M, Beck J, Hatzinger M, Puhse U, Holsboer-Trachsler E, 2010. High exercise levels are related to favorable sleep patterns and psychological functioning in adolescents: a comparison of athletes and controls. J. Adolesc. Health 46, 133–141. [DOI] [PubMed] [Google Scholar]
- Buxton OM, Marcelli E, 2010. Short and long sleep are positively associated with obesity, diabetes, hypertension, and cardiovascular disease among adults in the United States. Soc. Sci. Med 71, 1027–1036. [DOI] [PubMed] [Google Scholar]
- Buysse DJ, Reynolds CF 3rd, Monk TH, Berman SR, Kupfer DJ, 1989. The Pittsburgh Sleep Quality Index: a new instrument for psychiatric practice and research. Psychiatry Res 28, 193–213. [DOI] [PubMed] [Google Scholar]
- Charles LE, Slaven JE, Mnatsakanova A, Ma C, Violanti JM, Fekedulegn D, Andrew ME, Vila BJ, Burchfiel CM, 2011. Association of perceived stress with sleep duration and sleep quality in police officers. Int. J. Emerg. Ment. Health 13, 229–241. [PMC free article] [PubMed] [Google Scholar]
- Clow A, Hucklebridge F, Stalder T, Evans P, Thorn L, 2010. The cortisol awakening response: more than a measure of HPA axis function. Neurosci. Biobehav. Rev 35, 97–103. [DOI] [PubMed] [Google Scholar]
- Clow A, Thorn L, Evans P, Hucklebridge F, 2004. The awakening cortisol response: methodological issues and significance. Stress 7, 29–37. [DOI] [PubMed] [Google Scholar]
- Colten HR, Altevogt BM, Institute of Medicine, 2006. Sleep Disorders and Sleep Deprivation: An Unmet Public Health Problem pp. 1–404. 10.17226/11617. [DOI] [PubMed] [Google Scholar]
- Dahlgren A, Kecklund G, Theorell T, Åkerstedt T, 2009. Day-to-day variation in saliva cortisol-relation with sleep, stress and self-rated health. Biol. Psychol 82, 149–155. [DOI] [PubMed] [Google Scholar]
- Debono M, Ghobadi C, Rostami-Hodjegan A, Huatan H, Campbell MJ, Newell-Price J, et al. , 2009. Modified-release hydrocortisone to provide circadian cortisol profiles. J. Clin. Endocrinol. Metab 94, 1548–1554. [DOI] [PMC free article] [PubMed] [Google Scholar]
- Devine JK, Wolf JM, 2016. Determinants of cortisol awakening responses to naps and nighttime sleep. Psychoneuroendocrinology 63, 128–134. [DOI] [PubMed] [Google Scholar]
- Dishman RK, Steinhardt M, 1988. Reliability and concurrent validity for a 7-d re-call of physical activity in college students. Med. Sci. Sports Exercise 20, 14–25. [DOI] [PubMed] [Google Scholar]
- Duan H, Yuan Y, Zhang L, Qin S, Zhang K, Buchanan TW, Wu J, 2013. Chronic stress response decreases the cortisol awakening response in healthy young men. Int. J. Biol. Stress 16, 630–637. [DOI] [PubMed] [Google Scholar]
- Elder GJ, Wetherell MA, Barclay NL, Ellis JG, 2014. The cortisol awakening response - applications and implications for sleep medicine. Sleep Med. Rev 18, 195–204. [DOI] [PubMed] [Google Scholar]
- Flishner M, 2005. Physical activity and stress resistance: sympathetic nervous system adaptions prevent stress-induced immunosuppression. Exercise Sport Sci. Rev 33, 120–126. [DOI] [PubMed] [Google Scholar]
- Fries E, Dettenborn L, Kirschbaum C, 2009. The cortisol awakening response (CAR): facts and future directions. Int. J. Psychophysiol 72, 67–73. [DOI] [PubMed] [Google Scholar]
- Garde AH, Karlsson B, Hansen AM, Persson R, kerstedt T, 2011. Sleep and salivary cortisol. The role of salivary cortisol in health and disease Bentham; [Ebook], vol. 4 pp. 116–128. [Google Scholar]
- Hamer M, 2012. Psychosocial stress and cardiovascular disease risk: the role of physical activity. Psychosom. Med 74, 896–903. [DOI] [PubMed] [Google Scholar]
- Hansen AM, Thomsen JF, Kaergaard A, Kolstad HA, Kaerlev L, Mors O, Rugulies R, Bonde JP, Andersen JH, Mikkelsen S, 2012. Salivary cortisol and sleep problems among civil servants. Psychoneuroendocrinology 37, 1086–1095. [DOI] [PubMed] [Google Scholar]
- Hartley TA, Burchfiel CM, Fekedulegn D, Andrew ME, Violanti JM, 2011. Health disparities in police officers: comparisons to the U.S. general population. Int. J. Emerg. Ment. Health 13, 211–220. [PMC free article] [PubMed] [Google Scholar]
- Hellhammer J, Fries E, Schweisthal OW, Schlotz W, Stone AA, Hagemann D, 2007. Several daily measurements are necessary to reliably assess the cortisol rise after awakening: State- and trait components. Psychoneuroendocrinology 32, 80–86. [DOI] [PubMed] [Google Scholar]
- Holtermann A, Marott JL, Gyntelberg F, Søgaard K, Suadicani P, Mortensen OS, Prescott E, Schnohr P, 2013. Does the benefit on survival from leisure time physical activity depend on physical activity at work? A prospective cohort study. PLoS One 8, 54548. [DOI] [PMC free article] [PubMed] [Google Scholar]
- Inslicht SS, Otte C, McCaslin SE, Apfel BA, Henn-Haase C, Metzler T, Yehuda R, Neylan TC, Marmar CR, 2011. Cortisol awakening response prospectively predicts peritraumatic and acute stress reactions in police officers. Biol. Psychiatry 70, 1055–1062. [DOI] [PMC free article] [PubMed] [Google Scholar]
- King GA, Fitzhugh EC, Bassett DR Jr., McLaughlin JE, Strath SJ, Swartz AM, Thompson DL, 2001. Relationship of leisure-time physical activity and occupational activity to the prevalence of obesity. Int. J. Obes 25, 606–612. [DOI] [PubMed] [Google Scholar]
- Kirschbaum C, Kudielka BM, Gaab J, Schommer NC, Heellhammer DH, 1999. Impact of gender, menstrual cycle phase, and oral contrceptives on the activity of the hypothalamus-pituitary-adrenal axis. Psychosom. Med 61, 154–162. [DOI] [PubMed] [Google Scholar]
- Knutson KL, Rathouz PJ, Yan LL, Liu K, Lauderdale DS, 2006. Stability of the Pittsburgh sleep quality index and the epworth sleepiness questionnaires over 1 year in early middle-aqed adults: the CARDIA study. Sleep 29, 1503–1506. [DOI] [PubMed] [Google Scholar]
- Koh Ds-Q., Koh GC-H, 2007. The use of salivary biomarkers in occupational and environmental medicine. Occup. Environ. Med 64, 201–210. [DOI] [PMC free article] [PubMed] [Google Scholar]
- Kredlow MA, Capozzoli MC, Hearon BA, Calkins AW, Otto MW, 2015. The effects of physical activity on sleep: a meta-analytic review. J. Behav. Med 38, 427–449. [DOI] [PubMed] [Google Scholar]
- Kudielka BM, Kirschbaum C, 2005. Sex differences in HPA axis responses to stress: a review. Biol. Psychol 69, 113–132. [DOI] [PubMed] [Google Scholar]
- Kudielka BM, Broderick JE, Kirschbaum C, 2003. Compliance with saliva sampling protocols: electronic monitoring reveals invalid cortisol daytime profiles in non-compliant subjects. Psychosom. Med 65, 313–319. [DOI] [PubMed] [Google Scholar]
- Kumari M, Badrick E, Ferrie J, Perski A, Marmot M, Chandola T, 2009. Self-reported sleep duration and sleep disturbance are independently associated with cortisol secretion in the Whitehall II study. J. Clin. Endocrinol. Metab 94, 4801–4809. [DOI] [PMC free article] [PubMed] [Google Scholar]
- Kunz-Ebrecht SR, Kirschbaum C, Marmot M, Steptoe A, 2004. Differences in cortisol awakening response on work days and weekends in women and men from the Whitehall II cohort. Psychoneuroendocrinology 29, 516–528. [DOI] [PubMed] [Google Scholar]
- Loprinzi P, Smit E, Lee H, Crespo C, Andersen R, Blair SN, 2014. The “fit but fat” paradigm addressed using accelerometer-determined physical activity data. N. Am. J. Med. Sci 6, 295–301. [DOI] [PMC free article] [PubMed] [Google Scholar]
- Ma CC, Burchfiel CM, Fekedulegn D, Andrew ME, Charles LE, Gu JK, Mnatsakanova A, Violanti JM, 2011. Association of shift work with physical activity among police officers: the Buffalo cardio-metabolic occupational police stress study. J. Occup. Environ. Med 53, 1030–1036. [DOI] [PubMed] [Google Scholar]
- McEwen BS, 2002. Sex, stress and the hippocampus: allostasis, allostatic load and the aging process. Neurobiol. Aging 23, 921–939. [DOI] [PubMed] [Google Scholar]
- Meerlo P, Sgoifo A, Suchecki D, 2008. Restricted and disrupted sleep: effects on autonomic function, neuroendocrine stress systems and stress responsivity. Sleep Med. Rev 12, 197–210. [DOI] [PubMed] [Google Scholar]
- Meyers J, McAuley P, Lavie CJ, Despres JP, Arena R, Kokkinos P, 2015. Physical activity and cardiorespiratory fitness as markers of cardiovascular risk: their independent and interwoven importance to health status. Prog. Cardiovascular Dis 57, 306–314. [DOI] [PubMed] [Google Scholar]
- Neylan TC, Metzler TJ, Best SR, Weiss DS, Fagan JA, Liberman A, Rogers C, Vedantham K, Brunet A, Lipsey TL, Marmar CR, 2002. Critical incident exposure and sleep quality in police officers. Psychosom. Med 64, 345–352. [DOI] [PubMed] [Google Scholar]
- Penedo F, Dahn J, 2005. Exercise and well-being: a review of mental and physical health benefits associated with physical activity. Curr. Opin. Psychiatry 18, 189–193. [DOI] [PubMed] [Google Scholar]
- Pereira MA, FitzGerald SJ, Gregg EW, Joswiak ML, Ryan WJ, Suminski RR, et al. , 1997. A collection of physical activity questionnaires for health-related research. Med. Sci. Sports Exercise 29 (Suppl) pp. S89–S103. [PubMed] [Google Scholar]
- Physical Activity Guidelines Advisory Committee, 2008. Physical Activity Guidelines Advisory Committee Report, 2008 US Department of Health and Human Services, Washington DC. [Google Scholar]
- Pruessner JC, Wolf OT, Hellhammer H, Buske-Kirschbaum A, von Auer K, Jobst S, Kaspers F, Kirschbaum C, 1997. Free cortisol levels after awakening: a reliable biological marker for the assessment of adrenocortical activity. Life Sci 61, 2539–2549. [DOI] [PubMed] [Google Scholar]
- Pruessner JC, Hellhammer DH, Kirschbaum C, 1999. Burnout, perceived stress, and cortisol responses to awakening. Psychosom. Med 61, 197–204. [DOI] [PubMed] [Google Scholar]
- Pruessner JC, Kirschbaum C, Meinlschmidt G, Hellhammer D, 2003. Two formulas for computation of the area under the curve represent measures of total hormone concentration versus time-dependent change. Psychoneuroendocrinology 28, 916–931. [DOI] [PubMed] [Google Scholar]
- Radloff LS, 1977. The CES-D scale: a self-report depression scale for research in the general population. Appl. Psychol Meas 1, 385–401. [Google Scholar]
- Rajaratnam SM, Barger LK, Lockley SW, Shea SA, Wang W, Landrigan CP, O’Brien CS, Qadri S, Sullivan JP, Cade BE, Epstein LJ, White DP, Czeisler CA, Harvard Work Hours, Health and Safety Group, 2011. Sleep disorders, health, and safety in police officers. J. Am. Med. Assoc 306, 2567–2578. [DOI] [PubMed] [Google Scholar]
- Sallis JF, Haskell WL, Wood PD, Fortmann SP, Rogers T, Blair SN, Paffenbarger RS Jr., 1985. Physical activity assessment methodology in the Five-City project. Am. J. Epidemiol 121, 91–106. [DOI] [PubMed] [Google Scholar]
- Selmaoui B, Touitou Y, 2003. Reproducibility of the circadian rhythms of serum cortisol and melatonin in healthy subjects: a study of three different 24-h cycles over six weeks. Life Sci 73, 3339–3349. [DOI] [PubMed] [Google Scholar]
- Sofi F, Capalbo A, Cesari F, Abbate R, Gensini GF, 2008. Physical activity during leisure time and primary prevention of coronary heart disease: an updated meta-analysis of cohort studies. Eur. J. Cardiovasc. Prev. Rehabil 15, 247–257. [DOI] [PubMed] [Google Scholar]
- Steptoe A, Cropley M, Griffith J, Kirschbaum C, 2000. Job strain and anger expression predict early morning elevations in salivary cortisol. Psychosom. Med 62, 286–292. [DOI] [PubMed] [Google Scholar]
- Tromiyam AJ, O’Donovan A, Lin J, Puterman E, Lazaro A, Chan J, Dhabhar FS, Wolkowitz O, Dirschbaum C, Blackburn E, Epel E, 2012. Does cellular aging relate to patterns of allostasis: an examination of basal and stress reactive HPA axis activity and telomere length. Physiol. Behav 106, 40–45. [DOI] [PMC free article] [PubMed] [Google Scholar]
- Tsenkova VK, 2017. Leisure-time, occupational, household physical activity and insulin resistance (HOMAIR) in the Midlife in the United States (MIDUS) national study of adults. Prev. Med. Rep 5, 224–227. [DOI] [PMC free article] [PubMed] [Google Scholar]
- Vila B, Kenney DJ, 2002. Tired cops: the prevalence and potential consequences of police fatigue. Nat. Inst. Justice J 248, 16–21. [Google Scholar]
- Violanti JM, Burchfiel CM, Miller DB, Andrew ME, Dorn J, Wactawski-Wende J, Beighley CM, Pierino K, Joseph PN, Vena JE, Sharp DS, Trevisan M, 2006. The buffalo cardio-metabolic occupational police stress (BCOPS) pilot study: methods and participant characteristics. Ann. Epi 16, 148–156. [DOI] [PubMed] [Google Scholar]
- Violanti JM, Fekedulegn D, Andrew ME, Hartley TA, Charles LE, Miller DB, Burchfiel CM, 2017. The impact of perceived intensity and frequency of police work occupational stressors on the cortisol awakening response (CAR): findings from the BCOPS study. Psychoneuroendocrinology 75, 124–131. [DOI] [PMC free article] [PubMed] [Google Scholar]
- Vrshek-Schallhorn S, Doane LD, Mineka S, Zinbarg RE, Craske MG, Adam EK, 2013. The cortisol awakening response predicts major depression: predictive stability over a 4-year follow-up and effect of depression history. Psychol. Med 43, 483–493. [DOI] [PMC free article] [PubMed] [Google Scholar]
- Weathers FW, Litz BT, Herman DS, Huska JA, Keane TM, 1993. The checklist (PCL): reliability, validity, and diagnostic utility. In: Paper Presented at the Meeting of the International Society for Traumatic Stress Studies San Antonio, TX. [Google Scholar]
- Weitzman ED, Fukushima D, Nogeire C, Roffwarg H, Gallagher TF, Hellman L, 1971. Twenty-four hour pattern of the episodic secretion of cortisol in normal subjects. J. Clin. Endocrinol. Metab 33, 14–22. [DOI] [PubMed] [Google Scholar]
- Wright CE, Steptoe A, 2005. Subjective socioeconomic position, gender and cortisol responses to waking in an elderly population. Psychoneuroendocrinology 30, 582–590. [DOI] [PubMed] [Google Scholar]
- Wust S, Wolf J, Hellhammer DH, Federenko I, Schommer N, Kirschbaum C, 2000. The cortisol awakening response—normal values and confounds. Noise Health 2, 79–88. [PubMed] [Google Scholar]