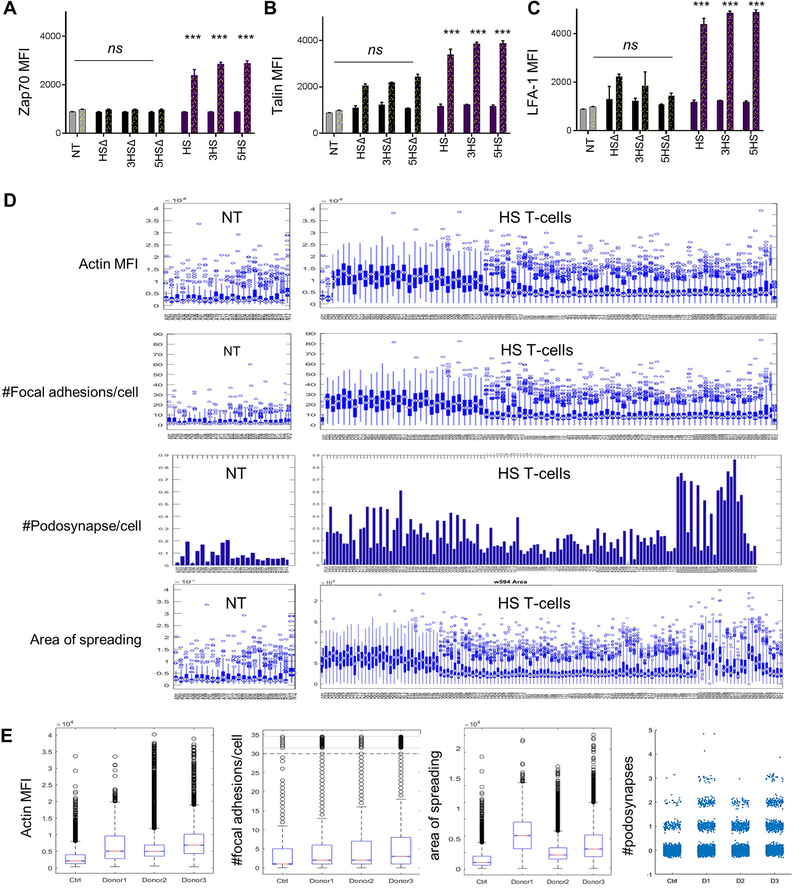
ED-Figure 5 │. Flow-cytometry quantification of nodes downstream of CD6 signaling endodomains and high-throughput analysis of super-resolution imaging using deconvolution microscopy (DM).
Quantification of the flow cytometric data for (A) LFA-1 open configuration, (B) pZap70 and (C) Talin before (solid bars) and after (dotted bars) TWM of 1×10⁵ T-cells. *** p<0.001. (D) Characterization of migrant T cells cellular features using collective quantification of Actin MFI, focal adhesions at HS/ALCAM interface, area of spreading, and podosynapse formation by high throughput microscopy in 3 donors. n=200–800 cells. (E) Box plot summary representing single cell data distributions of all replicates between all three donors expressing HS vs. NT controls.

