

Abstract
Background:
Trace metal concentrations may affect cardio-metabolic risk, but the role of prenatal exposure is unclear. We examined: 1) the relationship between blood metal concentrations during pregnancy and child cardio-metabolic risk factors; 2) overall effects of metals mixture (essential vs. nonessential); and 3) interactions between metals.
Methods:
We measured 11 metals in maternal 2nd trimester whole blood in a prospective birth cohort in Mexico City. In children 4–6 years old, we measured body mass index (BMI), percent body fat, and blood pressure (N=609); and plasma hemoglobin A1C (HbA1c) , non-high density lipoprotein (HDL) cholesterol, triglycerides, leptin, and adiponectin (N=411). We constructed cardio-metabolic component scores using age- and sex-adjusted z-scores and averaged five scores to create a global risk score. We estimated linear associations of each metal with individual z-scores and used Bayesian Kernel Machine Regression to assess metal mixtures and interactions.
Results:
Higher total metals were associated with lower HbA1c, leptin, and systolic blood pressure, and with higher adiponectin and non-HDL cholesterol. We observed no interactions between metals. Higher selenium was associated with lower triglycerides in linear (β=−1.01 z-score units per 1 unit ln(Se), 95%CI = −1.84; −0.18) and Bayesian Kernel Machine Regression models. Manganese was associated with decreased HbA1c in linear models (β = −0.32 and 95% CI: −0.61, −0.03). Antimony and arsenic were associated with lower leptin in Bayesian Kernel Machine Regression models. Essential metals were more strongly associated with cardio-metabolic risk than were nonessential metals.
Conclusions:
Low essential metals during pregnancy were associated with increased cardio-metabolic risk factors in childhood.
Keywords: Environmental health, Metals, Prenatal Exposure Delayed Effects, Pediatric Obesity, Metabolic Diseases, Cardiovascular Diseases, Complex Mixtures
Introduction
Over the last 25 years, obesity prevalence has doubled globally, and cardiovascular disease (CVD) and diabetes have been the first and second leading causes of death, respectively1. While the CVD incidence is low in children, important risk factors can emerge during childhood, increasing the risk of adult disease2. Although diet and exercise are thought to be primarily responsible, the intrauterine environment can also impact CVD risk3,4.
Metals are considered either essential or nonessential, with varied biologic effects. Prenatal levels of nonessential metals have been associated with adult obesity, insulin resistance and leptin5–7. For instance, cadmium (Cd) may induce dysglycemia in type II diabetes8, while arsenic (As) has been associated with increased diabetes risk in adults and children9. Essential metals have also been implicated in cardio-metabolic risk in adult and child populations10–12. A study in 6–19 year old children found a positive association between manganese (Mn) and copper (Cu) and obesity10, and high selenium (Se) has been linked to increased risk of metabolic syndrome11,12. In contrast, vitamin B12 (a micronutrient containing cobalt (Co)) deficiency during pregnancy is linked with higher insulin resistance in children13. Thus, associations between metals with cardio-metabolic risk remain uncertain.
Furthermore, individuals are frequently exposed to metals in mixtures, complicating analysis with high exposure correlations and high dimensional data. Mixture models are necessary to realistically examine impacts of metals on cardio-metabolic risk. Currently, few studies investigating metal mixtures and CVD risk address exposure during pregnancy with later impacts during childhood.
Bayesian Kernel Machine Regression is a novel statistical method that addresses interactions and non-linear relationships by flexibly modeling exposures14,15. Here, we employ the method to examine the prospective relationship between 11 metals (arsenic (As), cadmium (Cd), cobalt (Co), chromium (Cr), cesium (Cs), copper (Cu), manganese (Mn), lead (Pb), antimony (Sb), selenium (Se) and zinc (Zn)) in 2nd trimester maternal blood and ten cardio-metabolic risk factors in 4–6-year-old children. The objectives were to examine the 1) relationship between prenatal metal concentrations and child cardio-metabolic risk factors; 2) overall effects of prenatal metals mixture (essential vs. nonessential); and 3) interactions between metals. Bayesian Kernel Machine Regression is uniquely suited to address these objectives – it does not require a predefined function for each exposure–response curve, and it examines interactions between metals without a priori deciding on the individual interaction terms to include in the model.
Methods
Study participants
We used data from the Programming Research in Obesity, Growth Environment and Social Stress (PROGRESS) birth study, a prospective birth cohort that enrolled pregnant women before 20 weeks gestation between 2007 and 2011 in Mexico City, Mexico. The details of enrollment have been previously described16,17. In brief, 948 of 1054 women were followed until birth. Between 4–6 years of age, 609 children presented for follow-up and clinical measurements (height, bioimpedence, etc.). Blood was provided by 466 children for plasma measurements. Covariates described below did not differ between mothers in the entire study population versus mothers reporting for follow-up (results not shown). All study protocols were approved by the institutional review boards of the participating institutions (Icahn School of Medicine human subject’s management #12–00751, Instituto Nacional de Salud Pública project #560, and Columbia University Human Research Protection Office protocol #AAAR0689).
Clinical Measurement Data collection
At the 4–6 year visit, trained staff collected child weight and standing height using a professional digital scale (Health-o-meter). We estimated percent body fat (total fat mass divided by total body mass) using Tetrapolar bioelectrical impedance with the InBody 370 or 230 (Biospace Co, Ltd). Children’s resting blood pressure (BP) (systolic and diastolic) was measured using an automated Spacelabs Healthcare, Ultralite Ambulatory 90217 monitor (WA, USA). After 3 minutes of rest, BP was measured using with a child-sized cuff, taking two measurements 3 minutes apart.
Measurement of maternal blood metals
Second trimester blood samples were collected at enrollment into trace metal-free tubes and stored at −20oC until analysis. Metals were analyzed as previously described for Pb18. In brief, blood was digested in concentrated HNO3 and 30% H2O2 then analyzed on an Agilent 8800 ICP Triple Quad (ICP-QQQ) instrument (Agilent technologies, Inc., Delaware, USA) in MS/MS mode. Quality control measures were as previously described18. The limits of detection (LOD) and the % metals below the LOD are presented in Table 2. For measurements below the calculated LOD value, measured values – which are often censored in lab outputs and data analyses – were available and were used in the analysis instead of a constant, e.g. LOD/√216,19.
Table 2.
Blood metals concentrations (µg/dl) in mother’s during 2nd trimester pregnancy, the range of instrument limit of detection (LOD) values between runs and the percent of metals below the LOD. Measured values below the LOD were included in the calculations and analyses.
| Metal | Mean ± SD | Range | LOD range | % Below LOD |
|---|---|---|---|---|
| As | 0.085 ± 0.058 | 0.028 ─ 0.77 | 0.017 ─ 0.060 | 9.1 |
| Cd | 0.029 ± 0.019 | 0.006 ─ 0.16 | 0.003 ─ 0.010 | 17 |
| Co | 0.022 ± 0.024 | 0.004 ─ 0.35 | 0.002 ─ 0.013 | 52 |
| Cr | 0.080 ± 0.128 | 0.001 ─ 1.4 | 0.026 ─ 0.23 | 84 |
| Cs | 0.310 ± 0.135 | 0.034 ─ 1.1 | 0.008 ─ 0.032 | 0.0 |
| Cu | 158± 32 | 79 ─ 422 | 2.8 ─ 0.063 | 0.0 |
| Mn | 1.5 ± 0.50 | 0.41 ─ 3.8 | 0.023 ─ 0.081 | 5.3 |
| Pb | 3.7 ± 2.7 | 0.75 ─ 18 | 0.209 ─ 0.003 | 0.18 |
| Sb | 0.38 ± 0.10 | 0.18 ─ 1.1 | 0.005 ─ 0.030 | 0.0 |
| Se | 25 ± 4.5 | 12.4 ─ 65.2 | 0.030 ─ 0.10 | 0.0 |
| Zn | 613 ± 130 | 288 ─ 1516 | 2.500 ─ 0.23 | 0.0 |
Measurement of child lipids, adipokines and Hemoglobin A1C
At the 4–6 year visit, each child’s blood was collected and prepared per standard protocol. Children were not asked to fast due to their young age. Glycosylated hemoglobin A1C (HbA1c) was measured by a Miura 200 automated analyzer (ISE S.r.l., Rome, Italy). We used enzymatic methods to measure total cholesterol, high-density lipoprotein (HDL) cholesterol, and triglycerides (Roche Diagnostics, Indianapolis, IN). Non-HDL cholesterol (Non-HDL C) is a good predictor of future adult dyslipidemia20 and was calculated by subtracting HDL from total cholesterol. Because of their susceptibility to non-fasting measurements, triglyceride values greater than ± 6 standard deviations (SD) were removed from the analysis (n = 3)2. We measured leptin and adiponectin by ultrasensitive ELISA (R&D Systems, Minneapolis, MN; and ALPCO Diagnostics Inc. Salem, NH, respectively). Coefficients of variation were less than 2% for all measurements.
Statistical Analysis
Blood metals were right-skewed and natural log (ln)-transformed to improve model fit. They were then centered to achieve an equal scale, then trimmed to ± 6 SD, as Bayesian Kernel Machine Regression and linear regression are both sensitive to extreme values. Trimming removed two values from As, and one from Cs, Cr, Cs, Cu, Sb, Se, and Zn, belonging to two individuals. We estimated Spearman’s correlation coefficients between individual metals. Certain cardio-metabolic outcomes were also right skewed and leptin and triglycerides were ln-transformed to improve model fit. Adiponectin was less skewed and a square root transformation was the most appropriate for the model. Body mass index (BMI) z-score was calculated according to the WHO guidelines21. Systolic and diastolic BP percentile z-scores were calculated according to the American Academy for Pediatrics Guidelines22. Sex-specific and 1-year age-bracketed z-scores were calculated for all other outcomes. Global cardio-metabolic risk scores have been previously used to estimate overall childhood risk based on five metrics that span different types of risk23,24. In this study, we averaged the z-scores for systolic BP, HbA1c, percent body fat, triglycerides, and non-HDL cholesterol to calculate a global risk score.
All statistical analysis were performed in R version 3.4.025.
Covariates
We obtained information from baseline questionnaires or field measurements as covariates. Birth weight was recorded from the infant’s discharge sheet and gestational age was calculated from the last menstrual period. Maternal age, pre-pregnancy BMI (weight in kg/height in m2), education (< high school, high school, or > high school), socioeconomic status (low, middle or high), parity (primiparous or multiparous), and environmental tobacco smoke (present or absent in home) were included as covariates based on previous studies18. For some outcomes (HbA1c, global risk score, non-HDL cholesterol, systolic BP and diastolic BP), date of follow-up visit was found to be a predictor of the outcome. Although date of visit does not precede exposure, and in this sense it cannot be a confounder, it is directly linked to the calendar time of the 2nd trimester and can thus be used as a surrogate for long-term trends in the outcome and exposure, which is a potential confounder. Date was subsequently modeled with natural splines to the best model fit for individual outcomes (HbA1c: six knots; non-HDL cholesterol: four knots; global risk score: three knots; and systolic and diastolic BP: cubic polynomial). Knots were chosen based on the lowest Akaike’s Information Criterion (AIC) values. Covariates were complete for all individuals, except for environmental tobacco smoke (n = 6). Six women reported smoking during pregnancy. These 12 individuals were removed from the analysis.
Linear Regressions
We used multivariable linear regression models to estimate associations of individual metals (Single-metal models) and all metals (Multi-metal models) with each continuous z-scored outcome. Variance inflation factors were estimated for multi-metal models to assess the extent of collinearity between metals, and none was detected. All linear models were adjusted for all covariates.
Bayesian Kernel Machine Regression
We determined that, given our objectives, the novel statistical approach, BKMR, was the best mixture method available26. BKMR is unique in that it flexibly models the exposure – response function for each relationship without prior specification of the function allowing for potential non-linear associations and interactions between metals (For detailed methods see14,15). The model used in this study is below:
The function h()is modeled using a Gaussian kernel exposure–response machine function which allows for inclusion of the interaction terms. The coefficients βT are the effect estimates of the -th covariate for the th individual. The function represents the natural splines for date of visit, using knots as described above. Residuals are represented by i. Intuitively, the Gaussian kernel assumes that two subjects with similar exposure profiles will have more similar cardio-metabolic risk profiles, and this similarity is measured using the kernel function. Without Bayesian Kernel Machine Regression, it would be challenging to manually set base functions for h(). For instance, if we were to allow in a more traditional analysis for nonlinearity and include all interaction terms in a spline model with 3 degrees of freedom, we would require approximately four million parameters ((1 + DF)metals – 1). The method handles this complexity by using a kernel exposure–response machine representation for h(). We used non-informative priors for all model parameters.
Once fitted, model summary statistics are provided on the estimation of the exposure–response function and confidence intervals (CI) for each metal, the overall associations of total metals levels with the outcome, and the interactions between each metal pair. We ran ten Bayesian Kernel Machine Regression models with child global risk score, BMI, HbA1c, non-HDL cholesterol, triglycerides, systolic BP, diastolic BP, percent body fat, leptin, or adiponectin as the outcome. Sample sizes are provided in Table 1. All models were adjusted for all covariates.
Table 1.
Descriptive characteristics of study participants
| Characteristic | N | Mean ± SDa | Range |
|---|---|---|---|
| Cardio-metabolic Risk Outcomes at 48 Months | |||
| Child BMI (kg/m2) | 548 | 16 ± 1.8 | 11 ─ 26 |
| Percent Body Fat | 541 | 24 ± 6.2 | 3.0 ─ 48 |
| Systolic Blood Pressure | 544 | 86 ± 7.3 | 67 ─ 120 |
| Diastolic Blood Pressure | 544 | 53 ± 5.8 | 35 ─ 76 |
| Triglycerides (mg/dl) | 417 | 80 ± 35 | 25 ─ 370 |
| HbA1C (%) | 419 | 5.2 ± 0.40 | 3.3 ─ 6.6 |
| Non-HDL Cholesterol (mg/dl) | 420 | 113 ± 25 | 34 ─ 202 |
| Leptin (ng/ml) | 415 | 3.2 ± 3.3 | 0.11 ─ 29 |
| Adiponectin (ng/ml) | 415 | 15455 ± 7072 | 716 ─ 45053 |
| Global metabolic risk score | 408 | 0.005 ± 0.5 | −1.3 ─ 1.8 |
| Child Characteristics | |||
| Gestational Age (weeks) | 548 | 38 ± 1.7 | 29 ─ 43 |
| Birth weight (kg) | 548 | 3.1 ± 0.44 | 1.1 ─ 4.2 |
| Child age at 48mo visit (yrs) | 548 | 4.8 ± 0.55 | 4.0 ─ 6.8 |
| Male | 276 | ||
| Female | 272 | ||
| Maternal Characteristics at Enrollment | |||
| Age | 548 | 28 ± 5.6 | 18 ─ 44 |
| Pre-pregnancy BMI (kg/m2) | 548 | 26 ± 4.1 | 18 ─ 44 |
| Primiparous: Yes | 210 | ||
| Primiparous: No | 338 | ||
| Socioeconomic Status: Low | 224 | ||
| Socioeconomic Status: Middle | 201 | ||
| Socioeconomic Status: High | 123 | ||
| Education: Less than high school | 281 | ||
| Education: High school | 214 | ||
| Education: College | 53 | ||
| Second Hand Smoke: No | 384 | ||
| Second Hand Smoke: Yes | 164 |
Standard Deviation
Bayesian Kernel Machine Regression results are presented as: 1) cumulative metals associations with outcomes; 2) single metal exposure – responses; and 3) interactions between metals. Cumulative metal associations are displayed as the change in effect estimate comparing all metals at their median concentrations (reference) to their concentrations each 5th percentile from the 25th to the 75th percentile. Univariate exposure–response plots allow for assessment of linearity with 95% CI’s. Interactions between individual metals can be assessed by modeling each metal with the response at three quartiles of each other metal (10th, 50th, and 90th). In this estimation, an alteration in the dose–response curve of one metal at a different quartile of another signifies an interaction, while parallel lines indicate no interaction.
We hypothesized that essential metals would have disparate impacts on cardio-metabolic risk factors compared with nonessential metals. We constructed hierarchical BKMR models that grouped metals into essential (Cu, Co, Mn, Se, Zn) and nonessential (As, Cd, Cs, Cr, Pb, and Sb). Each group is modeled separately within a single function and account for within-group mixtures and variation. The hierarchical analysis provides information on group posterior inclusion probabilities, which are indicators of the contribution of each group for each outcome. The hierarchical model will still estimate interactions between metals across groups and will model each metal-response function as in the nonhierarchical analysis. We also modeled essential and nonessential metals independently with Bayesian Kernel Machine Regression to better assess their separate impacts.
Sensitivity analyses
We performed four sensitivity analyses: 1) we used untrimmed metals datasets to evaluate the impact of possible outliers; 2) we excluded metals with greater 50% of values below the LOD to ensure that these were not influencing the solution; 3) we added birth weight, gestational age, and sex to the model as covariates; 4) we included BMI z-score as a covariate for the plasma biomarker outcomes to ensure that obesity was not impacting our results.
Results
Study Population Characteristics
The study population included the 548 mother–child pairs with complete information in the largest multi-metal model (Table 1). The cardio-metabolic risk factor information and sample size for each model are presented in Table 1. The average maternal age at enrollment was 28 years with the majority of low economic status (51%) and with a high school degree or less (77%). Children were split evenly between male and female, with an average age of 4.8 years at follow-up. Blood concentrations of metals in the 2nd trimester in the population of 548 mothers, and the percent of measurements below the LOD, are in Table 2. Co and Cr had greater than 50% of metals below the LOD (52% and 84%, respectively). Spearman’s correlation coefficients indicated correlations between each pair of metals (Figure 1). The strongest correlations detected were between Zn and Se ( = 0.48), Zn and Cu (= 0.46) and Se and Cu ( = 0.42).
Figure 1.
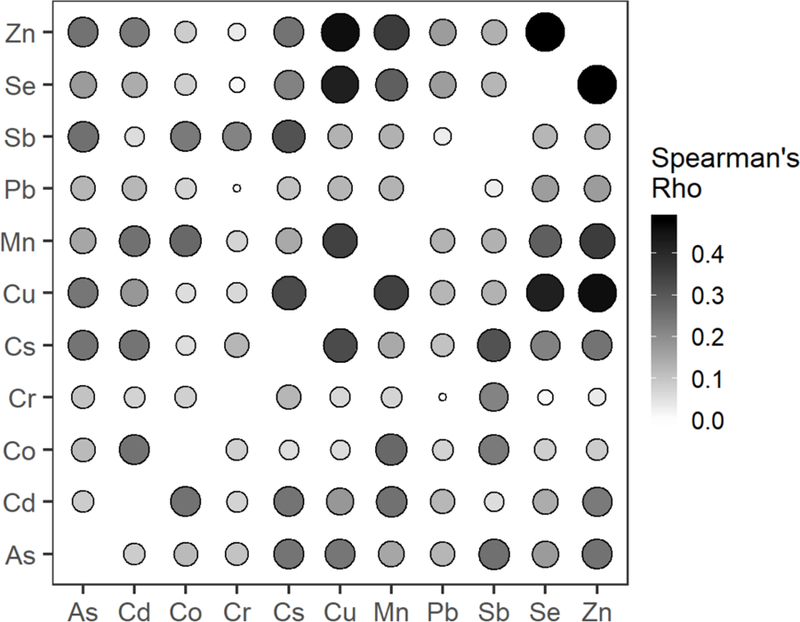
Spearman’s correlation matrix of maternal blood metals taken during the second trimester. Size and shading of cells are proportional to the Spearman’s rho.
Multivariable Linear Regression Models
Because of the large number of comparisons performed in this analysis, in the text we report results with strong evidence of an association throughout our analyses. All results can be found in the supplemental content. In single-metal linear models, prenatal Cu was associated with lower child BMI z-score (β = −0.52 standard deviations (SD) per 1 unit ln metal increase and 95% CI: −1.0, −0.02). Prenatal Se was associated with triglycerides (β = −0.68 and 95% CI: −1.3, −0.1). Mn was associated with HbA1c (β = −0.28 and 95% CI: −0.53, −0.03). Zn was associated with non-HDL cholesterol (β = 0.51 and 95% CI: 0.03, 0.99). Finally, As, Cu and Sb were associated with leptin (As: β = −0.26 and 95% CI: −0.46, −0.03; Cu: β = −0.7 and 95% CI: −1.2, −0.15; Sb: β = −0.56 and 95% CI: −0.95, −0.16) (Figure 2). In multi-metal linear models, prenatal Se was negatively associated with child triglycerides (β = −1.0 SDs and 95% CI: −1.8, −0.18) and Mn with HbA1c (β = −0.32 and 95% CI: −0.61, −0.03). Full results are in Supplemental Digital Content (SDC) 1, eTables 1 and 2.
Figure 2.

Heatmap of beta values for associations between each metal and cardio-metabolic risk factor from single-metal linear models and multi-metal linear models. Gradient corresponds to the absolute beta value magnitude, while the direction of the triangle indicates the positive or negative direction, and the size of the triangle corresponds to the standard error (SE) of the estimate. All raw values with confidence intervals can be found in Supplemental Digital Content 1, eTables 1 and 2.
Bayesian Kernel Machine Regression Models
We observed a decrease in HbA1c, systolic BP, and circulating factor adiposity risk (decreased leptin risk and increased adiponectin risk) with total metals (Figure 3). Higher metals quantiles were associated with greater non-HDL cholesterol.
Figure 3.
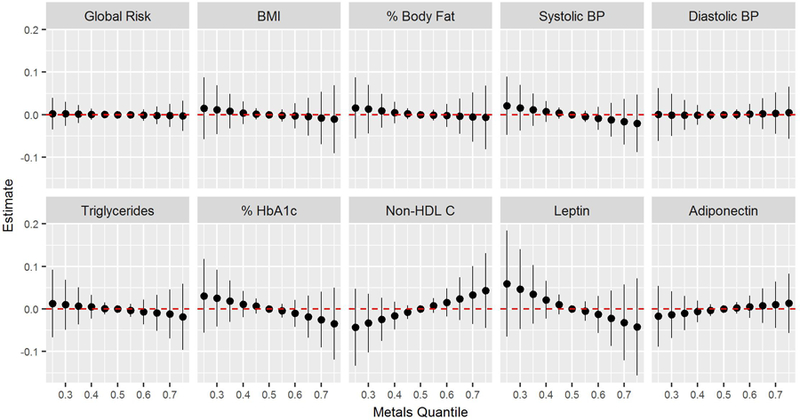
Joint effects of metal mixture on global risk score, BMI, percent body fat , systolic BP, diastolic BP, triglycerides, % HbA1c, Non-HDL cholesterol, leptin and adiponectin. Graphs depict the difference in the effect estimate from the median (reference) between metals at 5% intervals from the 25th percentile to the 75th percentile with 95% CI.
Triglycerides were negatively associated with Se (Figure 4A). The association of Mn with HbA1c detected in linear models was slightly diminished in the Bayesian Kernel Machine Regression models (Figure 4B). Sb and As had negative associations with leptin levels (Figure 4C). Negative relationships between percent body fat and Cs were present at the mean Cs value (SDC 2, eFigure 1E). Cr appears to have a U-shaped relationship with percent body fat and leptin, however, given that 84% of Cr values were below the LOD, this association may be an artifact. No other associations between metals and outcomes were detected (SDC 2, eFigure 1). Although interaction plots suggested that certain metals interacted with Cr on some outcomes, this may be due to the large number of values below the LOD (SDC 2, eFigure 2). No interactions were observed between any other metals.
Figure 4.

Univariate exposure-response plots with the 95% CI for the effect each metal when others are fixed at their median on A) triglycerides, B) HbA1c, and C) leptin.
Hierarchical Bayesian Kernel Machine Regression
Essential metals had greater posterior inclusion probabilities than nonessential metals for all outcomes except leptin (Figure 5A), which is likely driven by individual associations with As and Sb. Associations of individual metals with outcomes were consistent with the main analysis (SDC 2, eFigure 13).
Figure 5.

Results from secondary analyses on essential and nonessential metals. A) Posterior inclusion probabilities (PIPs) for essential (gray) and nonessential (black) metals in hierarchical BKMR. B) Overall risk of essential (circles) and nonessential (triangles) metals on child triglycerides and non-HDL cholesterol when run in separate BKMR models.
Essential metals trended toward a greater cumulative impact on triglycerides and non- HDL cholesterol (Figure 5B). Negative associations of Cs and Cu were detected with BMI when essential and nonessential metals were modeled separately (SDC 2, eFigure 15B). Similarly, we detected an additional association between Cu and percent body fat in essential metal models. The negative association of HbA1c and Mn was present in essential models. Overall associations of leptin with cumulative metals were negative for both essential and nonessential metals. We also noted an additional association of leptin with Cu in essential models.
Sensitivity analyses
Exclusion of Cr and Co decreased the effect of Mn on HbA1c to −0.23 in multi-metal linear models. No other associations were altered (SDC 2, eFigure 16 and 17).
Inclusion of child BMI z-score as a covariate increased the negative association of Sb on leptin to −0.51 in multi-metal linear models. Similarly, in Bayesian Kernel Machine Regression models, inclusion of child BMI increased the association between Sb and leptin and increased the negative trend of total metals on overall leptin risk (Figure 4; SDC 2, eFigure 18 and 19). BMI did not impact any other findings.
Including child sex, birthweight, and gestational age in the models did not alter our results (SDC 2, eFigure 20 and 21).
In multi-metal linear regression models, the use of all metals values, including those outside the 6 standard deviation range, did not alter the results. However, untrimmed metals in Bayesian Kernel Machine Regression models increased the estimated impact of maternal As on child BMI, % HbA1c, leptin, and systolic BP, suggesting that the Bayesian Kernal Machine Regression solution is sensitive to the two extreme values (SDC 2, eFigure 22 and 23).
A summary of the associations of blood metals with cardio-metabolic risk factors for each analysis can be found in Table 3 for clarity.
Table 3.
Summary of results from linear models, BKMR, hierarchical BKMR, and interactions of metals with child sex, as well as robustness to sensitivity analyses. Dash indicates no main association present.
| Risk Factor | Linear Regressions | BKMR | Overall mixture | Hierarchical BKMR | Interaction with Sex | Sensitivity Analyses |
|---|---|---|---|---|---|---|
| Global Risk | - | - | - | - | - | Assoc. with Mn is eliminated in all sensitivity analyses |
| BMI | - | - | - | Negative assoc. with Cs and Cu | Negative assoc. with Cs in girls | Assoc. with untrimmed As. |
| Percent Body Fat | - | Negative assoc. with Cs | - | Negative assoc. with Cs and Cu | - | No change |
| Systolic BP | - | - | Negative assoc. | - | - | Assoc. with untrimmed As |
| Diastolic BP | - | - | - | - | - | - |
| Triglycerides | Negative assoc. with Se | Negative assoc. with Se | - | Negative assoc. with Se | Negative effect of Se in girls | No change |
| HbA1c | Negative assoc. with Mn | Negative assoc. with Mn | Negative assoc. | Negative assoc. with Mn | - | Assoc. with untrimmed As. Removal of Cr and Co decreased effect of Mn in linear models. |
| Non-HDL Cholesterol | - | - | Positive assoc. | - | Positive assoc. with total metals in boys | No change |
| Leptin | - | Negative assoc. with Sb and As | Negative assoc. | Negative assoc. with Sb, Cu, and As | - | Assoc. with Sb increased when BMI was added as a covariate |
| Adiponectin | - | - | Positive assoc. | - | - | No change |
BKMR indicates Bayesian Kernel Machine Regression
Discussion
We used Bayesian Kernel Machine Regression to model the association between blood concentrations of 11 metals during pregnancy and ten cardio-metabolic risk factors in children at 4–6 years of age. Generally, we found that prenatal metals were negatively associated with cardio-metabolic risk factors in children, except for non-HDL cholesterol (Table 3). These associations were driven primarily by essential metals, apart from leptin, which was associated with nonessential metals. Using the Bayesian Kernel Machine Regression method, which is able to detect interactions between parameters and non-linear responses, we observed no interactions between metals and all linear associations.
In general, the direction of the response was consistent between Bayesian Kernel Machine Regression and linear models, which is expected considering the linearity of our responses. However, we observed some inconsistencies (Table 3). Although the negative relationship between prenatal Se and child triglycerides was present in both types of models, the negative association between Mn and HbA1c that was detected in linear models was slightly attenuated in the main Bayesian Kernel Machine Regression analysis. In contrast, the association between Sb and As and leptin was borderline in linear regression models, but strong in the Bayesian models. There were also discrepancies between single-metal and multi-metal linear models. Differences between models could be caused by several factors, including co-metal confounding, or potential collinearity in the multi-metal linear models, which would result in larger CIs. For example, Zn was moderately correlated with other essential metals. Effect estimates for the relationships between Zn and Non-HDL cholesterol in single-metal linear models changed by greater than 25% in multi-metal linear models, suggesting that the association may be due to confounding by other metals. This is supported by the observation that these associations were not maintained in Bayesian Kernel Machine Regression. In contrast, Cs was borderline associated with percent body fat in single-metal linear models, however, it was not associated in multi-metal linear models due to large confidence intervals and the effect estimate was unchanged. This relationship was supported by an association detected by Bayesian Kernel Machine Regression. These complex associations highlight the importance of mixture models like Bayesian Kernel Machine Regression, particularly with collinear and high-dimensional data.
In this population, the overall response associated with greater metals exposure during pregnancy was a trend toward lower CVD risk for most outcomes. Essential micronutrients play key roles in development and physiologic processes. Maternal micronutrient deficiency during pregnancy has been linked with later life metabolic and vascular diseases 27,28, and our results are consistent with findings on prenatal famine, which has been found to be associated with adult glucose intolerance, altered lipid profiles, and obesity29.
Studies on exposure to nonessential metals and cardio-metabolic risk factors are mixed. A study in Bangladesh found that while longitudinal childhood Cd and As were inversely associated with child weight and height at 5 years, there was no association of prenatal metal concentrations with later childhood anthropometry30. In a study examining maternal As, Pb, Cd and Hb with cord blood leptin and adiponectin, Pb was associated with high leptin5.. Mice exposed to Pb during development had greater food intake and greater percent body fat, particularly in males6. Lead exposure in Mexico continues to be a major public health problem31. However, in our study population a negative association between 3rd trimester Pb and child weight-for-age z-score was reported, but no associations were found with child BMI z-score or percent body fat18. Similarly, we observed no association between Pb and any outcome.
One robust finding from our analysis was the inverse relationship between Se status during pregnancy and child triglycerides. A U-shaped dose–response between Se and triglycerides was observed in 1159 US adults32. A study investigating the connection between cord blood Cu and Se with cord blood lipids in 274 infants found a positive relationship between triglycerides and Cu, but no relationship with Se33. Our findings are not consistent with these reports.
We also observed a negative association between prenatal As and Sb and child leptin. One study found a positive association between maternal urinary As and cord blood leptin34, in contrast to the negative association observed here. To our knowledge there are no studies to date examining the impact of prenatal Sb on cardio-metabolic risk. Investigators examining multiple metals in adults found positive associations between Sb and diabetes35,36 and Sb and peripheral artery disease37, yet no association with adult obesity38. Our sensitivity analyses revealed that the inclusion of child BMI z-score as a covariate in models with leptin and Sb increased the negative association between them. Leptin is secreted by adipocytes39. Thus, although the relationship between Sb and child BMI was not strong, it is possible that child adiposity may mediate the effect of Sb on leptin.
Our analysis also detected a negative association between maternal Mn and childhood HbA1c levels. Manganese is an essential metal with a notable role in the antioxidant enzyme Mn super oxide dismutase (MnSOD). Polymorphisms in the MnSOD gene have been linked to diabetes mellitus and diabetic complications in adults40. In rodent models, knockout of MnSOD leads to impaired glucose stimulated insulin secretion, possibly through altered glucose transporter expression41. Currently, no studies investigate the relationship between prenatal Mn and child glucose homeostasis in humans. In a population of Korean adults low Mn was associated with higher prevalence of diabetes and renal dysfunction42.
This study has several limitations. First, only whole blood metal measurements were available, and while blood is an accurate long-term measurement of certain metals, others are rapidly cleared from blood, rendering it a poor marker of exposure. Second, due to the age of the children, lipid values in this study are non-fasting, which may influence our results. Furthermore, we only assessed metals status at one prenatal time point. We did not account for multiple comparisons for the large number of predictors and outcomes. The large number of associations examined could result in spurious findings. However, our conclusions are not based on statistical significance, but consistency of results across models and methods. Finally, we were unable to account for other potential confounders during pregnancy, such as deficient maternal nutrition, as this data was unavailable.
The study had notable strengths, including recruitment of women during pregnancy, prospective follow-up with high retention rate, and availability of multiple cardio-metabolic measurements. Furthermore, the primary strength of our analysis is the flexibility of the Bayesian Kernel Machine Regression model to assess additive and complex interactions in a mixture.
Follow-up analyses will benefit from ongoing collection of cardio-metabolic risk factor data in this cohort. Additional studies in this and other cohorts are warranted to confirm our results. An analysis including multiple time points could help to identify a susceptible period to essential metals deficiency. Further investigation into the mechanisms behind these relationships is also warranted.
Conclusions
In this study, prenatal levels of selected metals were associated with lower cardio-metabolic risk in children at 4–6 years. Associations with essential metals were greater than nonessential metals. To date, few studies have investigated effects of prenatal metal mixtures on childhood cardio-metabolic risk. Bayesian Kernel Machine Regression allowed us to address associations with the metals mixture both overall and also assess metal-specific exposure–response curves, while accounting for metal–metal confounding and high-dimensionality. Further research is needed to unravel the complex relationship of metals on child cardio-metabolic risk factors. Application of this model longitudinally will be key to characterizing associations between prenatal metal concentrations and child cardio-metabolic risk.
Supplementary Material
Acknowledgments:
The authors would like to acknowledge the American British Cowdray Hospital in Mexico City, Mexico, for providing research facilities
Sources of Funding: “The results reported herein correspond to specific aims of grant R01ES021357 to investigator AA Baccarelli from NIEHS. This work was also supported by grants P30ES009089, P30ES023515, and R24ES028522 from NIEHS. Co-Investigators and staff at the INSP were also supported and received partial funding from the National Institute of Public Health/Ministry of Health of Mexico.
Footnotes
Availability of data and code for replication: Due to confidentiality issues, data can be made available upon acceptance of a material transfer agreement and Institutional Review Board Approval from the corresponding author. R code for data processing will not be useful without the data, but can be sent if data access is approved. R code for Bayesian Kernel Machine Regression analysis can be provided by request from the corresponding author.
The authors declare no competing financial interests.
Additional Information:
Supplemental Digital Content 1. Tables of full results of linear models and BKMR posterior inclusion probabilities. xlsx
Supplemental Digital Content 2. Figures of full BKMR results and sensitivity analyses. pdf
References:
- 1.The GBD 2015 Obesity Collaborators. Health Effects of Overweight and Obesity in 195 Countries over 25 Years. N Engl J Med 2017;377(1):13–27. doi: 10.1056/NEJMoa1614362 [DOI] [PMC free article] [PubMed] [Google Scholar]
- 2.Daniels SR, Greer FR. Lipid Screening and Cardiovascular Health in Childhood. Pediatrics 2008;122(1):198–208. doi: 10.1542/peds.2008-1349 [DOI] [PubMed] [Google Scholar]
- 3.Kelishadi R, Poursafa P. A Review on the Genetic, Environmental, and Lifestyle Aspects of the Early-Life Origins of Cardiovascular Disease. Curr Probl Pediatr Adolesc Health Care 2014;44(3):54–72. doi: 10.1016/j.cppeds.2013.12.005 [DOI] [PubMed] [Google Scholar]
- 4.Singhal A, Lucas A. Early origins of cardiovascular disease: is there a unifying hypothesis? The Lancet 2004;363(9421):1642–1645. doi: 10.1016/S0140-6736(04)16210-7 [DOI] [PubMed] [Google Scholar]
- 5.Ashley-Martin J, Dodds L, Arbuckle TE, et al. Maternal blood metal levels and fetal markers of metabolic function. Environ Res 2015;136:27–34. doi: 10.1016/j.envres.2014.10.024 [DOI] [PubMed] [Google Scholar]
- 6.Faulk C, Barks A, Sánchez BN, et al. Perinatal Lead (Pb) Exposure Results in Sex-Specific Effects on Food Intake, Fat, Weight, and Insulin Response across the Murine Life-Course. PLOS ONE 2014;9(8):e104273. doi: 10.1371/journal.pone.0104273 [DOI] [PMC free article] [PubMed] [Google Scholar]
- 7.Leasure JL, Giddabasappa A, Chaney S, et al. Low-level human equivalent gestational lead exposure produces sex-specific motor and coordination abnormalities and late-onset obesity in year-old mice. Environ Health Perspect 2008;116(3):355–361. doi: 10.1289/ehp.10862 [DOI] [PMC free article] [PubMed] [Google Scholar]
- 8.Edwards J, Ackerman C. A Review of Diabetes Mellitus and Exposure to the Environmental Toxicant Cadmium with an Emphasis on Likely Mechanisms of Action. Curr Diabetes Rev 2016;12(3):252–258. doi: 10.2174/1573399811666150812142922 [DOI] [PMC free article] [PubMed] [Google Scholar]
- 9.Maull EA, Ahsan H, Edwards J, et al. Evaluation of the Association between Arsenic and Diabetes: A National Toxicology Program Workshop Review. Environ Health Perspect 2012;120(12):1658–1670. doi: 10.1289/ehp.1104579 [DOI] [PMC free article] [PubMed] [Google Scholar]
- 10.Fan Y, Zhang C, Bu J. Relationship between Selected Serum Metallic Elements and Obesity in Children and Adolescent in the U.S. Nutrients 2017;9(2). doi: 10.3390/nu9020104 [DOI] [PMC free article] [PubMed] [Google Scholar]
- 11.Ogawa-Wong AN, Berry MJ, Seale LA. Selenium and Metabolic Disorders: An Emphasis on Type 2 Diabetes Risk. Nutrients 2016;8(2). doi: 10.3390/nu8020080 [DOI] [PMC free article] [PubMed] [Google Scholar]
- 12.Zeng M-S, Li X, Liu Y, et al. A high-selenium diet induces insulin resistance in gestating rats and their offspring. Free Radic Biol Med 2012;52(8):1335–1342. doi: 10.1016/j.freeradbiomed.2012.01.017 [DOI] [PMC free article] [PubMed] [Google Scholar]
- 13.Yajnik CS, Deshpande SS, Jackson AA, et al. Vitamin B<Subscript>12</Subscript> and folate concentrations during pregnancy and insulin resistance in the offspring: the Pune Maternal Nutrition Study. Diabetologia 2008;51(1):29–38. doi: 10.1007/s00125-007-0793-y [DOI] [PMC free article] [PubMed] [Google Scholar]
- 14.Bobb JF, Valeri L, Claus Henn B, et al. Bayesian kernel machine regression for estimating the health effects of multi-pollutant mixtures. Biostatistics 2015;16(3):493–508. doi: 10.1093/biostatistics/kxu058 [DOI] [PMC free article] [PubMed] [Google Scholar]
- 15.Valeri L, Mazumdar MM, Bobb JF, et al. The Joint Effect of Prenatal Exposure to Metal Mixtures on Neurodevelopmental Outcomes at 20–40 Months of Age: Evidence from Rural Bangladesh. Environ Health Perspect 2017;125(6):067015. doi: 10.1289/EHP614 [DOI] [PMC free article] [PubMed] [Google Scholar]
- 16.Braun JM, Wright RJ, Just AC, et al. Relationships between lead biomarkers and diurnal salivary cortisol indices in pregnant women from Mexico City: a cross-sectional study. Environ Health Glob Access Sci Source 2014;13(1):50. doi: 10.1186/1476-069X-13-50 [DOI] [PMC free article] [PubMed] [Google Scholar]
- 17.Burris HH, Braun JM, Byun H-M, et al. Association between birth weight and DNA methylation of IGF2, glucocorticoid receptor and repetitive elements LINE-1 and Alu. Epigenomics 2013;5(3):271–281. doi: 10.2217/epi.13.24 [DOI] [PMC free article] [PubMed] [Google Scholar]
- 18.Renzetti S, Just AC, Burris HH, et al. The association of lead exposure during pregnancy and childhood anthropometry in the Mexican PROGRESS cohort. Environ Res 2017;152(Supplement C):226–232. doi: 10.1016/j.envres.2016.10.014 [DOI] [PMC free article] [PubMed] [Google Scholar]
- 19.Chen Q, Garabrant DH, Hedgeman E, et al. Estimation of background serum 2,3,7,8-TCDD concentrations by using quantile regression in the UMDES and NHANES populations. Epidemiol Camb Mass 2010;21 Suppl 4:S51–57. doi: 10.1097/EDE.0b013e3181ce9550 [DOI] [PubMed] [Google Scholar]
- 20.Srinivasan SR, Frontini MG, Xu J, Berenson GS. Utility of Childhood Non–High-Density Lipoprotein Cholesterol Levels in Predicting Adult Dyslipidemia and Other Cardiovascular Risks: The Bogalusa Heart Study. Pediatrics 2006;118(1):201–206. doi: 10.1542/peds.2005-1856 [DOI] [PubMed] [Google Scholar]
- 21.de Onis M, World Health Organization (WHO). WHO Child Growth Standards: Length/Height-for-Age, Weight-for-Age, Weight-for-Length, Weight-for-Height and Body Mass Index-for-Age: Methods and Development Geneva: WHO Multicentre Growth Reference Study Group; 2006. http://www.who.int/childgrowth/publications/technical_report_pub/en/. Accessed February 19, 2018. [Google Scholar]
- 22.Flynn JT, Kaelber DC, Baker-Smith CM, et al. Clinical Practice Guideline for Screening and Management of High Blood Pressure in Children and Adolescents. Pediatrics August 2017:e20171904. doi: 10.1542/peds.2017-1904 [DOI] [PubMed] [Google Scholar]
- 23.Sen S, Rifas-Shiman SL, Shivappa N, et al. Associations of prenatal and early life dietary inflammatory potential with childhood adiposity and cardiometabolic risk in Project Viva. Pediatr Obes 2017:n/a-n/a. doi: 10.1111/ijpo.12221 [DOI] [PMC free article] [PubMed] [Google Scholar]
- 24.Viitasalo A, Lakka TA, Laaksonen DE, et al. Validation of metabolic syndrome score by confirmatory factor analysis in children and adults and prediction of cardiometabolic outcomes in adults. Diabetologia 2014;57(5):940–949. doi: 10.1007/s00125-014-3172-5 [DOI] [PubMed] [Google Scholar]
- 25.R Core Team. R: A Language and Environment for Statistical Computing Vienna, Austria: R Foundation for Statistical Computing; 2018. https://www.R-project.org/. [Google Scholar]
- 26.Taylor KW, Joubert BR, Braun JM, et al. Statistical Approaches for Assessing Health Effects of Environmental Chemical Mixtures in Epidemiology: Lessons from an Innovative Workshop. Environ Health Perspect 2016;124(12):A227–A229. doi: 10.1289/EHP547 [DOI] [PMC free article] [PubMed] [Google Scholar]
- 27.Christian P, Stewart CP. Maternal Micronutrient Deficiency, Fetal Development, and the Risk of Chronic Disease. J Nutr 2010;140(3):437–445. doi: 10.3945/jn.109.116327 [DOI] [PubMed] [Google Scholar]
- 28.Szostak-Wegierek D Intrauterine nutrition: long-term consequences for vascular health. Int J Womens Health 2014;6:647–656. doi: 10.2147/IJWH.S48751 [DOI] [PMC free article] [PubMed] [Google Scholar]
- 29.Lumey LH, Stein AD, Susser E. Prenatal Famine and Adult Health. Annu Rev Public Health 2011;32. doi: 10.1146/annurev-publhealth-031210-101230 [DOI] [PMC free article] [PubMed] [Google Scholar]
- 30.Gardner RM, Kippler M, Tofail F, et al. Environmental Exposure to Metals and Children’s Growth to Age 5 Years: A Prospective Cohort Study. Am J Epidemiol 2013;177(12):1356–1367. doi: 10.1093/aje/kws437 [DOI] [PMC free article] [PubMed] [Google Scholar]
- 31.Caravanos J, Dowling R, Téllez-Rojo MM, et al. Blood Lead Levels in Mexico and Pediatric Burden of Disease Implications. Ann Glob Health 2014;80(4):269–277. doi: 10.1016/j.aogh.2014.08.002 [DOI] [PubMed] [Google Scholar]
- 32.Laclaustra M, Stranges S, Navas-Acien A, Ordovas JM, Guallar E. Serum selenium and serum lipids in US adults: National Health and Nutrition Examination Survey (NHANES) 2003–2004. Atherosclerosis 2010;210(2):643–648. doi: 10.1016/j.atherosclerosis.2010.01.005 [DOI] [PMC free article] [PubMed] [Google Scholar]
- 33.Wells EM, Navas-Acien A, Apelberg BJ, et al. Association of selenium and copper with lipids in umbilical cord blood. J Dev Orig Health Dis 2014;5(4):281–287. doi: 10.1017/S2040174414000233 [DOI] [PMC free article] [PubMed] [Google Scholar]
- 34.Gossai A, Lesseur C, Farzan S, Marsit C, Karagas MR, Gilbert-Diamond D. Association between maternal urinary arsenic species and infant cord blood leptin levels in a New Hampshire Pregnancy Cohort. Environ Res 2015;136:180–186. doi: 10.1016/j.envres.2014.10.005 [DOI] [PMC free article] [PubMed] [Google Scholar]
- 35.Feng W, Cui X, Liu B, et al. Association of Urinary Metal Profiles with Altered Glucose Levels and Diabetes Risk: A Population-Based Study in China. PLOS ONE 2015;10(4):e0123742. doi: 10.1371/journal.pone.0123742 [DOI] [PMC free article] [PubMed] [Google Scholar]
- 36.Menke A, Guallar E, Cowie CC. Metals in Urine and Diabetes in U.S. Adults. Diabetes 2016;65(1):164–171. doi: 10.2337/db15-0316 [DOI] [PMC free article] [PubMed] [Google Scholar]
- 37.Navas-Acien A, Silbergeld EK, Sharrett AR, Calderon-Aranda E, Selvin E, Guallar E. Metals in Urine and Peripheral Arterial Disease. Environ Health Perspect 2005;113(2):164–169. doi: 10.1289/ehp.7329 [DOI] [PMC free article] [PubMed] [Google Scholar]
- 38.Padilla MA, Elobeid M, Ruden DM, Allison DB. An Examination of the Association of Selected Toxic Metals with Total and Central Obesity Indices: NHANES 99–02. Int J Environ Res Public Health 2010;7(9):3332–3347. doi: 10.3390/ijerph7093332 [DOI] [PMC free article] [PubMed] [Google Scholar]
- 39.Farr OM, Gavrieli A, Mantzoros CS. Leptin applications in 2015: What have we learned about leptin and obesity? Curr Opin Endocrinol Diabetes Obes 2015;22(5):353–359. doi: 10.1097/MED.0000000000000184 [DOI] [PMC free article] [PubMed] [Google Scholar]
- 40.Flekac M, Skrha J, Hilgertova J, Lacinova Z, Jarolimkova M. Gene polymorphisms of superoxide dismutases and catalase in diabetes mellitus. BMC Med Genet 2008;9:30. doi: 10.1186/1471-2350-9-30 [DOI] [PMC free article] [PubMed] [Google Scholar]
- 41.Kang L, Dai C, Lustig ME, et al. Heterozygous SOD2 Deletion Impairs Glucose-Stimulated Insulin Secretion, but Not Insulin Action, in High-Fat–Fed Mice. Diabetes 2014;63(11):3699–3710. doi: 10.2337/db13-1845 [DOI] [PMC free article] [PubMed] [Google Scholar]
- 42.Koh ES, Kim SJ, Yoon HE, et al. Association of blood manganese level with diabetes and renal dysfunction: a cross-sectional study of the Korean general population. BMC Endocr Disord 2014;14:24. doi: 10.1186/1472-6823-14-24 [DOI] [PMC free article] [PubMed] [Google Scholar]
Associated Data
This section collects any data citations, data availability statements, or supplementary materials included in this article.