

Abstract
Water splitting is considered to be a very promising alternative to greenly produce hydrogen, and the key to optimizing this process is the development of suitable electrocatalysts. Here, a sacrificial‐counter‐electrode method to synthesize a MoSx/carbon nanotubes/Pt catalyst (0.55 wt% Pt loading) is developed, which exhibits a low overpotential of 25 mV at a current density of 10 mA cm−2, a low Tafel slope of 27 mV dec−1, and excellent stability under acidic conditions. The theory calculations and experimental results confirm the high hydrogen evolution activity that is likely due to the fact that the S atoms in MoSx can be substituted with O atoms during a potential cycling process when using Pt as a counter‐electrode, where the O atoms act as bridges between the catalytic PtOx particles and the MoSx support to generate a MoSx–O–PtOx structure, allowing the Pt atoms to donate more electrons thus facilitating the hydrogen evolution reaction process.
Keywords: hydrogen evolution reaction, MoSx, O substitution, PtOx, sacrificial‐counter‐electrodes
1. Introduction
The mitigation of modern day concerns regarding a serious energy crisis, air pollution, and global warming urgently requires a clean, renewable energy source to replace traditional fossil fuels.1, 2 Hydrogen has become a preferred alternative energy source because its combustion products are pollution‐free. At present, hydrogen is prepared primarily through steam methane, petroleum cracking, and water gas conversion processes.1, 2, 3, 4 However, it is obvious that these methods are unsustainable and will eventually result in additional environmental pollution. Water electrolysis is considered to be a very promising alternative, and the key to optimizing this process is the development of suitable electrocatalysts.5, 6, 7, 8 To date, the most effective electrocatalysts for the hydrogen evolution reaction (HER) are Pt and its alloys, but the high cost of Pt remains an obstacle to its widespread application.9, 10 Although there have been recent reports of nonnoble metal compounds (including MoS2,11, 12, 13, 14 CoP,15, 16, 17 and WC18, 19) and hybrid catalysts with low Pt loadings (such as TiO2–Pt,20, 21 CoP–Pt,22 and WC‐Pt23), to the best of our knowledge, few of these alternative materials exhibit overall HER performance (such as activity and durability) that matches that of commercial Pt/C catalysts. In addition, the vast majority of these strategies for reducing or replacing Pt involve specialized equipment, complicated and time‐consuming synthetic processes and/or expensive reagents, making them impractical for large‐scale applications.1, 2, 3 Therefore, developing practical methods for the synthesis of HER catalysts with superior performance and ultra‐low Pt loadings remains an important goal.
Recent HER trials have shown that Pt counter‐electrodes can slowly dissolve in H2SO4 solutions, after which the Pt is redeposited on the surface of the working electrode.24, 25 This interesting discovery suggests the possibility of developing ultra‐low Pt catalysts with excellent HER performance, however, certain crucial issues must still be resolved. First, because multiple reactions, including the re‐deposition of Pt, the HER and the reactions of the catalysts themselves, occur simultaneously only at the work electrode during the HER test, it is necessary to determine the manner in which these complex reactions affect the catalyst formation mechanism. Second, it is necessary to investigate improvement of the overall HER performance while reducing the Pt loading of hybrid catalysts. Last, it would be beneficial to determine if the use of various metals other than Pt as the counter‐electrode can also improve the HER performance. The purpose of the present work was to explore these topics. To the best of our knowledge, although some Pt hybrid catalysts have been synthesized using Pt counter‐electrode, such as Pt‐WS2‐nanosheet structures26 and single Pt/CoP‐based nanotubes,22 systematic studies involving these crucial issues have rarely been reported.
In the present study, we applied the sacrificial‐counter‐electrode method for the synthesis of MoSx/carbon nanotubes (CNTs)/Pt catalysts (MoSx/CNTs/Pt). This work determined that a portion of the S atoms in MoSx can be substituted with O atoms during a potential cycling process when using Pt as a counter‐electrode. This process generates a MoSx–O–PtOx structure in the MoSx/CNTs/Pt hybrid catalyst. Density functional theory (DFT) calculations indicate that the O atoms in the MoSx–O–PtOx structure act as bridges between the catalytic PtOx particles and the MoS2 support, allowing the Pt atoms to donate more electrons and thus facilitating the HER process. The experimental results also confirm that this MoSx/CNTs/Pt hybrid catalyst (0.55 wt% Pt loading) exhibits a low overpotential of 25 mV at a current density of 10 mA cm−2, a low Tafel slope of 27 mV dec−1, and excellent stability under acidic conditions during the HER. The overall HER performance of this material is superior to that of current commercial Pt/C catalyst (20 wt% Pt loading). More importantly, it was found that other non‐Pt metals (such as Pd and W) could be employed as the sacrificial counter‐electrode and that these also improved the HER performance of the MoSx catalyst, further increasing the feasibility of using this technique for practical applications in the future.
2. Results and Discussion
Figure 1 summarizes the entire synthetic procedure used to obtain the MoSx/CNTs/Pt catalyst. Briefly, the hybrid catalysts were synthesized via a two‐step electrochemical process (see Supporting Information for experimental details). Initially, a CNT‐modified glass carbon electrode (GCE) was soaked in an aqueous solution of (NH4)2MoS4 and NaClO4, such that MoSx was deposited on the surfaces of the CNTs via an amperometric i–t curve (i–t) process. The samples obtained after various reaction times are denoted herein as shown in Table S1 in the Supporting Information. Figure S1 and Table S1 in the Supporting Information demonstrate that the MoSx/CNTs sample produced using a reaction time of 1800 s generated a higher catalytic current than the other materials, and so this specimen was employed in the subsequent experimentation. The MoSx/CNTs‐modified GCEs were soaked in aqueous H2SO4 solutions and the potential cycling was carried out using a Pt wire as the sacrificial counter‐electrode in a three‐electrode system. Parallel experimental trials employing various numbers of potential cycles were performed (Figure S2, Supporting Information) and the resulting catalysts are denoted herein as MoSx/CNTs/Pt5k, MoSx/CNTs/Pt10 k, and so on, where the sign of “k” indicates the cycles number of 1000. Their HER performances were evaluated using a graphite rod as a counter‐electrode in a standard three‐electrode system. From the data in Table S1 in the Supporting Information, it is evident that the MoSx/CNTs/Pt10 k sample produced the highest catalytic current, and so this sample was selected as the optimal host material for subsequent experiments.
Figure 1.

Schematic illustration of the MoSx/CNTs/Pt synthesis procedure.
Transmission electron microscopy (TEM) images of the MoSx/CNTs are presented in Figure 2 a. These images demonstrate that particles were dispersed on the CNT surfaces, while the high‐resolution TEM (HRTEM) image in Figure 2b also shows a thin amorphous coating over the CNTs. Energy‐dispersive X‐ray (EDX) mapping confirmed that both Mo and S were uniformly distributed over the CNTs (Figure 2b, lower left), suggesting that MoSx was present on the CNTs. The selected‐area electron‐diffraction (SAED) characterization in the inset to Figure 2a contains blurry rings generated by the MoSx/CNTs that imply nonperfect ordering of the MoSx, further confirming that thin layers of amorphous MoSx were successfully applied to the CNTs.27 Figure 2c and Figure S3 in the Supporting Information show SEM and TEM images of the MoSx/CNTs/Pt10 k. In contrast to the MoSx/CNTs TEM image in Figure 2b, the HRTEM images in Figure 2f,g show two phases very clearly, one is amorphous and the other consists of distinct lattice fringes. The fringe spacings of 0.35 and 0.29 nm represent the (130) and (022) planes of the PtO2, while the HRTEM image in Figure 2g indicates the (002), (111), and (110) crystal grains of PtO. These results are also consistent with the SAED data in Figure 2e, which exhibit several bright rings attributed to PtOx crystal grains. These observations together with the EDX mapping results in Figure 2d confirm that Pt was uniformly distributed over the MoSx/CNTs/Pt10 k via the potential cycling process. An inductively coupled plasma optical emission spectroscopy (ICP‐OES) analysis determined that the MoSx/CNTs/Pt10 k samples had a 0.55 wt% Pt loading.
Figure 2.

Characterizations of the MoSx/CNTs hybrid catalysts: a,b) TEM images of a MoSx/CNTs hybrid catalyst. The inset to (a) is the electron diffraction pattern and the insets to (b) in the lower left and upper right show the EDX elemental maps for C, Mo, S, and O (scale bar = 200 nm) and an HRTEM image. Characterizations of the MoSx/CNTs/Pt10 k hybrid catalysts: c) TEM image, d) STEM and corresponding element maps (scale bar = 500 nm), e) electron diffraction pattern, f,g) HAADF‐STEM and corresponding HRTEM images.
The chemical compositions of the pristine MoSx/CNTs and the MoSx/CNTs/Pt products made with various numbers of potential cycles were assessed by X‐ray photoelectron spectroscopy (XPS). Figure 3 a confirms the presence of C, Mo, S, O, and Pt in the MoSx/CNTs/Pt10 k, while Figure 3b shows the Pt 4f spectrum in which there are peaks at 72.5 and 75.8 eV that are characteristic of Pt2+. Changes in the chemical states of the elements in the MoSx/CNTs/Pt samples following the application of potential cycles were also compared. From Figure 3c,d, it is apparent that the Mo 3d and S 2p peaks were shifted to higher binding energies (BEs) after the potential cycling process, demonstrating that the Mo(IV) (at 229.6 eV) transitioned to Mo(VI) (at 233 eV) and the S2− (at 163.6 eV) gradually transformed to SOx 2− (at 169.2 eV).28 It is also apparent that the O 1s spectra of the MoSx/CNTs/Pt samples in Figure 3e show a shift toward lower BEs compared with the MoSx/CNT sample. The peak at 532.2 eV is assigned to divalent oxygen (O2−), which indicates that more O2− appears in these MoSx/CNTs/Pt samples. The aforementioned XPS results also suggest that the MoSx was susceptible to oxidation. That is, some of the S atoms in the MoSx would have been replaced by O atoms during the potential cycling process when using Pt as a sacrificial counter‐electrode, after which these O atoms would serve as bridges between the PtOx and MoSx. To gain further insights into the correlation between the O substitution and the potential cycling process using Pt as the sacrificial counter‐electrode. We also designed a comparative experiment using the prepared MoSx/CNTs material as the working electrode to electrodeposit Pt directly in chloroplatinic acid (H2PtCl6) solution (see Supporting Information for experimental details). The samples obtained using various numbers of electrodeposition cycles are denoted herein as MoSx/CNTs/H2PtCl6 1, MoSx/CNTs/H2PtCl6, and MoSx/CNTs/H2PtCl6 2 (Figures S4 and S5, Supporting Information). The MoSx/CNTs/H2PtCl6 sample with 0.54 wt% Pt loading was also analyzed by XPS and the Mo 3d and S 2p spectra in Figure 3c,d demonstrate no signs of O substitution. These observations further confirm that the reaction involving S substitution by O primarily occurred during the potential cycling process when using Pt wire as the sacrificial counter‐electrode.
Figure 3.

Structural characterizations of the catalyst: a) the XPS patterns of the MoSx/CNTs (black line) and MoSx/CNTs/Pt10 k (red line). The b) Pt 4f, c) Mo 3d, d) S 2p, and e) O 1s spectra of the hybrid catalysts. f) The calculated formation energy profiles for the oxidation of a single 2H–MoS2 sheet at different S lattice sites. The inset presents a front view of a MoS2 nanosheet, showing terminal or S2− sites on the edge and apical S2− sites on the basal surface. The yellow and blue spheres indicate S and Mo atoms. The table summarizes the Bader charge analysis of the three major oxidation scenarios. g) A schematic illustrating the change in catalyst structure during the electrodeposition process.
Assuming that the substitution of S atoms by O (that is, the formation of OS defects) was thermodynamically competitive with O adsorption,29 we investigated the atomic‐scale mechanism of MoS2 oxidation based on theoretical calculations. Figure 3f presents the formation energy profile for O substitution of a single sheet of 2H–MoS2 at different S sites. The DFT calculations yielded negative values for the oxidation, demonstrating a thermodynamically stable substitution process. The formation energy for the replacement of a single S2− edge atom by O was found to be approximately −1.56 eV, while the value for replacement of an apical S2− site (in the central region of the MoS2 nanosheet) was −1.71 eV. It is worth noting that O substitution at the edge sites yielded the energy of oxidation was −2.53 eV, which is significantly different from the others, and suggests that the edges were most likely to be substituted by atomic O. We also conducted a Bader charge analysis of the three major oxidation sites within the nanostrip, with the results in the tabular inset to Figure 3f. For a single S (S2−) edge, the charge difference for OS was approximately −0.27 e, which was primarily transferred from two neighboring Mo atoms (+0.25 e from both). With regard to the apical S2− sites, the value was approximately −0.35 e more than the substituted S positions, with three Mo neighbors donating +0.20 e each due to the relatively greater electronegativity of O. Most importantly, the largest charge deviation associated with oxidation was at the edge, with the minimum amount of electron transfer from Mo atoms. These results provide further evidence that the edge could be highly susceptible to oxidation. According to the experimental data, we devised a mechanism for the formation of MoSx/CNTs/Pt via potential cycling, as shown in Figure 3g.
The HER activities of the various MoSx/CNTs/Pt catalysts were evaluated under acidic conditions (0.5 m H2SO4) using a graphite rod as a counter‐electrode in a three‐electrode configuration. The results were compared with those obtained from pristine CNTs, a commercial Pt/C catalyst, and the MoSx/CNTs/H2PtCl6. The HER polarization curves of the MoSx/CNTs catalysts after 5000, 10 000, and 15 000 potential cycles are presented in Figure 4 a. The ŋ values at j HER = 10 mA cm−2 are widely used to evaluate the HER electrocatalytic performance, with smaller values indicating higher HER activities. The MoSx/CNTs/Pt10 k catalyst demonstrated significant activity during the HER, which achieves the current density of 10 mA cm−2 only need the 25 mV overpotential. The Tafel slopes based on polarization curves are presented in Figure 4b. The Tafel slope for the MoSx/CNTs/Pt10 k was 27 mV decade−1, which is equal to that for the commercial Pt/C (30 mV decade−1) in an acidic solution. These results demonstrate that the HER on both the MoSx/CNTs/Pt10 k and Pt/C proceeded via the Volmer–Tafel mechanism, with recombination between adjacent adsorbed H atoms as the rate‐limiting step (RLS).30, 31 Figure 4b presents the Tafel slope for the CNTs, MoSx/CNTs, MoSx/CNTs/Pt5 k, MoSx/CNTs/Pt15 k and other specimens, which may proceed through the Volmer–Heyrovsky mechanism. This involves the electrochemical combination of an adsorbed H atom, a free proton and a free electron as the RLS.30, 31 To better compare the HER kinetics to the recently reported results for a highly active low‐Pt catalyst in an acidic electrolyte, the overpotential at a current density of 10 mA cm−2 and the Tafel slope are summarized in Figure 4c. The HER performance of our MoSx/CNTs/Pt10 k hybrid catalyst is better than those of low‐Pt catalysts and is also comparable to that of any HER catalyst reported to date (Table S3, Supporting Information).
Figure 4.
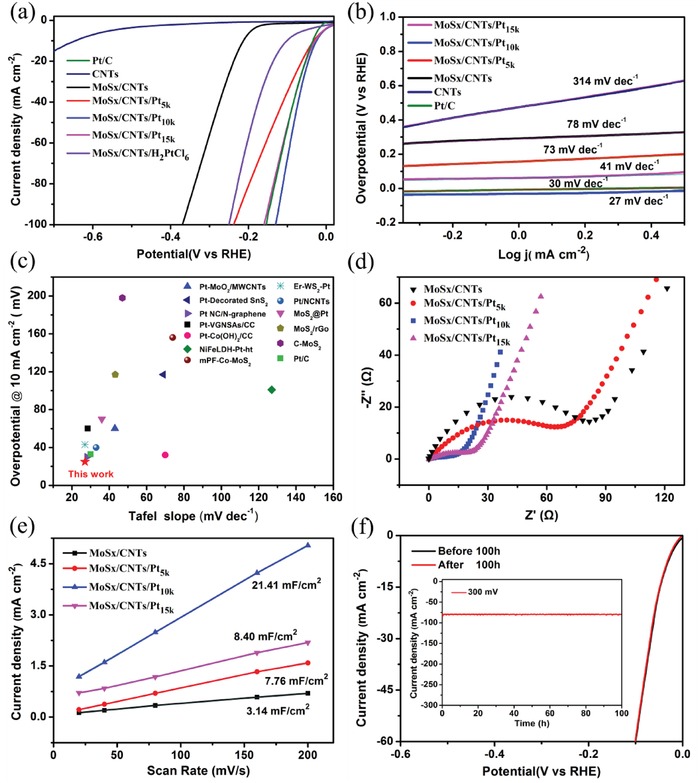
The HER performance of the catalysts: a) the polarization curves for CNTs, Pt/C, MoSx/CNTs and MoSx/CNTs/Pt in a 0.5 m H2SO4 solution at a scan rate of 10 mV s−1 and b) the corresponding Tafel plots. c) A comparison of the overpotentials at a current density of 10 mA cm−2 and the Tafel slopes for the various catalysts. d) The Nyquist plots for the MoSx/CNTs/Pt hybrid catalysts. e) The double‐layer capacitance values for the MoSx/CNTs/Pt hybrid catalysts. f) Linear sweep voltammetry curves for MoSx/CNTs/Pt10 k before and after 100 h. The inset shows the chronoamperometry i–t curve for MoSx/CNTs/Pt10 k at η = 300 mV in 0.5 m H2SO4.
The origin of the high HER activity exhibited by the MoSx/CNTs/Pt10 k was examined by performing an electrochemical impedance spectroscopy (EIS) analysis of the MoSx/CNTs/Pt catalysts. The resulting Nyquist plots are shown in Figure 4d, and the electrical equivalent circuit diagram in Figure S6 in the Supporting Information was used to model the solid–liquid interface after the experimental data were well fitted (Figure S7, Supporting Information). The impedance parameters obtained by fitting the EIS responses are summarized in Table S2 in the Supporting Information. These data demonstrate that the MoSx/CNTs/Pt10 k had a low Rp value of 52 Ω and the largest electric double layer capacitance (CPE) value among all of the composite catalysts. This low Rp value indicates rapid surface charge transfer and a higher reaction rate in the electrocatalysis kinetics.9 The large CPE value corresponds to a high active surface area, which would be expected to greatly promote the HER performance of the material. These may be the main reasons why the MoSx/CNTs/Pt10 k had the highest HER activity among all the composite catalysts. The electrochemical surface area values were also evaluated to gain further insights into these electrocatalysts. These values were obtained by calculating the electrochemical double layer capacitances (C dl) utilizing a simple cyclic voltammetry method, and the standard CV curves acquired for the different materials with varying scan rates are shown in Figure S8 in the Supporting Information. Here, a larger C dl value implies a higher effective active surface area. As shown in Figure 4e, the C dl of the MoSx/CNTs/Pt10 k was approximately 21.41 mF cm−2 and thus much higher than the values for the MoSx/CNTs, MoSx/CNTs/Pt5 k, and MoSx/CNTs/Pt15 k. The SEM images of these MoSx/CNTs/Pt samples are shown in Figure S9 in the Supporting Information and a morphology analysis suggests that the porosity of these materials actually increased along with the number of potential cycles. This result may explain why the MoSx/CNTs/Pt composites made with fewer deposition cycles (fewer than 10 000 cycles) had fewer active sites. Moreover, the ICP‐OES analysis demonstrates that the Pt concentration in the MoSx/CNTs/Pt15 k was 0.53 wt%, and so slightly lower than that in the MoSx/CNTs/Pt10 k. This can be explained by the shedding of Pt during longer potential cycling (greater than 10 000 cycles), which was also confirmed by our visual observations.
The stability of the catalyst is also an important factor with regard to the HER, and the stability of the MoSx/CNTs/Pt10 k electrode was evaluated by monitoring the current density during continuous operation at 0.3 V (vs a reversible hydrogen electrode (RHE)) under acidic conditions. The corresponding time‐dependent current density curves are shown in Figure 4f, and these data confirm that the current density of the catalyst was constant for over 100 h. The polarization curve of the MoSx/CNTs/Pt10 k catalyst after 100 h is almost identical to the initial one (Figure 4f), suggesting negligible loss of cathodic current. This in turn indicates that the MoSx/CNTs/Pt10 k catalyst exhibits excellent durability under acidic conditions. This level of durability is much greater than those of the majority of previously reported Pt hybrid catalysts (Table S3, Supporting Information). As demonstrated by the aforementioned XPS analysis (Figure 3), the strong interactions between the PtOx and MoSx, rooted in the bridging effect of the substituted O atoms, are evidently an important factor in achieving this remarkable level of robustness.
Figure 4a also shows that the MoSx/CNTs/H2PtCl6 catalyst required a higher overpotential to achieve a 10 mA cm−2 currently density compared with that for the MoSx/CNTs/Pt10k. Based on structural characterizations, we can safely conclude that O substitution played a key role in the excellent HER performance of this material. To gain further insights into the effect of O substitution on the location of PtOx clusters, we examined Pt6O9 via quantum mechanical DFT calculations,32, 33 and found that each Pt atom in the cluster was coordinated with four O atoms with a bond length of approximately 2.04 Å. The optimal geometries for Pt6O9 adsorption on an oxidized MoS2 nanosheet were determined and are shown in Figure 5 . According to the optimized cluster structure, each Pt atom was coordinated with four O atoms and the Pt—O bond length was approximately 2.04 Å. The four coordinated O atoms around the central Pt ion formed a square planar structure with D 4h symmetry. The adsorption energies indicate that PtOx clusters will be preferentially deposited on the edge sites rather than other regions of the MoS2 nanostrips, in agreement with previous reports.26 Figure 5a displays the 3D structure of Pt6O9 generated on the bare edge of MoS2, while Figure 5b–d shows the geometric models after optimization, in which a Pt6O9 cluster is deposited on the disulfide terminal edge sites of MoS2 nanosheets with varying levels of oxidation. The formation energies for Pt6O9 on the terminal edge were calculated to be −6.02 eV with one OS defect, −6.35 eV with two OS defects, and −6.74 eV with three OS defects, all of which are much lower than the value for Pt6O9 located on the bare edge (−5.17 eV) on the MoS2 surface. Therefore, the OS antisite defects undergo a much stronger interaction with the PtOx clusters compared with the bare edge, suggesting that substituted O atoms strengthen the bridging between the catalytic PtOx particles and MoS2 support. These results also indicate that this catalyst, having a MoSx–O–PtOx structure, has potential applications in electrocatalytic hydrogen evolution.
Figure 5.

Schematic front views of the optimal 3D geometries of PtOx clusters deposited on MoS2 nanosheets with varying levels of oxidation: a) the bare edge, b) one OS defect, c) two OS defects, and d) three OS defects. The yellow, red, white, and blue spheres indicate S, O, Pt, and Mo atoms. e) The optimal structure model of a PtOX cluster generated on an oxidized MoS2 basal plane with H* absorption at a Pt4+ site. f) Differences in the charge density around the H*—Pt bond. The charge is localized primarily between the bond (the light green region) and is less concentrated outside this region (the purple region), with a value of 0.02 electrons Å−3. g) An HER free‐energy diagram for different H* absorption sites on the complex catalyst. h) Density of states for the PtOx–3OS–MoS2 and H*–PtOx–3OS–MoS2 and PDOSs for the Pt‐dx2‐y2 and H‐s of H*–PtOx–3OS–MoS2.
To further elucidate the catalytic mechanism during the HER on the MoSx/CNTs/Pt catalytic system, a Pt6O9 nanoparticle was constructed on a 2H–MoS2 basal surface. After completing the structural optimization (as shown in Figure 5e), the Pt4+ was coordinated with one H*. The bond length was found to be approximately 1.53 Å, which is close to the length obtained from the experimental results. The charge density differences between the states before and after hydrogen bonding are presented in Figure 5f. Note that the charge is localized between the Pt—H bond (the light green zone) and is less concentrated outside this region (the purple zone), which is typical of an s‐type valence bond. The projected density of states (PDOSs) for the Pt dxy, Pt dx2‐y2, and H 1s orbitals of the H*–PtOx/MoS2 are all presented in Figure 5h, and confirm that the H 1s state is primarily hybridized with the Pt dx2‐y2 orbital rather than the others. In the case of an HER catalyst, the relative free energy of H* absorption on the surface is the key to evaluating catalytic activity. As shown in Figure 5g, the calculated ∆G value for H* adsorption on the O2− of a PtOx cluster is on the order of −1.09 eV, which is consistent with prior reports. The absolute ∆G value for the HER on Pt4+ gradually approaches zero (−0.03 eV for the Pt4+ ions of PtOx‐3OS‐MoS2) with increases in the extent of oxidation of the MoS2. In this work, we found that the free energy for H* adsorption on Pt4+ changes to +0.16 eV when all the O2− ions in the PtOx cluster are initially passivated by H. Moreover, the relative energies for the sorption of H at apical S2− and Mo4+ sites have large positive values, while the S2− and edge sites show the negative ones on the MoS2 basal surface. Therefore, we conclude that the Pt4+ ions in the PtOx‐3OS‐MoS2 are the most active catalytic sites during the HER. As shown in Figure 5h, the partially occupied surface state was situated at the Fermi level of the PtOx–3OS–MoS2. The adsorption of H* on the PtOx cluster generated an H 1s state that was primarily in the vicinity of −5.8 eV, and the Pt‐dx2‐y2 and H‐s orbitals were able to form a weak valence bond. Although the Bader charge analysis shows no obvious charge transfer between the PtOx cluster and the H, the charge density difference analysis in Figure 5f clearly demonstrates charge transfer from H* to a Pt atom of the PtOx cluster, explaining the high catalytic activity of the PtOx–3OS–MoS2 during the HER process.
The turnover frequency (TOF) is a useful parameter for assessing the synergistic enhancement effects of O substitution. An experiment was therefore designed to allow direct electrodeposition of the same amount of Pt on a CNTs‐modified GCE, and the resulting sample is denoted CNTs/Pt10 k. The number of active sites in this material was estimated by using cyclic voltammetry to examine the different catalyst electrodes in 1.0 m phosphate buffered saline (pH = 7) over the potential window from −0.2 to 0.6 V versus RHE at a scan rate of 50 mV s−1 (Figure S10, Supporting Information, for details of the calculation method and experimental process).34, 35 The HER polarization curves for the different catalysts are provided in Figure 6 a and clearly show that the HER activities of the CNTs/Pt10 k and MoSx/CNTs were lower than that of the MoSx/CNTs/Pt10 k. Figure 6b shows the different TOF curves for the CNTs, CNTs/Pt10 k, MoSx/CNTs, and MoSx/CNTs/Pt10 k in 0.5 m H2SO4 within the range of applied potentials. Approximate TOF values can be used to compare the activity of the MoSx/CNTs/Pt10 k with those of the other catalysts. Figure 6c demonstrates that overpotentials of 447 and 225 mV were required to achieve the same TOF of 0.8 s−1 for the MoSx/CNTs and CNTs/Pt10 k, while the MoSx/CNTs/Pt10 k only required 69 mV to reach the same value. This value is much lower than those for the MoSx/CNTs and CNTs/Pt10 k. To make a clear comparison, we also compared the TOF values at overpotentials of 300, 350, and 400 mV. As shown in Figure 6d, the TOF values for the MoSx/CNTs/Pt10 k were always greater than the combined values for the MoSx/CNTs and CNTs/Pt10 k. This result demonstrates the synergistic enhancement effects of O substitution on the catalyst with the MoSx–O–PtOx structure. Then the Faradic efficiency (FE) of MoSx/CNTs/Pt10 k for water electrolysis was further evaluated by gas chromatography. The amount of H2 increases during electrolysis process and the approximate agreement of measured value and theoretical one suggests nearly 100% FE (Figure S11, Supporting Information, for details of the calculation method and experimental process).36
Figure 6.

The TOF values of the catalysts: a) The polarization curves for CNTs, CNTs/Pt10 k, MoSx/CNTs, and MoSx/CNTs/Pt10 x in a 0.5 m H2SO4 solution acquired at a scan rate of 10 mV s−1. b) The calculated TOF values for CNTs, CNTs/Pt10 k, MoSx/CNTs, and MoSx/CNTs/Pt10 x from experimental data. c) A comparison of the overpotentials of samples at the same TOF values. d) A comparison of the TOF values of samples at the same overpotentials.
The above findings raised the intriguing possibility of the general applicability of this method involving the sacrifice of a counter‐electrode. Therefore, we also selected some inexpensive wires made of metals other than Pt, such as Pd wire and W filament, for use as sacrificial counter‐electrodes and carried out similar experiments (see Supporting Information for experimental details). The HER polarization curves for the MoSx/CNTs, MoSx/CNTs/W10 k, and MoSx/CNTs/Pd2 k and the corresponding Tafel slopes are shown in Figure S12 in the Supporting Information. It can be seen that using either Pd or W wire as the counter‐electrode produced an obvious improvement in the HER performance of the MoSx/CNT sample. Specifically, the MoSx/CNTs/Pd2 k catalyst also exhibited excellent HER performance comparable to that of the MoSx/CNTs/Pt10 k catalyst. These encouraging results provide further evidence that this method involving the sacrifice of a counter‐electrode could be a promising route to the synthesis of catalysts with remarkable HER performance.
3. Conclusions
In summary, we have demonstrated a novel strategy involving the sacrifice of a counter‐electrode to successfully synthesize a MoSx/CNTs/Pt10 k catalyst with an ultra‐low Pt loading of 0.55 wt%. This material exhibits excellent HER performance, with a small overpotential of 25 mV at a current density of 10 mA cm−2 and a low Tafel slope of 27 mV dec−1. The catalyst also shows good catalytic stability over at least 100 h with almost no current attenuation in acidic media, such that the HER activity of the MoSx/CNTs/Pt10 k is even better than that of Pt/C in acidic solutions. DFT calculations indicate that substituted O atoms strengthen the bridging between catalytic PtOx particles and MoS2 supports, such that the Pt atoms donate more electrons, which facilitates the HER process. This synthesis method involving a sacrificial counter‐electrode may offer a new approach to developing various hybrid materials with ultra‐low transition metal loadings for applications in electrocatalytic fields.
Conflict of Interest
The authors declare no conflict of interest.
Supporting information
Supplementary
Acknowledgements
The work was supported in part by grants from Natural Science Foundation of Zhejiang Province for Distinguished Young Scholars (LR18E020001), National Natural Science Foundation of China (21875166, 51741207, 51572197, 21475096, 51420105002), Science and Technology Project of Zhejiang Province (LGF18B050005). The authors are grateful to ShenZhen Jiabin Tech. Co. Ltd. for scientific computing assistance. The authors thank Michael D. Judge, from Liwen Bianji, Edanz Editing China for editing the English text of a draft of this manuscript.
Zhan Y., Li Y., Yang Z., Wu X., Ge M., Zhou X., Hou J., Zheng X., Lai Y., Pang R., Duan H., Chen X., Nie H., Huang S., Adv. Sci. 2019, 6, 1801663 10.1002/advs.201801663
Contributor Information
Zhi Yang, Email: yang201079@126.com.
Huagui Nie, Email: huaguinie@126.com.
Shaoming Huang, Email: smhuang@wzu.edu.cn.
References
- 1. Zou X., Zhang Y., Chem. Soc. Rev. 2015, 44, 5148. [DOI] [PubMed] [Google Scholar]
- 2. Morales‐Guio C. G., Stern L. A., Hu X., Chem. Soc. Rev. 2014, 43, 6555. [DOI] [PubMed] [Google Scholar]
- 3. Zhang W., Lai W., Cao R., Chem. Rev. 2017, 117, 3717. [DOI] [PubMed] [Google Scholar]
- 4. Yang Y., Luo M., Xing Y., Wang S., Zhang W., Lv F., Li Y., Zhang Y., Wang W., Guo S., Adv. Mater. 2018, 30, 1706085. [DOI] [PubMed] [Google Scholar]
- 5. Tang C., Wang H. F., Zhang Q., Acc. Chem. Res. 2018, 51, 881. [DOI] [PubMed] [Google Scholar]
- 6. Wang J., Xu F., Jin H., Chen Y., Wang Y., Adv. Mater. 2017, 29, 1605838. [DOI] [PubMed] [Google Scholar]
- 7. Zheng Y., Jiao Y., Jaroniec M., Qiao S. Z., Angew. Chem., Int. Ed. 2015, 54, 52. [DOI] [PubMed] [Google Scholar]
- 8. Tang C., Titirici M. M., Zhang Q., J. Energy Chem. 2017, 26, 1077. [Google Scholar]
- 9. Li P., Yang Z., Shen J., Nie H., Cai Q., Li L., Ge M., Gu C., Chen X., Yang K., Zhang L., Chen Y., Huang S., ACS Appl. Mater. Interfaces 2016, 8, 3543. [DOI] [PubMed] [Google Scholar]
- 10. Luo M., Sun Y., Wang L., Guo S., Adv. Energy Mater. 2017, 7, 1602073. [Google Scholar]
- 11. Tsai C., Li H., Park S., Park J., Han H. S., Norskov J. K., Zheng X., Abild‐Pedersen F., Nat. Commun. 2017, 8, 15113. [DOI] [PMC free article] [PubMed] [Google Scholar]
- 12. Ling C., Ouyang Y., Shi L., Yuan S., Chen Q., Wang J., ACS Catal. 2017, 7, 5097. [Google Scholar]
- 13. Geng X., Sun W., Wu W., Chen B., Al‐Hilo A., Benamara M., Zhu H., Watanabe F., Cui J., Chen T. P., Nat. Commun. 2016, 7, 10672. [DOI] [PMC free article] [PubMed] [Google Scholar]
- 14. Sun X., Huo J., Yang Y. D., Xu L., Wang S. Y., J. Energy Chem. 2017, 26, 1136. [Google Scholar]
- 15. Zhou Q., Shen Z., Zhu C., Li J., Ding Z., Wang P., Pan F., Zhang Z., Ma H., Wang S., Zhang H., Adv. Mater. 2018, 30, 1800140. [DOI] [PubMed] [Google Scholar]
- 16. Zeng Y., Wang Y., Huang G., Chen C., Huang L., Chen R., Wang S., Chem. Commun. 2018, 54, 1465. [DOI] [PubMed] [Google Scholar]
- 17. Xiao X., He C.‐T., Zhao S., Li J., Lin W., Yuan Z., Zhang Q., Wang S., Dai L., Yu D., Energy Environ. Sci. 2017, 10, 893. [Google Scholar]
- 18. Ren B., Li D., Jin Q., Cui H., Wang C., J. Mater. Chem. A 2017, 5, 13196. [Google Scholar]
- 19. Gong Q., Wang Y., Hu Q., Zhou J., Feng R., Duchesne P. N., Zhang P., Chen F., Han N., Li Y., Jin C., Li Y., Lee S. T., Nat. Commun. 2016, 7, 13216. [DOI] [PMC free article] [PubMed] [Google Scholar]
- 20. Jin J., Wang C., Ren X.‐N., Huang S.‐Z., Wu M., Chen L.‐H., Hasan T., Wang B.‐J., Li Y., Su B.‐L., Nano Energy 2017, 38, 118. [Google Scholar]
- 21. Cheng X., Li Y., Zheng L., Yan Y., Zhang Y., Chen G., Sun S., Zhang J., Energy Environ. Sci. 2017, 10, 2450. [Google Scholar]
- 22. Zhang L., Han L., Liu H., Liu X., Luo J., Angew. Chem., Int. Ed. 2017, 56, 13694. [DOI] [PMC free article] [PubMed] [Google Scholar]
- 23. Liu Z., Huo X., Xi K., Li P., Yue L., Huang M., Suo G., Xu L., Wang W., Qu X., Energy Storage Mater. 2018, 10, 268. [Google Scholar]
- 24. Chen R., Yang C., Cai W., Wang H.‐Y., Miao J., Zhang L., Chen S., Liu B., ACS Energy Lett. 2017, 2, 1070. [Google Scholar]
- 25. Dong G., Fang M., Wang H., Yip S., Cheung H.‐Y., Wang F., Wong C.‐Y., Chu S. T., Ho J. C., J. Mater. Chem. A 2015, 3, 13080. [Google Scholar]
- 26. Tang K., Wang X., Li Q., Yan C., Adv. Mater. 2018, 30, 1704779. [DOI] [PubMed] [Google Scholar]
- 27. Wang X., Zheng Y., Yuan J., Shen J., Niu L., Wang A.‐j., Electrochim. Acta 2017, 235, 422. [Google Scholar]
- 28. Wang T., Zhuo J., Du K., Chen B., Zhu Z., Shao Y., Li M., Adv. Mater. 2014, 26, 3761. [DOI] [PubMed] [Google Scholar]
- 29. Kc S., Longo R. C., Wallace R. M., Cho K., J. Appl. Phys. 2015, 117, 135301. [Google Scholar]
- 30. Gennero de Chialvo M. R., Chialvo A. C., Electrochim. Acta 1998, 44, 841. [Google Scholar]
- 31. de Chialvo M. R. G., Chialvo A. C., J. Electroanal. Chem. 1994, 372, 209. [Google Scholar]
- 32. Blum V., Gehrke R., Hanke F., Havu P., Havu V., Ren X., Reuter K., Scheffler M., Comput. Phys. Commun. 2009, 180, 2175. [Google Scholar]
- 33. Tkatchenko A., Scheffler M., Phys. Rev. Lett. 2009, 102, 073005. [DOI] [PubMed] [Google Scholar]
- 34. Li J., Zhou X., Xia Z., Zhang Z., Li J., Ma Y., Qu Y., J. Mater. Chem. A 2015, 3, 13066. [Google Scholar]
- 35. Merki D., Fierro S., Vrubel H., Hu X., Chem. Sci. 2011, 2, 1262. [Google Scholar]
- 36. Wu D., Wei Y., Ren X., Ji X., Liu Y., Guo X., Liu Z., Asiri A. M., Wei Q., Sun X., Adv. Mater. 2018, 30, 1705366. [DOI] [PubMed] [Google Scholar]
Associated Data
This section collects any data citations, data availability statements, or supplementary materials included in this article.
Supplementary Materials
Supplementary