Abstract
Alzheimer’s disease (AD) is a neurodegenerative disorder that is the major cause of dementia in the elderly. There is no cure against AD. We have recently discovered a novel transient receptor potential canonical 6 (TRPC6)–mediated intracellular signaling pathway that regulates the stability of dendritic spines and plays a role in memory formation. We have previously shown that TRPC6 agonists exert beneficial effects in models of AD and may serve as lead compounds for development of AD therapeutic agents. In the current study, we used the Clarivate Analytics Integrity database to search for additional TRPC6 agonists. We selected four compounds to study as potential neuroprotective agents. We applied bioinformatics analyses to test the basic pharmacological properties of the selected compounds. We performed in vitro screening of these compounds to validate their ability to protect mushroom spines from amyloid toxicity and determined that two of these compounds exert neuroprotective effects in the nanomolar concentration range. We have chosen one of these compounds [piperazine (PPZ)] for further testing. In agreement with previously published data, we have shown that PPZ potentiates TRPC6 channels. We demonstrated that the neuroprotective mechanism of the investigated PPZ is based on activation of neuronal store-operated calcium entry in spines. We have shown that PPZ restores long-term potentiation induction in 6-month-old 5xFAD mouse hippocampal slices. The obtained results suggest that PPZ and its derivatives are potential lead molecules for development of AD therapeutic agents.
Introduction
Alzheimer’s disease (AD) is a neurodegenerative disease that occurs in aged people. The progressive death of nerve cells, and at the same time the gradually increasing atrophy of the brain regions (hippocampus and cortex), are characteristic symptoms of AD. The human population is getting old due to increases in lifespan. This ultimately leads to increased frequency of neurodegenerative diseases. AD affects both the human mentality (loss of memory, leading eventually to dementia) and the ability to care for oneself. Thus, the social significance of this problem is obvious. Besides, the treatment of neurodegenerative diseases is very expensive and constitutes a financial problem for society.
The dominant idea in the AD field is the amyloid hypothesis, which proposes that accumulation of β-amyloid (Aβ) protein oligomers in a patient’s brain causes synaptic loss and eventually death of nerve cells (Hardy and Higgins, 1992; Hardy and Selkoe, 2002; Selkoe and Hardy, 2016; Cline et al., 2018). Based on this hypothesis, a number of therapeutic approaches have been tested, such as inhibitors of Aβ production (γ-secretase and β-secretase inhibitors) and antibodies against Aβ that can clear amyloid from the brain. However, thus far all of the clinical trials have failed (Karran and Hardy, 2014). No new medications have been approved by the Food and Drug Administration for AD since 2003, and currently approved AD medications such as Memantine, Donepezil, Galantamine, and Rivastigmine only lead to temporary symptomatic improvement in the status of patients.
It is known that in the early stages of the disease, before the appearance of toxic amyloid plaques, there is a loss of synapses in the neurons of patients with AD (Selkoe, 2002). Therefore, the existence of drugs that can slow or prevent the loss of synapses can significantly reduce the rate of development of neurodegenerative diseases, in particular Alzheimer’s disease. In addition to accumulation of amyloid, AD neurons also display abnormal calcium (Ca2+) signaling (Bezprozvanny and Mattson, 2008). Excess cytosolic Ca2+ is toxic to cells, and to protect themselves neurons trigger protective mechanisms aimed at restoring intracellular Ca2+ to normal levels. In our previous studies, we found that endoplasmic reticulum Ca2+ levels are increased in AD neurons, resulting in compensatory downregulation of neuronal store-operated calcium entry (nSOCE) (Sun et al., 2014; Zhang et al., 2015). Based on these findings, we concluded therapeutic agents that can facilitate nSOCE can prevent synaptic loss and slow down the progression of the disease at early stages. Using genetic approaches, we validated this idea in a presenilin knockin model of AD (Sun et al., 2014) and in amyloid precursor protein knockin (APP-KI) and amyloid toxicity models of AD (Popugaeva et al., 2015; Zhang et al., 2015). In a more recent study, we identified the molecular identity of the channels carrying out the nSOCE (Zhang et al., 2016). We established that transient receptor potential canonical (TRPC) 6 channels play a critical role in mediating nSOCE in hippocampal spines and demonstrated that hyperforin (HPF), a known activator of TRPC6, exerts synaptoprotective effects in protein knockin and APP-KI models (Zhang et al., 2016). These results are consistent with previous reports regarding beneficial effects of HPF and its derivatives in AD mouse models (Dinamarca et al., 2006; Cerpa et al., 2010; Griffith et al., 2010; Inestrosa et al., 2011). Based on these results, we concluded that TRPC6 channel activators may have beneficial effects in AD. This conclusion is consistent with increased excitatory synaptic density in TRPC6 transgenic mice (Zhou et al., 2008) and with reduced TRPC6 expression levels in blood cells from AD patients (Lu et al., 2018). Notably, TRPC channels emerge as potential targets for treatment of a variety of psychiatric and neurologic disorders (Bon and Beech, 2013; Zeng et al., 2016).
In previous studies, we identified a molecule that acts as a positive modulator of TRPC6 activity and an activator of nSOCE. This compound, N-{4-[2-(6-amino-quinazolin-4-ylamino)-ethyl]-phenyl}-acetamide (NSN21778), was able to restore the mushroom synaptic spine and rescue long-term potentiation (LTP) defects in protein knockin and APP-KI models of AD (Zhang et al., 2016). However, we also found that the NSN21778 compound has poor pharmacokinetics and poorly penetrates the blood-brain barrier (Zhang et al., 2016). Thus, in the present study we focused on the search for additional TRPC6 activators and positive modulators. To achieve this goal, we applied bioinformatics approaches to identify potential TRPC6 activators. The identified compounds were tested in spine rescue assay with neuronal cultures challenged with Aβ oligomers. Based on the in vitro screen, we selected a lead compound and demonstrated that this compound rescues LTP defects in the 5xFAD mouse model of AD. We propose that this compound and its analogs may be useful for development of AD therapeutic agents. The mechanism of action of such agents is focused on synaptic stabilization, and it is complementary with anti-amyloid approaches.
Material and Methods
Chemical Compounds.
N-(2-chlorophenyl)-2-(4-phenylpiperazin-1-yl)acetamide (compound 51164), N-(4-fluorophenyl)-2-(4-(o-tolyl)piperazin-1-yl)acetamide (compound 50741), and 1,1′-(4,6-dihydroxy-1,3-phenylene)bis(propan-1-one) (compound 64402) were obtained from the public chemical library InterBioScreen (Chernogolovka, Russia). 1,1′-(2,4,6-Trihydroxy-1,3-phenylene)bis-1-hexanone (Hyp9) was obtained from Sigma-Aldrich.
Molecular Biology Reagents.
Lenti-TRPC6, lenti-TRPC6-shRNAi, and lenti-Ctrl-shRNAi plasmids were previously described (Zhang et al., 2016). pCSCMV:tdTomato plasmid was a gift from Gerhart Ryffel (Addgene) (Waldner et al., 2009).
Bioinformatical Analyses.
In silico predictions were carried out using the retrained version of Prediction of Activity Spectra for Substances [(PASS); http://www.way2drug.com/passonline] for potential agonists of TRPC6 channels. PASS is a software product for the prediction of biologic activity spectra for chemical compounds based on their structural formula. In the current study, the online version of the PASS program has been used. Structural formulas were presented as MOL files. Prediction of this spectrum by PASS is based on structure-activity relationships analysis of the training set containing about 1 million compounds showing more than 7000 biologic activities. The PASS approach has been previously described in detail (Filimonov et al., 2014). In the PASS training set, active compounds are considered compounds having the quantitative characteristics of activity better than 10−4 M. All other compounds that are less active, or in which their activity is unknown, are considered inactive. The PASS user obtains output information as a list of predicted types of activity with the estimated probability for each type of activity: probability of activity (Pa) and probability of inactivity (Pi). The Pa and Pi values also indicate the estimated probabilities of first-kind and second-kind errors, respectively (Filimonov et al., 2014). The Pa and Pi values vary from 0.000 to 1.000, and in general, Pa ≠ 1 − Pi, since these probabilities are calculated independently. For Pa > 90%, we risk missing about 90% of actually active compounds, but the probability of false-positive predictions is insignificant. For Pa > 80%, we miss only 80% of the active compounds, but the probability of false-positive predictions will be higher, and so forth. Finally, for Pa = Pi, the probabilities of false-positive and false-negative errors will be equal (Filimonov et al., 2014). It should be noted that the Pa value primarily reflects the similarity of the structure of a given molecule to the structures of molecules of the most typical active compounds in the corresponding subset of the training set. Thus, there is no direct correlation between the values of Pa and the quantitative activity characteristics. A really active molecule possessing an atypical molecular structure in the training set may have a low Pa value in the prediction, perhaps even Pa < Pi. Another important aspect of interpreting the prediction results is related to the novelty of the analyzed compound. If we limit ourselves only to activity types predicted with the highest Pa values, the compounds selected by the prediction may prove to be analogs of known pharmacological agents. For example, when Pa > 0.7, the chances of finding experimental activity are rather high, but the compounds found may be close structural analogs of known drugs. If we select the range 0.5 < Pa < 0.7, the chances for detecting experimental activity will be lower, but the compounds will be less similar to known pharmaceutical agents. For Pi < a < 0.5, the chance of detecting experimental activity will be even lower, but if the prediction is confirmed, the compound found may prove to be a parent compound for a new chemical class of the biologic activity examined (Filimonov et al., 2014).
Mice.
Albino outbred mice (Rappolovo Farm, Leningradsky District, Russia) or inbred wild-type (WT) mice (C57BL/6J background) obtained from the Jackson Laboratory were used as a source of brain tissue for experiments with hippocampal cultures. For LTP induction experiments, mice of the 5xFAD mouse line (Oakley et al., 2006) (Jackson Laboratory) were used at the age of 2 and 6 months. Control mice were age-matched WT littermates. All mouse experiments were performed according to the procedures approved by the local animal control authorities.
Mice Genotyping.
The presence of the transgene in 5xFAD mice was checked using a genotyping technique. The necessary DNA material was obtained from the tip of the animal’s tail. The tip was then placed in 125 μl of a SNET buffer [20 mM Tris-HCl, 5 mM EDTA, 400 mM NaCl, 1% SDS (pH 8)] with the addition of 10 μl of K proteinase dissolved in water at a concentration of 10 mg/ml and incubated at a temperature of 55°C for 2–16 hours. Next, 160 μl of phenol/chloroform/isoamyl alcohol was added to the reaction mixture in a ratio of 25:24:1. The content of the test tube was mixed thoroughly and centrifuged at 14,000 rpm for 10 minutes at room temperature. The upper fraction containing the DNA was transferred to a clean tube and stored at a temperature of +4°C. The presence of the transgene was checked by polymerase chain reaction using primers specific to the insertion, causing the expression of the transgenic (human) genes PSEN1 and APP in individual brain neurons. We used the following primers. The primer pair for determining the PSEN1 transgene: 5′ AAT AGA GAA CGG CAG GAG CA 3′ and 5′ GCC AT G AGG GCACT AAT CAT 3′. The primer pair for determining the APP transgene: 5′ AGG ACT GAC CACT CG ACC AG 3′ and 5′ CGG GGG T CT AGT T CT GCA T 3‘. The control primer pair: 5‘ CT A GGC CAC AGA AT T GAA AGA T CT 3′ and 5′ GT A GGT GGA AAT T CT AGC AT C AT C C 3′.
Aβ42 Preparation.
Aβ42 peptides were purchased from AnaSpec (Fremont, CA). A lyophilized aliquot (1 mg) of Aβ42 and Aβ40 peptides was dissolved in 80 µl of 1% NH4OH, and then in 920 µl of sterile PBS to get stock solution with a concentration of 1 mg/ml (stored as 100 µl aliquots at −20°C). Working Aβ solutions were made immediately before treatment of the cells by diluting the stock concentration to 0.1 µM final Aβ peptide concentrations in Neurobasal-A medium (Gibco, Life Technologies). The working solutions were incubated at +4°C for 24 hours to obtain the oligomeric conditions as described by Zheng et al. (2013). On the day of usage, the working solutions were centrifuged at 14,000g at +4°C for 10 minutes to purify the oligomeric Aβ fraction from fibrils. The composition of the supernatant fraction was previously confirmed by denaturating (0.1% SDS) 15% gel electrophoresis followed by western blot with anti-Aβ 6E10 monoclonal antibodies (Covance) (Popugaeva et al., 2015). The supernatant fractions containing Aβ oligomers were used to treat hippocampal cultures.
Primary Hippocampal Cultures.
The hippocampal cultures from albino outbred mice were established from postnatal day 0–2 pups and maintained in culture as described previously (Zhang et al., 2010; Sun et al., 2014; Popugaeva et al., 2015). Both hippocampi from pups were dissected in sterile ice-cold 1X Hanks’ balanced salt solution buffer (pH 7.2). Hippocampi were dissociated in papain solution (Worthington) at 37°C for 30 minutes. To remove large undissociated cell aggregates, the solutions with hippocampal neurons were twice triturated in 1 µg/ml DNAseI (DN-25; Sigma). To remove DNAseI, neurons were centrifuged at 1500 rpm for 4 minutes. Supernatants were discarded and fresh warm (37°C) growth medium [Neurobasal-A (Gibco), 1xB27 (Gibco), 1% heat-inactivated FBS (Gibco), and 0.5 mM L-Glutamine (Gibco)] was added. Neurons were plated in 24-well plates containing 12 mm round Menzel cover slips (d0-1) precoated with 1% poly-D-lysine (Sigma). Neurons were seeded at ∼5 × 10⁴ cells per well (24-well format). Growth medium was changed on the day after plating, and then weekly. In the control experiments, neuronal cultures were treated with an equivalent amount (the same volume as used to prepare the Aβ solutions) of Neurobasal A incubated at +4°C for 24 hours (vehicle).
Calcium-Phosphate Transfection of Primary Hippocampal Cultures.
Calcium-phosphate transfection of primary hippocampal cultures was done as previously described (Zhang et al., 2010; Sun et al., 2014). Changes to the published protocol were in following steps: the volume of transfection reaction added to each well was 25 μl. When GCamp5.3: TRPC6-si/CTRL-si cotransfection was performed the DNA ratio was 1:3.
Dendritic Spine Analysis in Primary Hippocampal Neural Cultures.
For assessment of synapse morphology, hippocampal cultures were transfected with tdTomato plasmid on day 7 of in vitro cultivation using the calcium phosphate method and fixed (4% formaldehyde in PBS, pH 7.4) on day 14 of in vitro cultivation. A Z-stack of the optical section was captured using a 100× objective lens (UPlanSApo; Olympus) with a confocal microscope (Thorlabs). The maximal resolution of each image was 1024 × 1024 pixels, with 0.1 μm/pixel, and averaged six times. The total Z volume was 6–8 μm imaged with a Z interval 0.2 μm. At least 18 transfected neurons for each treatment from three independent experiments were used for quantitative analysis. Quantitative analysis for dendritic spines was performed by using the freely available NeuronStudio software package (Rodriguez et al., 2008) as previously described (Sun et al., 2014). To classify the shape of the neuronal spines in the culture, we adopted an algorithm from the published method (Rodriguez et al., 2008). In the classification of spine shapes we used the following cutoff values: aspect ratio for thin spines (AR_thincrit) = 2.5, head-to-neck ratio (HNRcrit) = 1.4, and head diameter (HDcrit) = 0.45 μm; the Z interval was 0.2 μm. These values were defined and calculated exactly as described by a previous report (Rodriguez et al., 2008).
Fura-2 Ca2+ Imaging Experiments.
Fura-2 Ca2+ imaging experiments of human embryonic kidney (HEK) 293T cells were performed as previously described (Zhang et al., 2016). Briefly, HEK293 cells were transfected with enhanced green fluorescent protein (EGFP) plasmid or a mixture of EGFP and TRPC6 plasmids (at 1:5 ratio), cultured for 40–48 hours, and loaded with Fura2-AM. Fura-2 340/380 ratio images were collected using a DeltaRAM-X illuminator, Evolve camera, and IMAGEMASTER PRO software (all from Photon Technology International) from GFP-positive cells. To test the direct effect of HPF or compound 51164, the cells were loaded with Fura-2 and incubated in artificial cerebrospinal fluid (aCSF) containing the following: 140 mM NaCl, 5 mM KCl, 1 mM MgCl2, 2 mM CaCl2, and 10 mM HEPES (pH 7.3). After basal recordings for 30 seconds, 10 µM HPF or 30 µM of compound 51164 was applied and Ca2+ responses were measured by Fura-2. To test the effect of compound 51164 on 1-oleoyl-2-acetyl-sn-glycerol (OAG) response, cells were moved to aCSF medium containing 0.1 mM Ca2+ for 2 minutes, and then returned to aCSF medium containing 2 mM Ca2+ and 50 µM OAG. These experiments were performed in the absence or presence of 30 µM of compound 51164. The maximal amplitude (peak) of Ca2+ influx was determined from the Fura-2 340/380 nm ratio. All Ca2+ imaging experiments were performed at room temperature.
GCamp5.3 Ca2+ Imaging Experiments.
GCamp5.3 Ca2+ imaging experiments were performed as described previously (Zhang et al., 2015) with some changes in protocol. Cultured hippocampal neurons were transfected with GCamp5.3 expression plasmid using the calcium phosphate transfection method on day 7 of in vitro cultivation. Calcium imaging experiments were performed in a steady bath. GCamp5.3 fluorescent images were collected using Thorlabs upright confocal microscope equipped with a 60×/ 1.00 W lens LUMPlanFL N (Olympus). The experiments were controlled by the Thorimage LS 1.4 image acquisition software package (Thorlabs). To measure spine nSOCE, neurons were moved from aCSF to calcium-free medium containing the following drugs: 400 µM ЕGТА; 1 µM thapsigargin, 10 µM D-2-amino-5-phosphonovaleric acid (D-AP5), 50 µM nifedipine, 10 µM 6-cyano-7-nitroquinoxaline-2,3-dione (CNQX), and 1 µM tetrodotoxin (TTX) for 30 minutes. Then, neurons were subjected to the addition of the 5 µl 2 mM Ca2+. In the case in which the effect of the agonist of TRPC6 channels was studied, this was added to the bath with other drugs. Analysis of the data was performed using ImageJ software. The region of interest used in the image analysis was chosen to correspond to spines. All Ca2+ imaging experiments were performed at room temperature.
Hippocampal Slice Preparation.
The mice were decapitated, and their brains were rapidly removed. The cerebellum and a small section of frontal cortex were removed. A flat surface for mounting the brain was created by making a blocking cut on the dorsal surface parallel to the horizontal plane. The brain was then mounted onto the stage of a vibratome HM 650V (Microm International, Walldorf, Germany), and horizontal sections (400 μm thick) were cut in ice-cold (0°C) aCSF. Artificial cerebrospinal fluid composed of 126 mM NaCl, 2.5 mM KCl, 1.25 mM NaH2PO4, 1 mM MgSO4, 2 mM CaCl2, 24 mM NaHCO3, and 10 mM glucose was bubbled with carbogen (95% O2/5% CO2). The prepared slices were immersed in a chamber with aerated aCSF, which was placed into a temperature-controlled water bath (35°C) for 1 hour. After incubation, the slices were transferred to the recording chamber, where they were kept for 15–20 minutes prior to the electrophysiological study. In this chamber, hippocampal slices were perfused with a constant flow of oxygenated aCSF at a rate of 5 ml/min at room temperature. One to five slices from each mouse were used in the experiment.
Electrophysiological Recordings.
Field excitatory postsynaptic potentials (fEPSPs) were recorded from CA1 stratum radiatum using glass microelectrodes (0.2–1.0 MΩ) filled with aCSF. Synaptic responses were evoked by local extracellular stimulation of the Schaffer collaterals using tungsten bipolar electrodes (Microprobes for Life Science) placed in the stratum radiatum at the CA1-CA2 border. The stimulation was performed with rectangular paired pulses (duration, 0.1 millisecond; interstimulus interval, 50 milliseconds) every 20 seconds. The dependence of the field response amplitude on the stimulation strength was determined by increasing the current intensity from 20 to 200 μA via an A365 stimulus isolator (World Precision Instruments). The stimulus intensity used in the experiment was chosen such that the amplitude of the fEPSPs would be 40%–50% of the amplitude where the population spike appeared for the first time. The strength of the stimulation was unvaried during the experiments, usually being 50–150 μA. For each fEPSP, the amplitude and slope of the rising phase at a level of 20%–80% of the peak amplitude were measured. The LTP induction was started only if stable amplitude of the baseline fEPSP had been recorded for 20 minutes. LTP was induced by theta-burst stimulation (TBS) protocol, consisting of five bursts of five 100 Hz pulses, with a 200-millisecond interval between bursts, and applied five times every 10 seconds. The fEPSPs were recorded after induction protocol for 40 minutes. Responses were amplified using an amplifier model 1800 (A-M Systems), digitized, and recorded on a personal computer using ADC/DAC NI USB-6211 (National Instruments) and WinWCP version 5.2.2 software. Electrophysiological data were analyzed with the Clampfit 10.2 program (Axon Instruments). The baseline fEPSPs and the potentiated fEPSPs (recorded 30–40 minutes after TBS) were averaged separately to measure LTP. The plasticity value was calculated as the ratio of the slope of the rising phase in the averaged potentiated and baseline fEPSPs.
Statistical Analyses.
The results are presented as mean ± S.D. Statistical significance was assessed by one-way ANOVA following Dunnett’s post hoc test, two-way repeated measures ANOVA following Tukey’s post hoc test, or Kruskal-Wallis ANOVA where appropriate. The P values are indicated in the figure legends. The data were processed with Statistica 8.0 (StatSoft) and OriginPro 8.
Results
Bioinformatics Search for TRPC6 Activators.
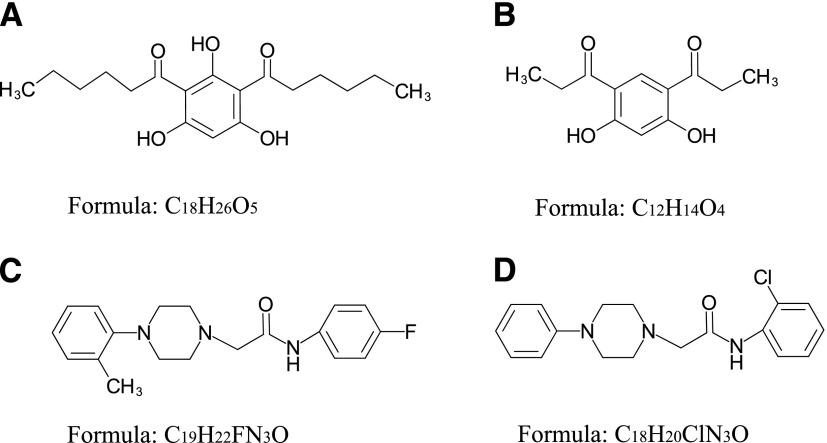
In our search, we focused on finding the TRPC6 activators that differ in structure from compound NSN21778. Using the Intergrity database (Clarivate Analytics), we searched for known ligands of TRPC6 channels (agonists and antagonists). We found six potential activators of TRPC6 (Supplemental Material; Table 1). The Integrity identifications for these compounds are the following: HYP-1, HYP-5, HYP-9, 830288, 871099, and 880395. However, most of these molecules, except HYP-9 (Fig. 1A), were not available for experimental testing. Therefore, we searched for chemical analogs of these molecules in public chemical libraries. As a result of this search, we identified several analogs in the InterBioScreen chemical library (Supplemental Material). We selected four candidate compounds from this list based on the high percentage (≥88%) of coincidence with the structures of the desired compounds. These compounds are 64402 (analog of HYP-1), 50741 (analog of 880395), and 51164 (analog of 871099) (Fig. 1, B–D; Tables 2 and 3).
TABLE 1.
List of TRPC6 agonists from the Clarivate Analytics Integrity database
| Integrity ID | IUPAC Name | Structural Formula | Molecular Mechanism | Therapeutic Group |
|---|---|---|---|---|
| HYP-1 | 2,4-Bis(3-methylbutyryl)phloroglucinol 2,4-bis(3-methylbutyryl)-1,3,5-trihydroxybenzene | 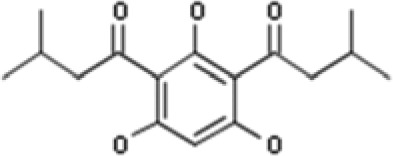 |
1) TRPC6 agonists; 2) leukotriene CysLT1 (LTD4) antagonists; 3) antagonists free fatty acid receptor 1 (FFAR1; PR40); 4) agonists signal transduction modulators; 5) prostanoid thromboxane receptors antagonists; and 6) leukotriene antagonists | 1) Antiallergy/antiasthmatic drugs; 2) antiviral; and 3) agents for type 2 diabetes |
| HYP-5 | 1,1′-(2,4,6-Trihydroxybenzene-1,3-diyl)bis(4-methylpentan-1-one) | 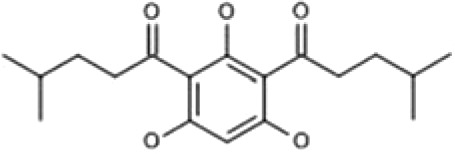 |
1) TRPC6 Agonists | 1) Treatment of cognition disorders |
| HYP-9 | 1,1′-(2,4,6-Trihydroxybenzene-1,3-diyl)dihexan-1-one |  |
1) TRPC6 Agonists | 1) Treatment of cognition disorders |
| 830288 | [4-(5-Chloro-2-methylphenyl)piperazin-1-yl](3-fluorophenyl)methanone | 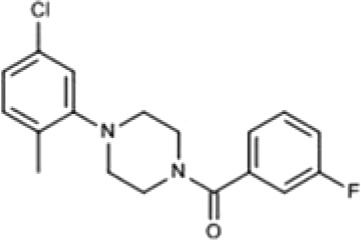 |
1) TRPC6 Agonists | 1) Psychiatric disorders (not specified); and 2) treatment of neurodegenerative diseases |
| 871099 | N-(2-Chlorophenyl)-2-[4-(2,3-dimethylphenyl)piperazin-1-yl]acetamide trifluoroacetate | 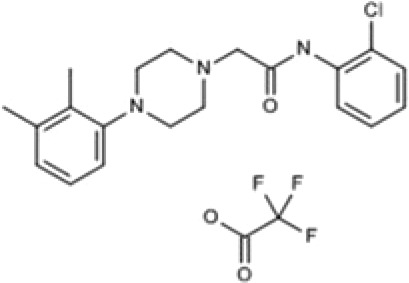 |
1) TRPC6 agonists; and 2) TRPC3 agonists | 1) Psychiatric disorders (not specified); and 2) treatment of neurodegenerative diseases |
| 880395 | 2-[4-(2,3-Dimethylphenyl)piperazin- 1-yl]-N-(2-fluorophenyl)acetamide trifluoroacetate | 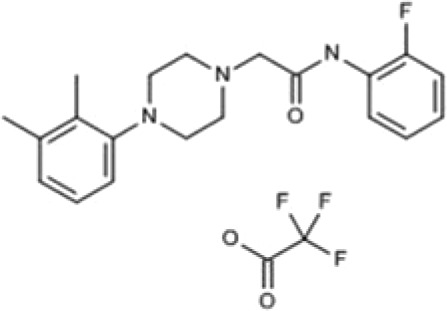 |
1) TRPC6 agonists; and 2) TRPC3 agonists | 1) Psychiatric disorders (not specified); and 2) treatment of neurodegenerative diseases |
ID, identification; IUPAC, International Union of Pure and Applied Chemistry.
Fig. 1.
Chemical structures of potential TRPC6 modulators identified as a result of bioinformatics search. (A) HYP-9, (B) compound 64402, (C) compound 50741, and (D) compound 51164. Compounds 64402, 50741, and 51164 were found in the InterBioScreen library.
TABLE 2.
Biologic activities of selected compounds predicted by the PASS Online web service for the mechanism of action
| Mechanism of Action | Compound Number |
|||||||
|---|---|---|---|---|---|---|---|---|
| Hyp9 | 64402 | 50741 | 51164 | |||||
| Structure identity (%) | 100 | 100 | 91.82 | 91.82 | 90.24 | 90.24 | 88.12 | 88.12 |
| Analog | Hyp9 | Hyp9 | HYP1 | HYP1 | 880395 | 880395 | 871099 | 871099 |
| Activity | Pa | Pi | Pa | Pi | Pa | Pi | Pa | Pi |
| Calcium channel (voltage-sensitive) activator | 0.540 | 0.052 | 0.546 | 0.048 | 0.494 | 0.083 | 0.624 | 0.017 |
| Neuropeptide Y2 antagonist | 0.229 | 0.159 | 0.217 | 0.177 | 0.571 | 0.008 | 0.629 | 0.004 |
| Sigma receptor agonist | 0.157 | 0.146 | 0.198 | 0.135 | 0.288 | 0.082 | 0.484 | 0.028 |
| Calcium channel activator | 0.224 | 0.104 | 0.291 | 0.038 | 0.338 | 0.026 | 0.368 | 0.018 |
| Acetylcholine neuromuscular blocking agent | — | — | 0.599 | 0.023 | 0.484 | 0.084 | 0.481 | 0.087 |
—, no data available.
TABLE 3.
Biologic activities of selected compounds predicted by the PASS Online web service possible adverse and toxic effects
| Adverse and Toxic Effect | Compound Number |
|||||||
|---|---|---|---|---|---|---|---|---|
| Hyp9 | 64402 | 50741 | 51164 | |||||
| Activity | Pa | Pi | Pa | Pi | Pa | Pi | Pa | Pi |
| Gastrointestinal hemorrhage | 0.695 | 0.026 | 0.714 | 0.021 | 0.389 | 0.157 | 0.615 | 0.050 |
| Multiple organ failure | 0.600 | 0.060 | 0.677 | 0.037 | 0.394 | 0.156 | 0.762 | 0.018 |
| Toxic vascular/respiration | 0.798v | 0.018v | 0.885r | 0.019r | 0.096v | 0.403v | 0.254v | 0.241v |
| Carcinogenic. group 1 | 0.306 | 0.055 | 0.357 | 0.033 | 0.115 | 0.401 | 0.200 | 0.161 |
| Cardiodepressant | 0.491 | 0.021 | 0.455 | 0.026 | 0.044 | 0.342 | 0.196 | 0.145 |
| Carcinogenic. group 2A | 0.155 | 0.099 | 0.198 | 0.064 | 0.057 | 0.242 | 0.169 | 0.087 |
r, respiration; v, vascular.
By using the PASS program, we evaluated the biologic activity, toxicity, and mutagenicity of HYP-9 and three compounds from the InterBioScreen database (compounds 64402, 50741, and 51164). The PASS program utilizes only structural data to predict activity of the compound. TRPC6 is a novel target for pharmacological studies, and it is unlikely to identify TRPC6 agonist biologic activity by using the PASS software. Instead, we were searching for compounds that demonstrate some activity toward calcium channels. We were also interested in working with compounds that do not possess adverse and toxic effects or at least demonstrate moderate toxicity. According to the PASS data (Tables 2 and 3) all four compounds demonstrate abilities to activate voltage-sensitive calcium channels with Pa values in the range from 0.49 to 0.624, with the maximum value for compound 51164 and the minimum value for compound 50741. The PASS program has shown another biologic activity named the calcium channel activator (Tables 2 and 3). The probability of activity to activate calcium channels was in the range from 0.22 to 0.368, with the maximum value for compound 51164 and the minimum value for Hyp9 (Tables 2 and 3). The PASS Online software allows one to estimate probable adverse and toxic effects of selected compounds. Compounds 50741 and 51164 are not predicted to demonstrate such toxic effects as carcinogenic, cardiodepressant, or vascular/respiration toxicity, showing Pa values near 0.2 (Tables 2 and 3). However, compound 51164 is predicted to demonstrate such adverse effects as gastrointestinal hemorrhage and multiple organ failure with Pa values in the range from 0.56 to 0.78 (Tables 2 and 3). Compound 50741 is predicted to have a moderate adverse effect at Pa = 0.38 for gastrointestinal hemorrhage and Pa = 0.39 for multiple organ failure (Tables 2 and 3). In contrast, compounds Hyp9 and 64402 are predicted to demonstrate moderate carcinogenic and cardiodepressant activities with Pa values in the range from 0.30 to 0.49 (Tables 2 and 3). In addition, compounds Hyp9 and 64402 both are predicted to demonstrate high adverse and toxic effects such as gastrointestinal hemorrhage and multiple organ failure with Pa values in the range from 0.60 to 0.88 (Tables 2 and 3).
Validation of Biologic Activities of Selected Compounds—Potential Agonists of TRPC6.
Previously, we developed an in vitro model of amyloid synaptotoxicity (Popugaeva et al., 2015). We have shown that this model is a useful tool for validating molecules that are able to protect synaptic spines from amyloid synaptotoxicity. Thus, we used this model as a screening assay to validate the neuroprotective effects of the selected compounds. Previously, we have shown that HPF at 30 nM concentration protects mushroom spines in APP-KI neurons (Zhang et al., 2016). It has been previously shown that HPF is a direct activator of TRPC6 channels (Leuner et al., 2007). Thus, HPF was used as a positive control in our experiments.
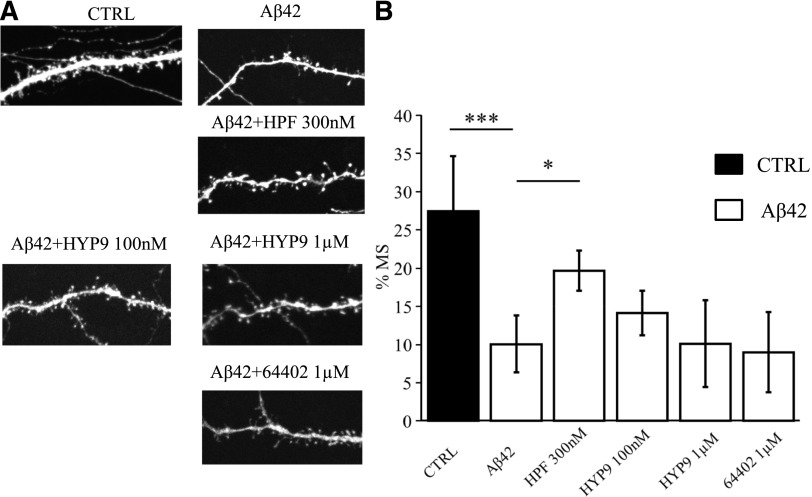
We started the validation process from the known activator of TRPC6, compound HYP9 (Leuner et al., 2010). At 100 nM concentration for HYP9, there was a trend in the ability of Hyp9 to protect mushroom spines (MS) from amyloid toxicity, although it did not reach a level of statistical significance [%MS in the Aβ42 group was 10% ± 4% in comparison with %MS in the Aβ42 + HYP9 (100 nM) group (14% ± 3%), P ˃ 0.05 by one-way ANOVA with Dunn-Sidak post hoc, n ≥ 16 neurons from two independent cultures] (Fig. 2). At 1 µM concentration, HYP9 did not protect mushroom spines from amyloid toxicity in our experiments [%MS in the Aβ42 group was 10% ± 4% in comparison with %MS in the Aβ42 + HYP9 (1 µM) group (10% ± 6%), P ˃ 0.05 by one-way ANOVA with Dunn-Sidak post hoc, n ≥ 16 neurons from two independent cultures] (Fig. 2). As expected from our previous studies (Zhang et al., 2016), HPF protected mushroom spines from amyloid toxicity at 300 nM concentration [%MS in the Aβ42 group was 10% ± 4% in comparison with %MS in the Aβ42 + HPF (300 nM) group (20% ± 3%), P = 0.028 by one-way ANOVA with Dunn-Sidak post hoc, n ≥ 16 neurons from two independent cultures] (Fig. 2).
Fig. 2.
Evaluation of protective effects of HYP9 and compound 64402 in conditions of amyloid synaptotoxicity. (A) Representative confocal images of day 14 of in vitro cultivation hippocampal neurons transfected with tdTomato plasmid. Images for control (CTRL) cultures and cultures exposed to oligomeric Aβ42 are shown as indicated. HPF was added at the concentration of 300 nM, HYP9 was tested at concentrations of 100 nM and 1 µM as indicated, compound 64402 was tested at the 1 µM concentration. (B) The average percentages of mushroom spines (%MS) in each experimental condition are present as mean ± S.D. (n ≥ 16 neurons for each group). Untreated hippocampal cultures (CTRL) are shown as the filled bar. Open bars correspond to hippocampal cultures that were treated with oligomeric Aβ42. *P < 0.05; ***P < 0.0005 by one-way ANOVA, following Dunn-Sidak post hoc test.
Next, we tested compound 64402, which has the highest percentage of similarity (91%) to the structure of HYP-1 (known activator of TRPC6) (Leuner et al., 2010) (Tables 2 and 3). We determined that compound 64402 did not show a neuroprotective effect at the concentration of 1 µM [%MS in the Aβ42 group was 10% ± 4% in comparison with %MS in the Aβ42 + 64402 (1µM) group (9% ± 5%), P ˃ 0.05 by one-way ANOVA with Dunn-Sidak post hoc, n ≥ 16 neurons from two independent cultures] (Fig. 2).
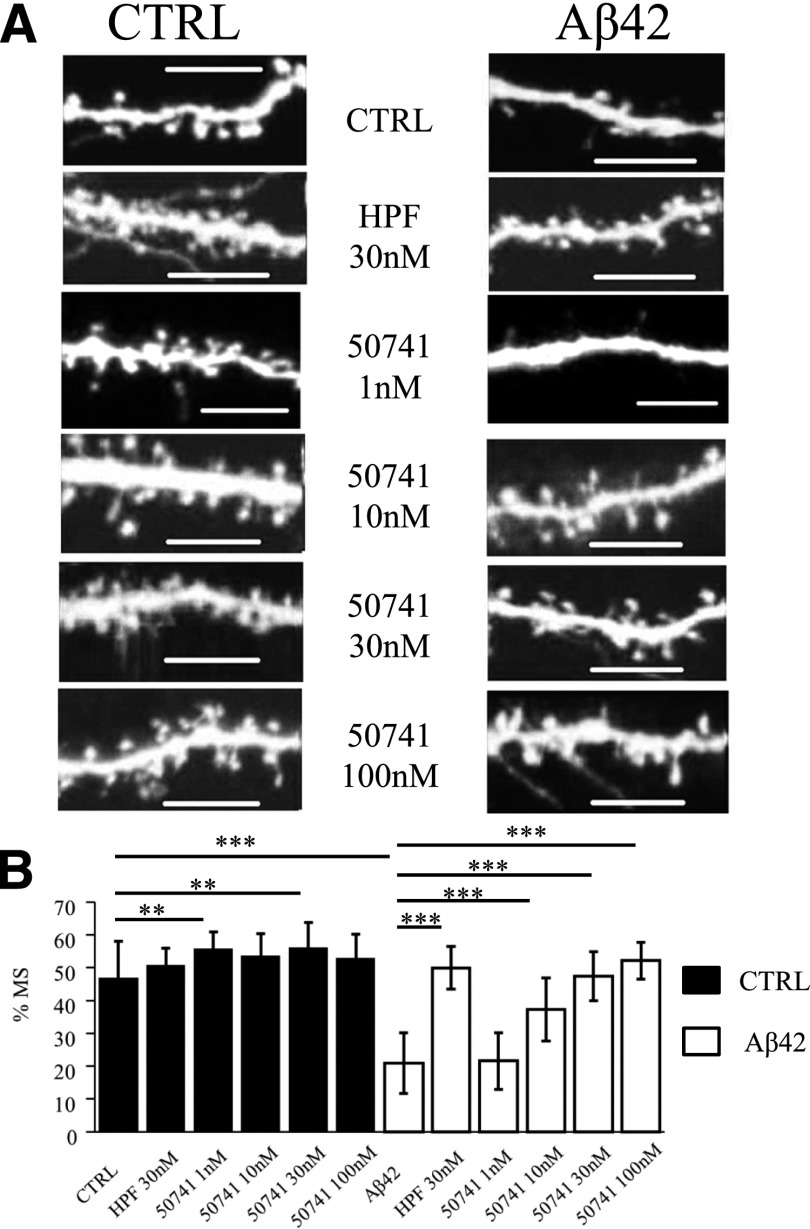
Next, we tested compound 50741, which shows a high percentage of similarity (90.24%) with the known TRPC6 activator compound 880395 from the Clarivate Analytics Integrity database (Tables 2 and 3). We have observed that compound 50741 demonstrates neuroprotective effects at concentrations of 10 and 30 nM, recovering the percentage of mushroom spines in the Aβ42-treated group from 21% ± 10% to 37% ± 2% and 47% ± 2%, respectively (P < 0.0001 by two-way ANOVA with Dunn-Sidak post hoc test, n ≥ 46 neurons from three independent cultures) (Fig. 3A; Fig. 4B). At 1 nM concentration, compound 50741 did not protect hippocampal neurons from Aβ42 toxicity [%MS in the Aβ42 + 50741 (1 nM) group was 22% ± 2%, n ≥ 46 neurons] (Fig. 3A; Fig. 4B).
Fig. 3.
Evaluation of protective effects of compound 50741 in conditions of amyloid synaptotoxicity. (A) Representative confocal images of day 14 of in vitro cultivation hippocampal neurons transfected with tdTomato plasmid. Images for control (CTRL) cultures and cultures exposed to oligomeric Aβ42 are shown as indicated. HPF was added at the concentration of 30 nM, compound 50741 was tested at concentrations of 1, 10, 30, and 100 nM as indicated. Scale bar, 10 µm. (B) The average percentages of mushroom spines (%MS) in each experimental condition are present as mean ± S.D. (n = 22–32 neurons for each group). Untreated hippocampal cultures (CTRL) are shown as filled bars. Open bars correspond to hippocampal cultures that were treated with oligomeric Aβ42. **P < 0.005; ***P < 0.0005 by two-way ANOVA with Dunn-Sidak post hoc test.
Fig. 4.
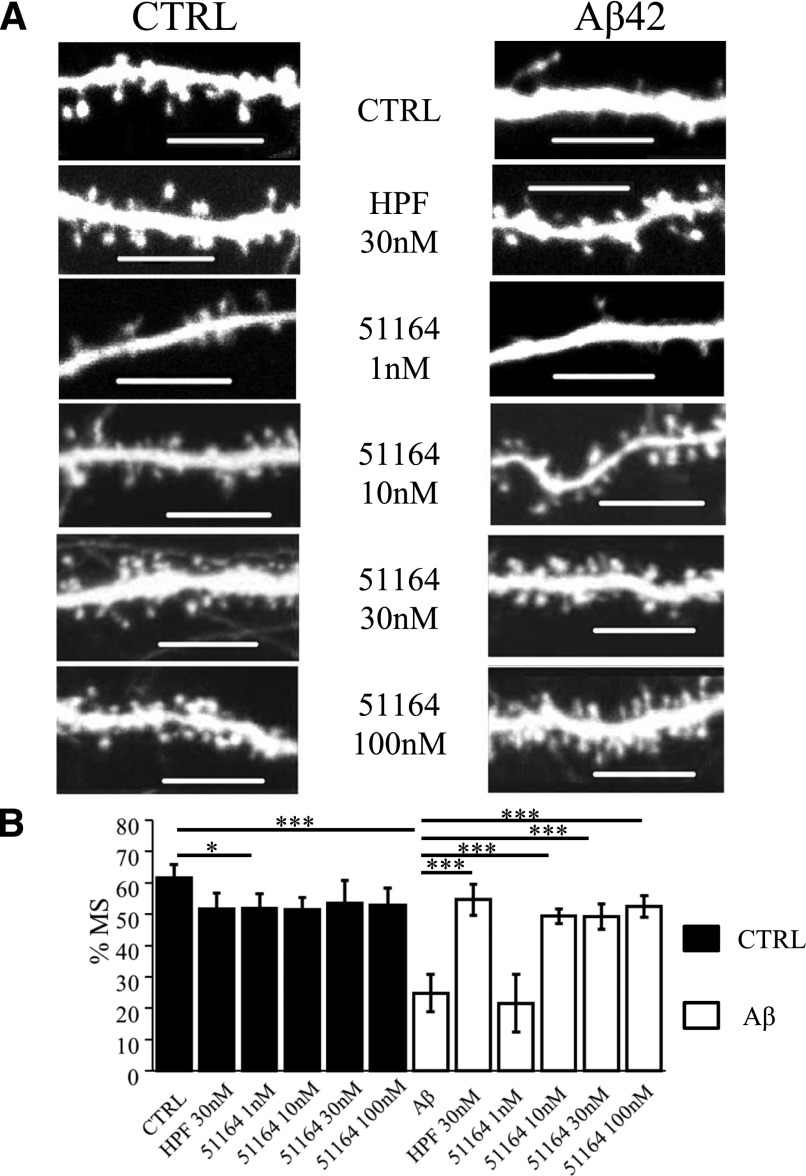
Evaluation of the protective effects of compound 51164 in conditions of amyloid synaptotoxicity. (A) Representative confocal images of day 14 of in vitro cultivation hippocampal neurons transfected with tdTomato plasmid. Images for control (CTRL) cultures and cultures exposed to oligomeric Aβ42 (Aβ) are shown as indicated. HPF was added at the concentration of 30 nM, compound 51164 was tested at concentrations of 1, 10, 30, and 100 nM as indicated. Scale bar, 10 µm. (B) The average percentages of mushroom spines (%MS) in each experimental condition are present as mean ± S.D. (n = 22–32 neurons for each group). Untreated hippocampal cultures (CTRL) are shown as filled bars. Open bars correspond to hippocampal cultures that were treated with oligomeric Aβ42. *P < 0.05; ***P < 0.0005 by two-way ANOVA with Dunn-Sidak post hoc test.
Next, we tested compound 51164, which shows 88% similarity to compound 871099 from the Clarivate Analytics Integrity database (Tables 2 and 3). We discovered that at 10 nM concentration compound 51164 fully rescued mushroom spines in Aβ42-treated neurons (%MS was 49% ± 1%, n ≥ 46 neurons) (Fig. 4). This compound was also active in 30 and 100 nM concentrations (Fig. 4). It lost its activity at 1 nM concentration [%MS in the Aβ42 + 51164 (1 nM) group was 23% ± 2%, n ≥46 neurons] (Fig. 4). Based on the obtained results we chose compound 51164 as the lead compound for further investigation since the synaptoprotective activity of this compound was most robust in the spine protection assay (Fig. 4) and this compound was predicted to have a favorable toxicological profile (Tables 2 and 3).
Verification of TRPC6 Channels as the Target for Compound 51164.
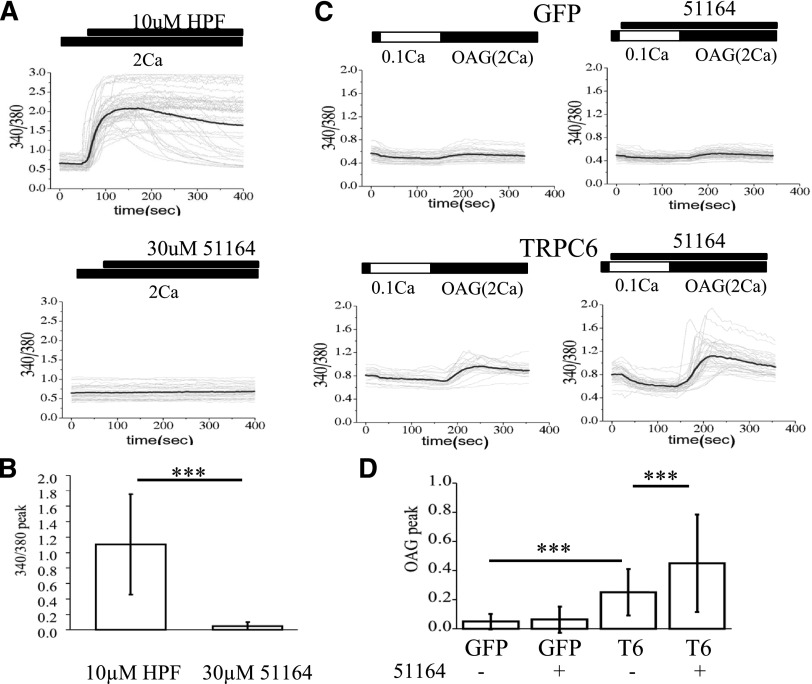
From the literature, compound 51164 is an analog of the known activator of TRPC6 [derivative of piperazine (PPZ), 871099]. Next, we aimed to determine if compound 51164 is indeed able to activate calcium influx via TRPC6 channels. In these experiments we used previously established HEK cell lines that were transiently transfected either with GFP or TRPC6-expressing plasmids (Zhang et al., 2016). To evaluate the effects of compound 51164, we performed a series of Fura-2 Ca2+ imaging experiments. Hyperforin was used as a positive control in these experiments. In standard recording conditions (2 mM extracellular Ca2+), addition of 10 µM HPF induced a rapid and strong response in the HEK-TRPC6 cell line [the peak amplitude for HPF-treated HEK-TRPC6 cells was 1.0 ± 0.2 arbitrary units (a.u.) (n ≥ 40)] (Fig. 5, A and B). In contrast, even 30 µM of compound 51164 failed to elicit Ca2+ response in the HEK-TRPC6 cell line under these conditions (Fig. 5, A and B). Thus, compound 51164 does not appear to act as a direct agonist of TRPC6 channels.
Fig. 5.
Compound 51164 acts as a positive modulator of TRPC6 channels. (A) Time course of Fura-2 fluorescence Ca2+ signals (340/380 ratio) is shown for HEK293 cells transfected with EGFP + TRPC6 plasmids. Traces from individual cells are shown as thin gray lines, and average traces are shown as thick black lines. Cells were incubated in aCSF medium containing 2 mM Ca2+. The time of addition of 10 µM HPF or 30 µM of compound 51164 is indicated by black bars above the Fura-2 traces. (B) Average amplitude of Ca2+ influx peak is shown as the change in 340/380 Fura-2 ratio signals for the cells exposed to HPF or compound 51164. The results are presented as mean ± S.D. (n = 40 cells). ***P < 0.0001 by two-way ANOVA with Tukey’s post hoc test. (C) Time course of Fura-2 fluorescence Ca2+ signals (340/380 ratio) is shown for HEK293 cells transfected with EGFP (GFP) or EGFP + TRPC6 (TRPC6) plasmids as indicated. Traces from individual cells are shown as thin gray lines, and average traces are shown as thick black lines. Cells were moved to modified aCSF medium containing 0.1 mM Ca2+ for 2 minutes, and then returned to the medium containing 2 mM Ca2+ with the addition of 50 µM of OAG. The time of addition of 30 µM of compound 51164 is indicated by black bars above the Fura-2 traces. (D) Average amplitude of Ca2+ influx peak is shown as the change in 340/380 Fura-2 ratio signals for each group of cells tested in experiments shown in (C). The results are presented as mean ± S.D. (n = 40 cells). ***P < 0.0001 by two-way ANOVA with Tukey’s post hoc test.
In our previous studies, we demonstrated that compound NSN21778 potentiates activity of TRPC6 channels in conditions of store depletion and in an OAG-dependent manner (Zhang et al., 2016). OAG is a synthetic cell permeant analog of diacylglycerol, a known activator of TRPC6 channels (Estacion et al., 2004). Thus, we decided to investigate whether compound 51164 acts in a similar way. In these experiments, HEK293 cells transfected with EGFP or EGFP + TRPC6 cells were incubated in conditions of partially depleted stores (0.1 mM extracellular Ca2+) for 2 minutes, and then the extracellular medium was changed to solution containing 2 mM Ca2+ in the presence of 50 µM OAG. Application of 50 µM OAG by itself did not induce Ca2+ influx in EGFP-transfected HEK cells (data not shown). EGFP-transfected HEK cells had a small response to application of 50 µM OAG in conditions of partial store depletion, and this response was not affected by application of 30 µM of compound 51164 (Fig. 5, C and D). In contrast, TRPC6-transfected HEK cells responded to the application of 50 µM OAG in conditions of partial store depletion (Fig. 5C), with the average amplitude of the response being equal to 0.25 ± 0.025 a.u. (n = 239) (Fig. 5D). Application of compound 51164 at the 30µM concentration facilitated the Ca2+ response in TRPC6-transfected HEK cells in these conditions (Fig. 5C), with the average response being equal to 0.45 ± 0.05 a.u. (n = 214) (Fig. 5D), significantly (P < 0.0001 by two-way ANOVA with Tukey’s post hoc) higher than in the absence of compound 51164. Based on the obtained results, we concluded that compound 51164 acts as a positive modulator of TRPC6 channels, a mechanism of action similar to compound NSN21778.
Compound 51164 Restores nSOCE in Hippocampal Neurons Treated with Aβ42.
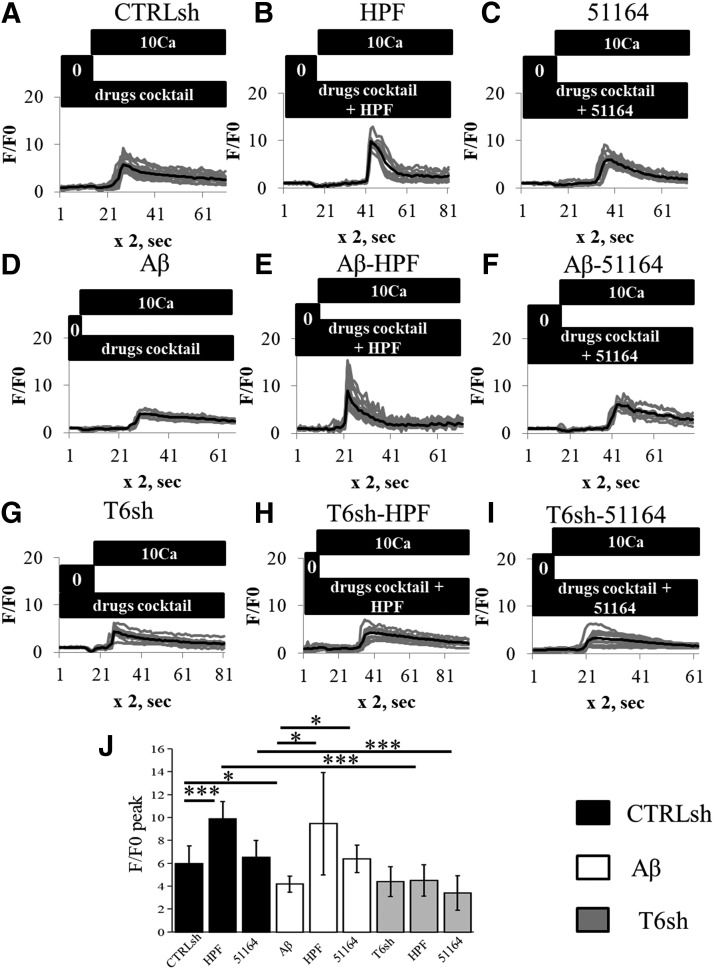
To investigate whether compound 51164 activates endogenous synaptic nSOCE, we performed Ca2+ imaging experiments with hippocampal neuronal cultures transfected with GCamP5.3. On the day of imaging, cover glasses with neurons were incubated in Ca2+-free media in the presence of Ca2+ channel inhibitors for 30 minutes. Following elevation of extracellular Ca2+ to 10 mM, Ca2+ influx was reported by GCamP5.3 (Fig. 6A). The average size of the response observed in synaptic spines was 6 ± 2 a.u. (n ≥ 60 spines from three independent cultures) (Fig. 6J). These responses were significantly facilitated in the presence of 300 nM HPF, which was used as a positive control (Fig. 6B). On average, the size of the response in the presence of HPF was increased to 10 ± 1 a.u. (n ≥ 60 spines from three independent cultures) (Fig. 6J), significantly higher than in control conditions (P < 0.0001 by Kruskal-Wallis ANOVA). These data support the important role of TRPC6 channels in mediating spine nSOCE, which is in agreement with our previous observations (Zhang et al., 2016). In contrast, Ca2+ responses were not affected by the presence of 300 nM of compound 51164 (Fig. 6, C and J). Preincubation of hippocampal cultures with Aβ42 oligomers (100 nM Aβ42 oligomers were present in the culture for 3 days) downregulated nSOCE in hippocampal neurons (Fig. 6D). The average amplitude of nSOCE in these conditions was 4 ± 1 a.u. (n ≥ 60 spines from three independent cultures) (Fig. 6J), significantly lower than in control conditions (P < 0.01 by Kruskal-Wallis ANOVA). Incubation with 300 nM HPF was able to restore the amplitude of nSOCE in Aβ42-treated cultures (Fig. 6E), with the average amplitude of the response equal to 10 ± 4 a.u. (n ≥ 60 spines from three independent cultures) (Fig. 6J), significantly higher than in Aβ42-treated cultures alone (P < 0.01 by Kruskal-Wallis ANOVA). Incubation with compound 51164 was also able to restore nSOCE amplitude in hippocampal neurons treated with Aβ42 (Fig. 6F). The average amplitude of nSOCE in the presence of compound 51164 was equal to 6 ± 1 a.u. (n ≥ 60 spines from three independent cultures) (Fig. 6J), which is the same as in the control conditions and significantly higher than in Aβ42-treated cultures alone (P < 0.05 by Kruskal-Wallis ANOVA). To further confirm that TRPC6 is a modulator of nSOCE by compound 51164, we transfected neuronal cultures with the plasmid expressing shTRPC6 RNAi. We observed that the absence of TRPC6 caused downregulation of nSOCE amplitude in HPF and compound 51164 pretreated neurons to 4 ± 1 and 3 ± 1, respectively (with P < 0.0001 by Kruskal-Wallis ANOVA) (Fig. 6, G–I). From these experiments, we concluded that compound 51164 is able to restore synaptic nSOCE in hippocampal neurons suppressed by incubation with Aβ42 oligomers.
Fig. 6.
Compound 51164 rescues Aβ42-supressed nSOCE in hippocampal postsynaptic dendritic spines. (A–I) The time course of GCaMP5.3 fluorescence signal changes in the spines of hippocampal neurons at day 14 of in vitro cultivation. Neurons were preincubated in Ca2+ free media, and 10 mM Ca2+ was added as indicated by the black bar above the traces. The experiments were performed in the presence of a drug cocktail of Ca2+ inhibitors as described in Materials and Methods. The presence of 300 nM HPF or 300 nM of compound 51164 is indicated above the GCaMP5.3 traces. For each experimental group, individual spine (thin gray lines) and average (thick black lines) fluorescence traces are shown. Results with control (CTRL) neurons are shown in (A–C). Results with neurons preincubated with Aβ42 oligomers (Aβ) are shown in (D–F) as indicated. Results depicted in (A–F) were obtained in the presence of control shRNA (CTRLsh). Results with neurons transfected with shTRPC6 (T6sh) plasmids are shown in (G–I). (J) The average nSOCE spine peak amplitude is shown for each group of cells depicted in (A–I). The F/F0 changes in GCaMP5.3 fluorescence are presented as mean ± S.D. (n = 20 spines),*P < 0.05; ***P < 0.0005 by Kruskal-Wallis ANOVA.
Compound 51164 Restores Long-Term Potentiation Deficit in 6-Month-Old 5xFAD Mice.
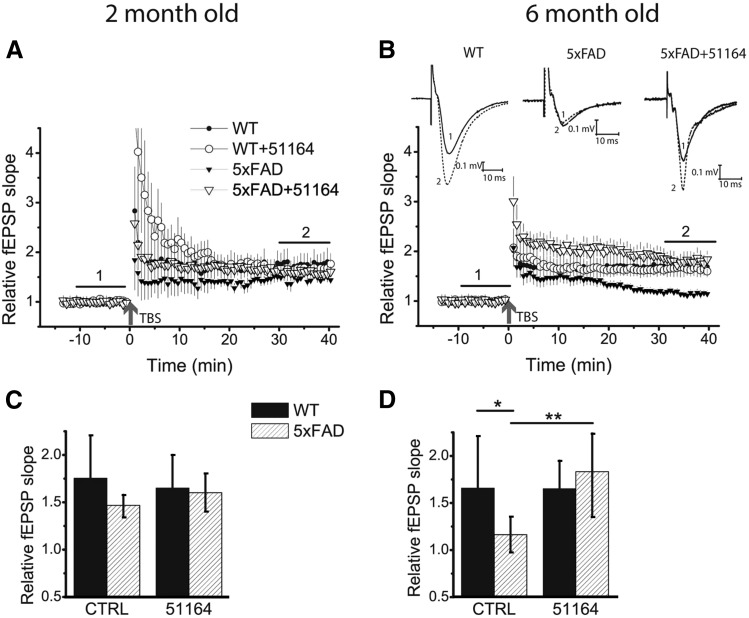
Next, we evaluated the effects of compound 51164 in LTP experiments with hippocampal slices from the 5xFAD mouse model. LTP was induced in hippocampal Schaffer collateral-CA1 synapses by the TBS protocol. In agreement with published data, LTP induction was significantly affected in hippocampal slices from 5xFAD mice in an age-dependent manner (Oakley et al., 2006; Kimura and Ohno, 2009). No difference was found between 5xFAD and WT mice at 2 months of age (Fig. 7, A and C), while 6-month-old 5xFAD mice showed significant impairment of LTP (Fig. 7B). On average, 30 minutes after TBS stimulation the relative fEPSP slope for WT slices was 1.62 ± 0.8 a.u. (n = 8 slices), and for 5xFAD it was 1.25 ± 0.2 a.u. (n = 12), significantly lower (Fig. 7D, P = 0.04). Incubation with 100 nM of compound 51164 had no effect on LTP recorded in 2-month-old WT or 5xFAD hippocampal slices (Fig. 7, A and B). Pretreatment of hippocampal slices from 6-month-old animals with 100 nM of compound 51164 for 30 minutes had no significant effect on LTP in WT slices (Fig. 7, B and D, P = 0.99). However, 30-minute pretreatment with 100 nM of compound 51164 completely rescued the LTP deficit in slices from 5xFAD mice (Fig. 7B; no difference between WT and 5xFAD mice treated with compound 51164, P = 0.79). On average, 30 minutes after TBS stimulation the relative fEPSP slope for 5xFAD slices treated with compound 51164 was 1.8 ± 0.4 a.u. (n = 9), significantly higher (P = 0.02) than in 5xFAD slices alone (Fig. 7D). From these results, we concluded that exposure to compound 51164 was sufficient to rescue LTP defects in 6-month-old 5xFAD mice.
Fig. 7.
Compound 51164 recovers LTP induction in slices from 6-month-old 5xFAD mice. (A and C) LTP is not altered in hippocampal slices from 2-month-old 5xFAD mice. Incubation of slices with 100 nM of compound 51164 does not influence LTP induction in slices from 2-month-old WT and 5xFAD mice (3–5 mice per group). Two-way ANOVA, F1,14 = 0.64, P = 0.44 [WT (n = 4 slices); WT (compound 51164) (n = 5); 5xFAD (n = 3); 5xFAD (compound 51164) (n = 6)]. (B and D) LTP is impaired in hippocampal slices from 6-month-old 5xFAD mice. Incubation of 5xFAD slices from 6-month-old 5xFAD mice with 100 nM of compound 51164 recovers LTP induction. Two-way ANOVA following Tukey’s post hoc test, F1,31 = 6.31, P = 0.02. In 6-month-old WT slices compound 51164 does not change LTP (P = 0.99) [WT (n = 8); WT (compound 51164) (n = 6); 5xFAD (n = 12); 5xFAD (compound 51164) (n = 9)]. *P < 0.05; **P < 0.01].
Discussion
We previously demonstrated that downregulation of the synaptic nSOCE mechanism may contribute to synaptic loss in AD (Sun et al., 2014; Popugaeva et al., 2015; Zhang et al., 2015). Moreover, we identified compound NSN21778, which is able to upregulate TRPC6-mediated nSOCE in the hippocampal neurons and demonstrated that this compound is able to prevent synaptic loss and rescue LTP defects in hippocampal neurons from AD mouse models (Zhang et al., 2016). However, there are some limitations to using compound NSN21778 as a potential therapeutic agent. Compound NSN21778 does not have optimal pharmacokinetic properties and has poor penetrance across the blood-brain barrier. Another known TRPC6 activator is HPF. Hyperforin is a natural product that has been demonstrated to have beneficial effects in AD mouse models (Dinamarca et al., 2006; Cerpa et al., 2010; Griffith et al., 2010; Inestrosa et al., 2011). However, HPF is very difficult to synthesize and long-term incubation with HPF results in apoptosis of hippocampal neurons (Zhang et al., 2016). In the current study, we focused on identification of TRPC6 activators that have a different chemical structure than compound NSN21778 or HPF. We reasoned that such molecules may provide novel leads for development of AD therapeutic agents.
We performed a bioinformatics search for potential TRPC6 agonists and modulators and identified six candidate molecules in the Clarivate Analytics Integrity database (Table 1). However, most of these molecules were not available for experimental testing. Therefore, we searched for chemical analogs of these molecules and identified several compounds in the InterBioScreen chemical library. Based on the highest percentage of coincidence with the structure of the desired compound, we selected four candidate compounds from this list for testing (Fig. 1). We performed further bioinformatics analysis of these compounds using the PASS program (Filimonov et al., 2014), and established that compounds 50741 and 51164 are not predicted to demonstrate such toxic effects as carcinogenic, cardiodepressant, or vascular/respiration toxicity (Tables 2 and 3). We exposed neuronal cultures to Aβ42 oligomers and evaluated the ability of these four compounds to rescue Aβ42-induced loss of mushroom spines. In our experiments, HPF was used as a positive control, since it is a well-established TRPC6 activator that can rescue mushroom spine loss in AD models (Zhang et al., 2016). Based on the obtained results (Figs. 2–4) we selected compound 51164 as our lead molecule. This compound was able to rescue Aβ42-induced loss of mushroom spines in 10 nM concentration (Fig. 4), and it also has a favorable toxicity profile as predicted by PASS (Tables 2 and 3).
Compound 51164 is a derivative of PPZ (Fig. 1D). It has been previously established that derivatives of PPZs activate TRPC6 channels (Bon and Beech, 2013), with the proposed mechanism of action related to activation of the BDNF pathway (Sawamura et al., 2016). We evaluated the ability of compound 51164 to activate TRPC6 channels in experiments with transiently transfected HEK cells. We discovered that this compound does not directly activate TRPC6 channels in standard recording conditions, but acts as a positive modulator of OAG-activated TRPC6 channels (Fig. 5). That is, the mechanism of action of this compound is different from HPF and similar to compound NSN21778 (Zhang et al., 2016). The effective concentration of compound 51164 in these experiments (30 µM) was similar to the concentration of compound PPZ2 needed to activate TRPC6 channels in similar experiments (Sawamura et al., 2016). Previous reports also suggested that PPZ1 and PPZ2 activate TRPC6 channels in a diacylglycerol-dependent manner, but require activation of the BDNF signaling pathway for these effects (Sawamura et al., 2016). We further demonstrated that compound 51164 is able to restore synaptic nSOCE in hippocampal neurons exposed to Aβ42 (Fig. 6).
These effects are similar to the results we obtained previously with compound NSN21778 (Zhang et al., 2016). It has been previously shown that PPZ derivatives are able to activate Ca2+ influx not only via TRPC6 channels, but via TRPC3 and TRPC7 channels as well (Sawamura et al., 2016). This observation is relevant for drug development since TRPC3 and TRPC7 channels are expressed in various brain regions such as cerebellum, olfactory balb, and brain stem, and are predominant isoforms of TRPC channels (Zhang et al., 2016). We have not evaluated the specificity of compound 51164 for TRPC6 isoforms when compared with other TRPC isoforms.
To further evaluate the neuroprotective effects of compound 51164, we performed a series of LTP experiments with hippocampal slices from 5x FAD mice. The 5xFAD mice used in the aggressive AD mouse model are mice that display amyloid accumulation and cognitive dysfunction as early as 4 months of age (Oakley et al., 2006; Kimura and Ohno, 2009). In agreement with published reports, we observed LTP defects in hippocampal slices from 6-month-old 5xFAD mice (Fig. 7). Preincubation of slices with 100 nM of compound 51164 rescued these LTP defects (Fig. 7), suggesting that this compound may have utility for treating synaptic plasticity disruptions in AD.
In conclusion, in the current study we identified and characterized compound 51164 as a potential lead molecule for AD therapeutic development. This compound is a derivative of piperazine, a class of molecules widely used to treat psychiatric disorders (Kersten and McLaughlin, 2015). Our data suggest that compound 51164 acts as a positive modulator of TRPC6 channels, leading to stabilization of hippocampal synaptic spines in conditions of amyloid toxicity and rescue of LTP defects in hippocampal slices from the AD mouse model. Compound 51164 exerted neuroprotective effects in concentrations 10–100 nM, and it is predicted to have a favorable toxicity profile. Thus, this compound or its derivatives constitute a potential lead molecule for AD therapeutic development.
Acknowledgments
We thank Dr. P. Plotnikova for administrative support.
Abbreviations
- Aβ
β-amyloid
- aCSF
artificial cerebrospinal fluid
- AD
Alzheimer’s disease
- APP-KI
amyloid precursor protein knockin
- a.u.
arbitrary unit
- CNQX
6-cyano-7-nitroquinoxaline-2,3-dione
- compound 50741
N-(4-fluorophenyl)-2-(4-(o-tolyl)piperazin-1-yl)acetamide
- compound 51164
N-(2-chlorophenyl)-2-(4-phenylpiperazin-1-yl)acetamide
- compound 64402
1,1′-(4,6-dihydroxy-1,3-phenylene)bis(propan-1-one)
- D-AP5
D-2-amino-5-phosphonovaleric acid
- EGFP
enhanced green fluorescent protein
- fEPSP
field excitatory postsynaptic potential
- HEK
human embryonic kidney
- HPF
hyperforin
- Hyp9
1,1′-(2,4,6-trihydroxy-1,3-phenylene)bis-1-hexanone
- LTP
long-term potentiation
- MS
mushroom spines
- NSN21778
N-{4-[2-(6-amino-quinazolin-4-ylamino)-ethyl]-phenyl}-acetamide
- nSOCE
neuronal store-operated calcium entry
- OAG
1-oleoyl-2-acetyl-sn-glycerol
- Pa
probability of activity
- PASS
Prediction of Activity Spectra for Substances
- Pi
probability of inactivity
- PPZ
piperazine
- TBS
theta-burst stimulation
- TRPC
transient receptor potential canonical
- TTX
tetrodotoxin
- WT
wild type
Authorship Contributions
Participated in research design: Popugaeva, Poroikov, Zaitsev, Bezprozvanny.
Conducted experiments: Popugaeva, Chernyuk, Zhang, Postnikova, Pats.
Contributed new reagents or analytic tools: Fedorova, Poroikov.
Performed data analysis: Popugaeva, Chernyuk, Zhang, Postnikova, Poroikov.
Wrote or contributed to the writing of the manuscript: Popugaeva, Fedorova, Poroikov, Zaitsev, Bezprozvanny.
Footnotes
This work was supported by the National Institutes of Health [Grant R01NS080152] (to I.B.) (results depicted in Figure 5); the Russian Science Foundation [Grant 14-25-00024-П] (to I.B.) (results depicted in Figures 2–4); a State Grant [17.991.2017/4.6] (to I.B.) (results depicted in Figure 1 and Figure 6), in part by a grant from the Russian Foundation for Basic Research [Project No. 17-00-00408] (to A.V.Z.) (results depicted in Figure 7); the President of Russian Federation [Grant 14.Y30.17.1043-MK] (to E.P.) (results depicted in Table 1 and Table 2); and the Russian State Academies of Sciences Fundamental Research Program for 2013–2020 (to V.P.) (Integrity search and PASS Online support).
I.B. is a holder of the Carl J. and Hortense M. Thomsen Chair in Alzheimer’s Disease Research.
 This article has supplemental material available at molpharm.aspetjournals.org.
References
- Bezprozvanny I, Mattson MP. (2008) Neuronal calcium mishandling and the pathogenesis of Alzheimer’s disease. Trends Neurosci 31:454–463. [DOI] [PMC free article] [PubMed] [Google Scholar]
- Bon RS, Beech DJ. (2013) In pursuit of small molecule chemistry for calcium-permeable non-selective TRPC channels—mirage or pot of gold? Br J Pharmacol 170:459–474. [DOI] [PMC free article] [PubMed] [Google Scholar]
- Cerpa W, Hancke JL, Morazzoni P, Bombardelli E, Riva A, Marin PP, Inestrosa NC. (2010) The hyperforin derivative IDN5706 occludes spatial memory impairments and neuropathological changes in a double transgenic Alzheimer’s mouse model. Curr Alzheimer Res 7:126–133. [DOI] [PubMed] [Google Scholar]
- Cline EN, Bicca MA, Viola KL, Klein WL. (2018) The amyloid-β oligomer hypothesis: beginning of the third decade. J Alzheimers Dis 64 (Suppl 1):S567–S610. [DOI] [PMC free article] [PubMed] [Google Scholar]
- Dinamarca MC, Cerpa W, Garrido J, Hancke JL, Inestrosa NC. (2006) Hyperforin prevents β-amyloid neurotoxicity and spatial memory impairments by disaggregation of Alzheimer’s amyloid-β-deposits. Mol Psychiatry 11:1032–1048. [DOI] [PubMed] [Google Scholar]
- Estacion M, Li S, Sinkins WG, Gosling M, Bahra P, Poll C, Westwick J, Schilling WP. (2004) Activation of human TRPC6 channels by receptor stimulation. J Biol Chem 279:22047–22056. [DOI] [PubMed] [Google Scholar]
- Filimonov DA, Lagunin AA, Gloriozova TA, Rudik AV, Druzhilovskii DS, Pogodin PV, Poroikov VV. (2014) Prediction of the biological activity spectra of organic compounds using the PASS Online web resource. Chem Heterocycl Comp 50:444–457. [Google Scholar]
- Griffith TN, Varela-Nallar L, Dinamarca MC, Inestrosa NC. (2010) Neurobiological effects of hyperforin and its potential in Alzheimer’s disease therapy. Curr Med Chem 17:391–406. [DOI] [PubMed] [Google Scholar]
- Hardy J, Selkoe DJ. (2002) The amyloid hypothesis of Alzheimer’s disease: progress and problems on the road to therapeutics. Science 297:353–356. [DOI] [PubMed] [Google Scholar]
- Hardy JA, Higgins GA. (1992) Alzheimer’s disease: the amyloid cascade hypothesis. Science 256:184–185. [DOI] [PubMed] [Google Scholar]
- Inestrosa NC, Tapia-Rojas C, Griffith TN, Carvajal FJ, Benito MJ, Rivera-Dictter A, Alvarez AR, Serrano FG, Hancke JL, Burgos PV, et al. (2011) Tetrahydrohyperforin prevents cognitive deficit, Aβ deposition, tau phosphorylation and synaptotoxicity in the APPswe/PSEN1ΔE9 model of Alzheimer’s disease: a possible effect on APP processing. Transl Psychiatry 1:e20. [DOI] [PMC free article] [PubMed] [Google Scholar]
- Karran E, Hardy J. (2014) A critique of the drug discovery and phase 3 clinical programs targeting the amyloid hypothesis for Alzheimer disease. Ann Neurol 76:185–205. [DOI] [PMC free article] [PubMed] [Google Scholar]
- Kersten BP, McLaughlin ME. (2015) Toxicology and management of novel psychoactive drugs. J Pharm Pract 28:50–65. [DOI] [PubMed] [Google Scholar]
- Kimura R, Ohno M. (2009) Impairments in remote memory stabilization precede hippocampal synaptic and cognitive failures in 5XFAD Alzheimer mouse model. Neurobiol Dis 33:229–235. [DOI] [PMC free article] [PubMed] [Google Scholar]
- Leuner K, Heiser JH, Derksen S, Mladenov MI, Fehske CJ, Schubert R, Gollasch M, Schneider G, Harteneck C, Chatterjee SS, et al. (2010) Simple 2,4-diacylphloroglucinols as classic transient receptor potential-6 activators—identification of a novel pharmacophore. Mol Pharmacol 77:368–377. [DOI] [PubMed] [Google Scholar]
- Leuner K, Kazanski V, Müller M, Essin K, Henke B, Gollasch M, Harteneck C, Müller WE. (2007) Hyperforin—a key constituent of St. John’s wort specifically activates TRPC6 channels. FASEB J 21:4101–4111. [DOI] [PubMed] [Google Scholar]
- Lu R, Wang J, Tao R, Wang J, Zhu T, Guo W, Sun Y, Li H, Gao Y, Zhang W, et al. (2018) Reduced TRPC6 mRNA levels in the blood cells of patients with Alzheimer’s disease and mild cognitive impairment. Mol Psychiatry 23:767–776. [DOI] [PubMed] [Google Scholar]
- Oakley H, Cole SL, Logan S, Maus E, Shao P, Craft J, Guillozet-Bongaarts A, Ohno M, Disterhoft J, Van Eldik L, et al. (2006) Intraneuronal β-amyloid aggregates, neurodegeneration, and neuron loss in transgenic mice with five familial Alzheimer’s disease mutations: potential factors in amyloid plaque formation. J Neurosci 26:10129–10140. [DOI] [PMC free article] [PubMed] [Google Scholar]
- Popugaeva E, Pchitskaya E, Speshilova A, Alexandrov S, Zhang H, Vlasova O, Bezprozvanny I. (2015) STIM2 protects hippocampal mushroom spines from amyloid synaptotoxicity. Mol Neurodegener 10:37. [DOI] [PMC free article] [PubMed] [Google Scholar]
- Rodriguez A, Ehlenberger DB, Dickstein DL, Hof PR, Wearne SL. (2008) Automated three-dimensional detection and shape classification of dendritic spines from fluorescence microscopy images. PLoS One 3:e1997. [DOI] [PMC free article] [PubMed] [Google Scholar]
- Sawamura S, Hatano M, Takada Y, Hino K, Kawamura T, Tanikawa J, Nakagawa H, Hase H, Nakao A, Hirano M, et al. (2016) Screening of transient receptor potential canonical channel activators identifies novel neurotrophic piperazine compounds. Mol Pharmacol 89:348–363. [DOI] [PubMed] [Google Scholar]
- Selkoe DJ. (2002) Alzheimer’s disease is a synaptic failure. Science 298:789–791. [DOI] [PubMed] [Google Scholar]
- Selkoe DJ, Hardy J. (2016) The amyloid hypothesis of Alzheimer’s disease at 25 years. EMBO Mol Med 8:595–608. [DOI] [PMC free article] [PubMed] [Google Scholar]
- Sun S, Zhang H, Liu J, Popugaeva E, Xu NJ, Feske S, White CL, III, Bezprozvanny I. (2014) Reduced synaptic STIM2 expression and impaired store-operated calcium entry cause destabilization of mature spines in mutant presenilin mice. Neuron 82:79–93. [DOI] [PMC free article] [PubMed] [Google Scholar]
- Waldner C, Roose M, Ryffel GU. (2009) Red fluorescent Xenopus laevis: a new tool for grafting analysis. BMC Dev Biol 9:37. [DOI] [PMC free article] [PubMed] [Google Scholar]
- Zeng C, Tian F, Xiao B. (2016) TRPC channels: prominent candidates of underlying mechanism in neuropsychiatric diseases. Mol Neurobiol 53:631–647. [DOI] [PubMed] [Google Scholar]
- Zhang H, Sun S, Herreman A, De Strooper B, Bezprozvanny I. (2010) Role of presenilins in neuronal calcium homeostasis. J Neurosci 30:8566–8580. [DOI] [PMC free article] [PubMed] [Google Scholar]
- Zhang H, Sun S, Wu L, Pchitskaya E, Zakharova O, Fon Tacer K, Bezprozvanny I. (2016) Store-operated calcium channel complex in postsynaptic spines: a new therapeutic target for Alzheimer’s disease treatment. J Neurosci 36:11837–11850. [DOI] [PMC free article] [PubMed] [Google Scholar]
- Zhang H, Wu L, Pchitskaya E, Zakharova O, Saito T, Saido T, Bezprozvanny I. (2015) Neuronal store-operated calcium entry and mushroom spine loss in amyloid precursor protein knock-in mouse model of Alzheimer’s disease. J Neurosci 35:13275–13286. [DOI] [PMC free article] [PubMed] [Google Scholar]
- Zheng M, Liu J, Ruan Z, Tian S, Ma Y, Zhu J, Li G. (2013) Intrahippocampal injection of Aβ1-42 inhibits neurogenesis and down-regulates IFN-γ and NF-κB expression in hippocampus of adult mouse brain. Amyloid 20:13–20. [DOI] [PubMed] [Google Scholar]
- Zhou J, Du W, Zhou K, Tai Y, Yao H, Jia Y, Ding Y, Wang Y. (2008) Critical role of TRPC6 channels in the formation of excitatory synapses. Nat Neurosci 11:741–743. [DOI] [PubMed] [Google Scholar]


