

Abstract
RNAs play key roles in many cellular processes. The underlying structure of RNA is an important determinant for how transcripts function, are processed, and interact with RNA-binding proteins and ligands. RNA structure analysis by selective 2’-hydroxyl acylation analyzed by primer extension (SHAPE) takes advantage of the reactivity of small electrophilic chemical probes that react with the 2’-hydroxyl group to assess RNA structure at nucleotide resolution. When coupled with mutational profiling (MaP), in which modified nucleotides are detected as internal miscodings during reverse transcription and then read out by massively parallel sequencing, SHAPE yields quantitative per-nucleotide measurements of RNA structure. Here, we provide an Extension to our previous in vitro SHAPE-MaP protocol with detailed guidance for undertaking and analyzing SHAPE-MaP probing experiments in live cells. The MaP strategy works for both abundant-transcriptome experiments and for cellular RNAs of low to moderate abundance, which are not well examined by whole-transcriptome methods. In-cell SHAPE-MaP, performed in roughly 3 days, can be applied in cell types ranging from bacteria to cultured mammalian cells and is compatible with a variety of structure-probing reagents. We detail several strategies by which in-cell SHAPE-MaP can inform new biological hypotheses and emphasize downstream analyses that reveal sequence or structure motifs important for RNA interactions in cells.
Keywords: mutational profiling, RNA structure modeling, RNA-protein interactions, rare transcripts, 1M7, 5NIA, NAI, DMS, SHAPE, SHAPE-MaP, in-cell SHAPE-MaP
EDITORIAL SUMMARY
In this Protocol Extension, the Authors detail an in-cell version of their previous in vitro SHAPE-MaP protocol, enabling RNA structure to be probed in living cells.
TWEET: In-cell RNA structure probing with SHAPE-MaP
INTRODUCTION
RNA is a critical regulator of cellular processes, operating through diverse mechanisms to modulate gene expression in all forms of life1. RNA can act in cis or in trans and may function alone or as part of ribonucleoprotein (RNP) complexes. RNA regulates alternative splicing2, small RNA-mediated silencing3, and metabolite sensing (through riboswitches)4, is catalytic (ribozymes)5, and has diverse actions in the form of long noncoding RNA (lncRNA)6–8. With recent advances in high-throughput biology, understanding of the capacity of RNA to influence cellular activities is expanding rapidly.
The ability of RNA molecules to form complex secondary and tertiary structures underlies many of its cellular functions9–12. These RNA structures are usually difficult to accurately predict from sequence information alone, especially for long transcripts. Adding an additional layer of complexity is the fact that most, if not all, RNAs interact with cellular partners either transiently or in stable RNP complexes13. Identifying the location and nature of these RNA-protein interactions de novo is difficult. Several approaches for studying RNA structure in vitro and in living cells have been described14–22.
We previously shared an in-depth protocol for probing RNA structure in vitro using selective 2’-hydroxyl acylation analyzed by primer extension and mutational profiling (SHAPE-MaP)23. In this protocol extension, we highlight the utility of SHAPE-MaP as an approach for in-cell probing of both RNA structure and intermolecular RNA interactions with other molecules in a native context.
Utility of in-cell RNA structure probing.
In-cell SHAPE-MaP yields quantitative data describing local RNA flexibility at nucleotide resolution. In the native cellular environment, nucleotide reactivity to the chemical probe is influenced not only by RNA structure but by interactions with proteins and other molecules. In-cell experiments can reveal complex sets of interactions and are particularly useful when comparing different experimental states. For example, our lab used in-cell SHAPE to analyze the conformations of the RNA in the bacterial 30S ribosome subunit in various stages of translation, revealing distinct assembly states21 and a novel regulatory RNA conformational change19. In-cell SHAPE data can also be paired with SHAPE reactivities derived from cell-free probing, in which the RNA is gently extracted from cells and deproteinized prior to probing. By rigorously analyzing differences between in-cell and cell-free data, sites of RNA-protein interactions within ribonucleoprotein complexes can be identified with high confidence and with relatively high resolution18. In-cell SHAPE-MaP can be applied in a targeted gene-specific way. Thus SHAPE-MaP makes it possible to obtain highly quantitative per-nucleotide structure information on both abundant RNAs such as the cytoplasmic 5S ribosomal RNA and signal recognition particle RNA, the nuclear U1 snRNA18, and rare nuclear transcripts like the Xist lncRNA24.
In a SHAPE-MaP experiment, RNA molecules are treated with a hydroxyl-selective electrophile that reacts with the 2’-hydroxyl position via a mechanism that primarily reports local nucleotide flexibility25. During the MaP readout stage, 2’-O-adducts are encoded as apparent sequence changes or deletions in the cDNAs produced during reverse transcription. MaP readout is compatible with every structure-probing reagent we have tested, including 1M7, 1M7 and NMIA17,24, NAI14,26 and dimethyl sulfate (DMS)27,28. Other sequencing-based RNA structure probing experiments rely on faithfully preserving and identifying cDNA ends corresponding to adduct-induced reverse transcriptase termination or RNase cleavage sites15,26,29–33. The advantage of MaP over these approaches is that it eliminates the need to perform multiple ligation steps, which dramatically simplifies readout of the chemical probing information and appears to substantially increase the accuracy18 and sensitivity34 of information recovery. The MaP step can be performed with random primers to recover information from complex viral or cellular systems. In addition, MaP can also be performed with gene- or region-specific primers23. Use of gene-specific primers makes it possible to target transcripts of low to moderate abundance or specific regions of large RNAs, which are otherwise difficult to examine comprehensively by methods that use random priming.
Gene-specific SHAPE-MaP has enabled analysis of transcripts such as the 18-kb Xist lncRNA24, which are too rare to be comprehensively detected in whole transcriptome experiments. Xist adopts complex structures and interacts with many different proteins through diverse mechanisms, and the ability to compare the in-cell and cell-free structures of such transcripts proved highly informative. For example, we analyzed differences between cell-free and in-cell SHAPE reactivities of Xist and identified hundreds of potential RNA-protein interaction sites. By considering these sites in conjunction with SHAPE-directed secondary structure models, we identified conformational changes induced by the cellular environment as well as sequence- and structure-selective RNA-protein interactions. A key finding of Xist probing in cells was that many RNA-protein interactions are governed by the underlying RNA structure, or the lack thereof.
Comparisons with cell-free probing.
The experimental approach for in-cell SHAPE-MaP is similar to that used for in vitro experiments (Fig. 1). There are, however, unique considerations when planning an in-cell probing experiment: cells and culture media must be compatible with SHAPE probing conditions and an effective strategy for enrichment of target RNAs should be considered. These aspects are further described in the Experimental Design, below.
Figure 1.
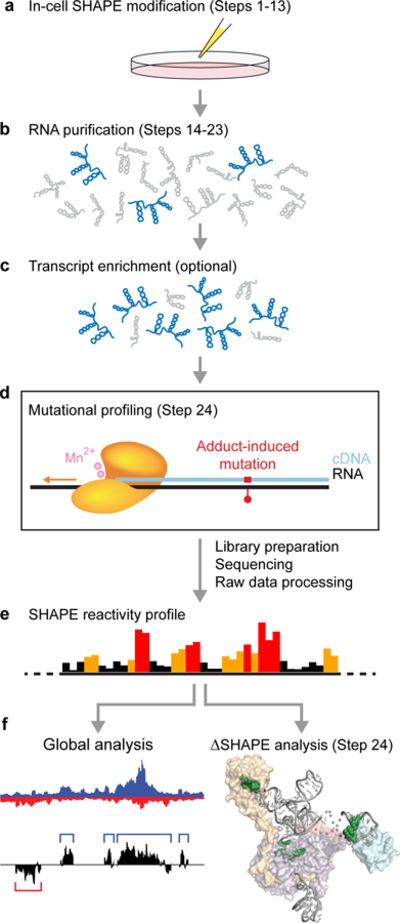
Overview of in-cell SHAPE-MaP. (a) Live cells are treated with a SHAPE reagent that reacts preferentially with flexible nucleotides. (b) Modified RNA is extracted from cells and purified. (c) Transcripts of interest are optionally enriched by one (or more) methods. (d) Mutational profiling (MaP) conditions are used to reverse-transcribe the RNA into cDNA such that SHAPE adducts are encoded as non-complementary sequences or deletions in the synthesized cDNA strand. Massively parallel sequencing libraries are then prepared from the cDNA and sequenced, followed by raw data processing with ShapeMapper17,48 to generate SHAPE reactivity profiles (e). (f) In-cell reactivity profiles are then analyzed to identify effects of the cellular environment on RNA structure.
Although experimentally similar, cell-free and in-cell SHAPE probing methods are distinct in terms of data interpretation and analysis. SHAPE fundamentally measures local nucleotide flexibility. In a cell-free experiment, in which the RNA is probed in buffer in the absence of other biomolecules, the reactivity of a given nucleotide is strongly and specifically correlated with its local structure35,36. For this reason, SHAPE reactivities can be used to develop highly accurate structural models for many RNAs37,38. In contrast, the SHAPE reactivities of nucleotides probed in living cells are dependent not only on local structure, but also on interactions with other biomolecules. Thus, in-cell probing may yield reactivities that are reduced or enhanced relative to the cell-free state. For example, nucleotides in the apical loop of an RNA hairpin may exhibit high SHAPE reactivity in the cell-free state but, in cells, may interact with RNA binding proteins in a way that decreases local SHAPE reactivity. If the in-cell data are used to guide secondary structure modeling, it is likely that the RNA structure model will be incorrect. In the case of large RNAs, local prediction errors can propagate through structure prediction calculations and cause widespread inaccuracies in the resulting model. Therefore, we caution against using SHAPE data derived from in-cell probing as the sole source of biochemical data for RNA structure modeling.
Although not ideal for secondary structure prediction, in-cell SHAPE experiments provide abundant useful data regarding the effects of the cellular environment on RNA structure. Because the cellular environment can have confounding influences on SHAPE reactivity that are not apparent in single experiments, in-cell data are usually best analyzed in a comparative manner (Fig. 2). High-value analyses include, for example, comparing in-cell and cell-free states, comparing cellular knockouts of individual RNA-binding proteins to a wild-type reference, comparing wild-type cells versus a cell line deficient in a protein of interest, comparing wild-type cells versus cells harboring an instructional mutation in the RNA of interest, or analyzing the consequences of adding a bioactive small molecule18–21,24,39–41. In-cell SHAPE probing can be used to study the effects of essentially any cellular perturbation that impacts RNA structure and dynamics relative to a reference state.
Figure 2.

Visualization and comparison of in-cell and cell-free SHAPE reactivities. (a) In-cell (blue) and cell-free (red) SHAPE reactivities for a portion of the Xist lncRNA are shown. Estimated standard errors for each nucleotide are shown as vertical bars. In-cell reactivity shows both protections and enhancements relative to the cell-free state. ΔSHAPE sites (locations of strong SHAPE reactivity change between samples) are shown in gray. This experiment was performed using approximately 1–6 million mouse embryonic stem cells per condition. (b) Windowed median reactivities, calculated over 50-nt sliding windows. (c) Superimposition of ∆SHAPE sites on secondary structure model for a region of the Xist RNA. Region shown corresponds to a portion of the FUS interaction region24. Positive ΔSHAPE sites (corresponding to protection in-cell) are shaded grey, and one negative ΔSHAPE site is boxed.
Limitations
Fundamentally, SHAPE-MaP measures local nucleotide flexibility and dynamics. Thus, any RNA conformational change or ligand binding event that affects local nucleotide dynamics will be recorded as a change in SHAPE reactivity. The major limitation becomes that, in a cellular setting, it can be difficult to distinguish between intramolecular RNA structural constraints versus intermolecular protein- or other ligand-RNA interactions as the cause of specific reactivities or reactivity changes at a given nucleotide.
SHAPE also requires that the 2’-hydroxyl probing reagent be able to enter target cells and react broadly with its constituent RNAs. We have consistently found that 1M7, NMIA and closely related reagents enter most cells and yield reproducible reactivities above background. In some cases, researchers might wish to explore other reagents. However, work from our group19,21,24 and from independent groups39,40,42 does not support the claim14,43 that 1M7 does not react with RNAs in bacterial cells and cultured mammalian cells. We would note that NAI is a useful SHAPE reagent as long as reactivity is specifically quenched (for example, using 2-mercaptoethanol) after a reasonable in-cell timeframe of 2–10 minutes. Some cell types are less permeable to SHAPE reagents, and so cell permeability should be specifically tested early in any in-cell SHAPE probing experiment.
SHAPE-MaP is generally far less sensitive to the vagaries of sequencing library construction than methods that require adapter ligation to read out structural information. Nevertheless, SHAPE relies on the ability, first, to construct sequencing libraries and, second, to align these with a reference sequence in order to detect sites of chemical adduct formation. For difficult-to-amplify sequences, such as tandem repeats or GC-rich regions, extensive optimization may be required both in library construction and computational sequence alignment. For regions with highly repetitive sequences, which are common in some lncRNAs, data readout can be severely limited by the inability to uniquely align sequencing reads, although this limitation affects all chemical probing approaches read out by massively parallel sequencing.
Applications
The ability to interrogate the structural state of RNAs in living cells has numerous applications. Broadly, in-cell SHAPE-MaP allows researchers to study the effects of biological phenomena on RNA structure. Examples include assessing the impacts of knocking-down or overexpressing an RNA binding protein, monitoring viral transcript structure over the course of an infection, or identifying structural changes associated with small molecule ligands. Regions with dense segments of differences between in-cell and cell-free states are good candidates for likely centers of functional elements in large RNAs. SHAPE-MaP allows such studies to be conducted on a broad, transcriptome-wide, scale or on a focused set of transcripts through the use of appropriate region- or gene-specific primers. Comparative experiments between distinct conditions are highly instructive and can be especially diagnostic of RNA-protein interactions and RNA assembly states.
Experimental Design
Cell choice and culture conditions.
Cells used for SHAPE-MaP experiments must tolerate brief exposure to SHAPE reagents in DMSO without exhibiting a dramatic response that significantly changes the expected cellular state. We and others have found that most bacteria, yeast, and cultured mammalian cell lines are tolerant of brief probing14,18,19,24,26,39,44. Our lab has obtained good results with the following cell types: E. coli (strain K12 and others), HeLa, Jurkat, B lymphoblasts, mouse embryonic stem cells, and mouse myoblast cells; we have found HEK293 cells to be challenging for in-cell probing. SHAPE chemistry is dependent on pH35 and performs best within a pH range of 7.4–8.3. Most mammalian cell lines have an intracellular pH compatible with SHAPE probing; however, certain cell types are often grown at lower pH (Sf9 cells, for example, are typically cultured at pH 6.2). In some cases, it may be necessary to replace the growth media with pH-adjusted media immediately prior to SHAPE probing. When planning a SHAPE-MaP experiment with a new cell line, we recommend assessing both the culture conditions and the cellular response to treatment with SHAPE reagent prior to undertaking a complete experiment.
SHAPE probing (Steps 1–13).
SHAPE experiments are inherently ensemble measurements of RNA structure. It is critical that the SHAPE reagent be rapidly and uniformly mixed with the sample to ensure homogenous probing. It is also advantageous to probe cells over a relatively short time period. This protocol will focus on experiments performed using 1M7, but has been tested and works well for all commonly used SHAPE reagents and with DMS. Cells that grow in monodisperse suspension or as an adherent monolayer are well-suited for in-cell SHAPE-MaP as the entire culture can be quickly and evenly exposed to the SHAPE reagent. When probing either liquid bacterial cultures or eukaryotic cells grown in suspension cultures, thorough mixing can be achieved by adding suspended cells in a large volume directly to a smaller volume of SHAPE reagent, ensuring rapid mixing. Adherent cells can be uniformly probed by thoroughly swirling the culture vessel immediately after addition of the SHAPE reagent. Cells that grow in large clusters or clumps (for example, embryoid bodies or bacteria in certain stationary stages of growth) are likely to exhibit an apparent lower level of modification as diffusion of the reagent through the cell mass competes with the rate of inactivating hydrolysis. In such cases, cell clusters can be trypsinized prior to SHAPE probing, and it is recommended that controls are implemented to examine whether such treatment alters the expected internal cellular state.
RNA isolation and enrichment (Steps 14–23).
Acylation of RNA by SHAPE reagents results in covalent 2’-O-adducts that are stable in most biochemical buffers. Thus, after SHAPE probing is complete, RNA can be isolated from cells using a variety of methods. Typically, high-purity isolation is accomplished by extraction with phenol:chloroform or similar commercial reagents. The MaP approach is highly sensitive to low levels of contaminating genomic DNA, and it is critical that the purified RNA is free of DNA. DNase digestion should be performed after RNA extraction.
Ribosomal RNA (rRNA) can account for more than 90% of cellular RNA; RNAs of interest thus often represent only a very small percentage of the total RNA. Therefore, it is usually critical that the RNA of interest be isolated or enriched from the cellular RNA pool. There are many strategies to accomplish this, and we outline a few here. First, a common approach is to selectively remove or degrade rRNA from the sample. Several commercial kits are available for this purpose. An alternative is to enrich for poly-adenylated transcripts using biotinylated oligo-dT probes. Use of both of these approaches may be essential for transcriptome-scale probing experiments. Another strategy is to selectively isolate the RNA of interest with biotinylated antisense oligonucleotides. The efficiency of this method depends on the size, abundance, and sequence of the transcript of interest, and enrichment probes must be designed carefully to ensure sufficient specificity. Methods for designing probes and carrying out affinity RNA purification have been described45,46 and will not be covered in detail here.
An alternative approach to physical transcript enrichment – unique to the MaP strategy – is the use of gene- or region-specific primers during the mutational profiling reverse transcription process. Because MaP experiments do not depend on preservation of cDNA ends for signal detection, an RNA of interest can be enriched by amplification from total RNA using target-specific reverse transcription primers followed by specific PCR amplification during library preparation. Thus, SHAPE-MaP experiments targeting low abundance RNAs or specific sub-regions of large transcripts can be performed without optimized enrichment protocols. Similarly, if 3’-UTRs are of particular interest, oligo-dT reverse transcription primers may be used without prior enrichment. Using these enrichment-by-amplification approaches, sequencing resources can be focused specifically on transcripts of interest. Detailed advice pertaining to targeted amplification can be found in the original protocol (see the Amplicon Workflow)23.
Library construction, sequencing, and data processing (Step 24).
After completion of RNA enrichment steps, in-cell SHAPE-MaP experiments proceed through MaP reverse transcription, library construction, sequencing, and raw data processing steps in exactly the same way as cell-free SHAPE-MaP experiments. For in-cell experiments with a very small amount of starting material, it may be advantageous to reduce the number of PCR cycles during library preparation to minimize PCR duplication events and other amplification artifacts. Alternatively, a molecular barcoding approach may be used to detect and filter duplicate sequences47. Further experimental considerations and a step-by-step guide regarding this portion of the experiment are described in detail in the original protocol23. In our experience, if total PCR cycles are kept below roughly 15, PCR artifacts do not appear to be a serious problem. Importantly, gene- and target-specific SHAPE-MaP is able to probe RNA structure at orders-of-magnitude lower cellular concentrations than random priming or whole-transcriptome methods.
The sites of chemical modification-induced mutations or sequence changes are identified using the ShapeMapper software, which has recently been updated48. ShapeMapper produces a number of useful quality control metrics in addition to SHAPE reactivity profiles. For cell-free experiments, the distribution of mutation rates in the SHAPE-modified sample should be distinctly higher than in the DMSO control. In-cell experiments generally have a lower signal-to-noise ratio than cell-free experiments and it is important to ensure that the plus-reagent experiment has a higher modification rate than the no-reagent control. Because of the high sensitivity of the MaP readout strategy17,34, small reactivity differences above background are more easily detected than with RT-truncation-and-ligation approaches and high-quality analysis of in-cell structure probing is often readily achieved (Fig. 2). For experiments comparing in-cell and cell-free samples, we recommend including a well-characterized control RNA in each condition such as the U1 snRNA, RNase MRP or 5S RNAs. These RNAs are small, abundant, and form stable RNP complexes that can be compared with published in-cell profiles18. Alternatively, a short amplicon targeting rRNA can be used to compare in-cell reactivity with published crystal structures to ensure the in-cell experiment is performing well.
Data analysis and interpretation (Step 25).
The utility of in-cell SHAPE-MaP data is greatest when used for comparative analysis between experimental conditions, and the majority of work to date has focused on identifying effects of the cellular environment relative to a cell-free extracted RNA state. However, in-cell SHAPE-MaP can be applied to any two (or more) experimental states, including following: inhibition of transcription or translation, addition of an RNA-binding small molecule, knockdown or deletion of an RNA-binding protein, or mutation of an RNA. We have created analysis strategies that identify both large- and small-scale changes in SHAPE reactivity between experiments. The results of these analyses can be interpreted both individually and collectively.
In-cell experiments can have diverse goals. When the structure and overall architecture of an RNA is poorly understood, the goal is often to identify novel areas of interest along a transcript by examining where cellular influences alter the structural profile of the RNA of interest. In many cases, especially when evaluating large RNAs, it can be useful to hone in on large-scale regions or domains of a transcript that are most different between conditions. One approach to identify these domains is to implement a global difference analysis (Fig. 3). First, the absolute change in SHAPE reactivity is calculated at each nucleotide along the transcript of interest. These values are then smoothed by calculating the 50-nucleotide sliding median (Fig. 3a). Regions that undergo the greatest change in SHAPE reactivity are thus identified by high difference values. The extent of these regions is determined in part by filtering; as a starting point, we suggest seeking out regions in which the smoothed difference values are greater than the global median for at least 100 consecutive nucleotides (Fig. 3a, purple shading). These cutoffs may be adjusted empirically.
Figure 3.
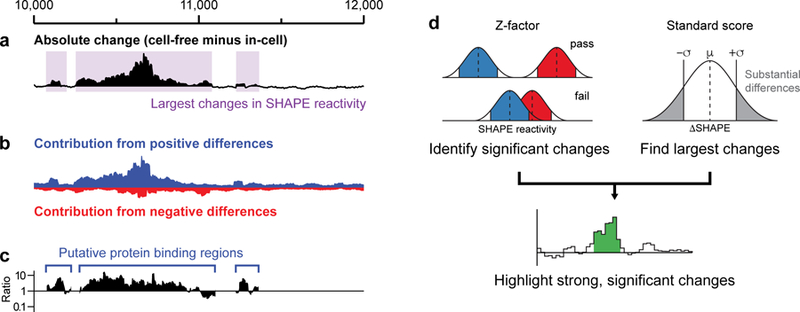
In-cell SHAPE reactivity analyses. (a) Global difference analysis for a portion of the mouse Xist lncRNA. The absolute change in SHAPE reactivity between cell-free and in-cell states is shown, smoothed over 50-nt windows. Areas where the smoothed absolute change exceeds the global median for at least 100 nucleotides are highlighted with purple shading. (b) Contributions of positive and negative differences (blue and red, respectively) to the absolute change highlight that much of the change in reactivity in this region of Xist reflects a general decrease in SHAPE reactivity in cells. (c) Ratio of positive to negative contributions calculated for regions highlighted in (a), allowing for efficient categorization of regions as exhibiting mostly positive changes, mostly negative changes, or a combination of both. (d) The statistical filters for ΔSHAPE analysis (adapted from ref. 18). A Z-factor test (left) is implemented to identify differences for which the estimated errors for each measurement (red and blue shading) do not overlap. A standard score (right) is calculated to identify nucleotides that undergo the largest absolute changes in SHAPE reactivity. Heuristically, we require that at least three nucleotides within a five-nucleotide window pass both the Z-factor and standard score filters to be highlighted as a local region of significant SHAPE reactivity change (bottom).
The large-scale impacts of the cellular environment can be further evaluated on the basis of positive or negative reactivity changes (Fig. 3b–c). For example, if in-cell reactivities are subtracted from cell-free reactivities, a region exhibiting an overall positive difference (corresponding to reduced reactivity in cells) may interact with proteins or other ligands, or may experience a local conformational change, in a way that reduces per-nucleotide reactivity with the SHAPE reagent. Similarly, we have observed that overall negative differences (corresponding to enhanced reactivity in cells) tend to indicate structural rearrangements or other cellular effects. These trends may obviously vary depending on the RNA or in-cell state of interest. Regions of large-scale SHAPE reactivity change can be further analyzed computationally and experimentally. It may be possible to identify sequence motifs present in distinct regions or, if a high-quality structural model is available, analysis of the underlying features may reveal critical structural motifs. In particular, it is often useful to focus on RNA regions with high levels of well-determined structure, as determined empirically as low SHAPE/low Shannon entropy regions (as discussed in prior work17,24 and in the main protocol23).
In addition to large-scale analyses of RNA regions, the single-nucleotide resolution of SHAPE probing can be leveraged to identify local changes in SHAPE reactivity with high confidence. The ShapeMapper data processing software automatically computes an estimated standard error for the reactivity value at each nucleotide17,48. We developed an analysis strategy, termed ΔSHAPE, which uses these error estimates to identify RNA-protein interactions with high confidence and relatively high resolution (Fig. 3d)18. This approach is based on the idea that functionally important changes in RNA structure or interactions (for example, conformational changes or protein binding) will impact SHAPE reactivity but, due to the large number of comparisons and inherent measurement errors, not all differences are meaningful. The ΔSHAPE framework considers both the raw change in SHAPE reactivity at a given nucleotide and also the magnitudes of the estimated errors in both measurements and the distribution of reactivity changes across the transcript of interest (Fig. 3d). By identifying significant differences with the largest magnitudes, and with the requirement that differences be clustered, ΔSHAPE analysis produces a list of sites approximately 3–7 nucleotides long that are likely to reflect interaction sites18. These sites can inform further analysis in numerous useful ways. For example, ΔSHAPE was used to robustly identify protein-binding sites in several RNP complexes18. Additionally, ΔSHAPE complements RNA immunoprecipitation (RIP) or crosslinking and immunoprecipitation (CLIP) strategies, and can be used to stringently filter RIP or CLIP datasets for high-confidence binding sites24.
Since ΔSHAPE requires a change in reactivity between experimental conditions, cellular interactions at sites that are strongly paired are likely difficult to detect. Additionally, the ΔSHAPE statistical thresholds were derived from studying a small set of well-understood ribonucleoprotein complexes18 and may need to be adjusted to be less stringent for less stable RNA-protein complexes. RNA-protein interactions may cause structural changes in a region of the RNA not directly involved in protein binding. Finally, other impacts of the cellular environment might induce punctate changes in SHAPE reactivity, that score highly by ∆SHAPE, that reflect events other than stable protein binding, including RNA conformational changes. Despite this complexity, we have found the ∆SHAPE approach to be a powerful tool for detecting and characterizing recognition sites for diverse RNA-binding proteins.
The ΔSHAPE analysis pipeline is available as a Python program providing both graphical and plain-text output. It is preconfigured to use the default ΔSHAPE statistical cutoffs, but allows the advanced user to adjust most parameters with command-line flags (Box 1).
Box 1. Creation of a cell-free SHAPE reference sample ● TIMING 6 h.
We describe an example procedure for gently extracting natively-folded nuclear RNA for creation of a cell-free SHAPE reference sample. These conditions are generally applicable for approximately 106 adherent mammalian cells. The procedure may need to be adjusted depending on the subcellular localization of the RNA of interest and the type of cells being probed.
In a 15-mL conical tube, pellet 106 cells in ice-cold PBS at 500 g for 5 min at 4 °C.
Resuspend the cells in 2.5 mL of lysis buffer and rotate at 4 °C for 5 min.
Pellet the cell nuclei at 2250 g for 2 min at 4 °C.
Resuspend the nuclei in 2.5 mL proteinase K buffer and rotate at 20 °C for 45 min.
Add 2.5 mL pre-equilibrated phenol:chloroform:isoamyl alcohol and mix until an emulsion forms (approximately 20–30 seconds). CRITICAL: TRIzol and similar reagents should be avoided during native purification of RNA as they contain strong chemical denaturants that will disrupt RNA structures.
Centrifuge at 12,000 g for 15 min at 4 °C, carefully collect the aqueous phase and place in a fresh 15-mL conical tube.
Repeat Steps 5–6 for a total of two extractions with phenol:chloroform:isoamyl alcohol.
Add 2.5 mL chloroform to the aqueous phase and mix 20–30 seconds until an emulsion forms.
Centrifuge as in Step 6, carefully collect the aqueous phase and place in a fresh 15-mL conical tube.
Repeat Steps 8–9 for a total of two extractions with chloroform.
Exchange the RNA into 1.1´ folding buffer using a PD-10 column according to the manufacturer’s instructions.
Incubate the buffer-exchanged RNA at 37 °C for 20–30 minutes to allow RNA structures to equilibrate.
Prepare two fresh 15-mL conical tubes. Label one “+” and the other “–”. Calculate one-eighteenth of the RNA volume and add this volume of 100 mM 1M7 to the “+” tube or neat DMSO to the “–” tube.
To each tube from Step 13, add half of the equilibrated RNA from Step 12. Quickly cap the tubes, and mix thoroughly by inversion, and incubate at 37 °C for 5 min.
Add an equivalent volume of 100% isopropanol to each tube. Mix well and incubate at - 20 °C for at least 30 minutes.
Centrifuge at 12,000 g for 15 min at 4 °C. Remove the supernatant. A small RNA pellet should be visible on the side of the tube.
-
Wash the pellet with 75% ethanol, then centrifuge at 12,000 g for 5 min at 4 °C.
PAUSE POINT: The RNA pellet can be stored in ethanol for up to a year at −20 °C. Dry the pellets in air or under vacuum, then resuspend the RNA in 88 µl RNase-free water.
MATERIALS
CRITICAL:
A complete list of reagents is given below for the in-cell and cell-free SHAPE-MaP probing and for the purification steps outlined in this protocol extension. For additional reagents required for library preparation and sequencing, please refer to the original protocol23.
REAGENTS
Total cellular RNA at a concentration between 250–500 ng/µl in sterile water. CRITICAL: Total cellular RNA should be purified from the same cell line used for SHAPE probing and should be DNase-treated to prevent genomic DNA contamination and carryover.
Cells (for example, HeLa cells; ATCC CCL-2) CAUTION: The cell lines used in your research should be regularly checked to ensure they are authentic and are not infected with mycoplasma.
Cell culture medium CRITICAL: Culture media vary by cell type. Ensure that the medium being used is optimal for SHAPE chemistry (pH 7.4–8.3).
SHAPE reagent of choice. This protocol extension will focus on examples using 1-methyl-7-nitroisatoic anhydride (1M7; synthesis is described in refs. 49–51) CRITICAL, Other reagents including NMIA, 1M6 and 5NIA (5-nitroisatoic anhydride) can also be used. NAI14 can also be used but, NAI requires a specific quench step (such as with 2-mercaptoethanol) to achieve accurate RNA structure probing in the optimal 2–10 minute reaction timeframe. CRITICAL: SHAPE reagents should be stored in a desiccator at 4 °C. When properly stored, reagents are stable for at least a year. Probing by DMS can also analyzed with this protocol.
HEPES (Fisher BioReagents, cat. no. BP310–500)
Tris (Fisher BioReagents, cat. no. BP152)
Sodium chloride (NaCl, Fisher BioReagents, cat. no. BP358)
Magnesium chloride (MgCl2, 1 M; ThermoFisher, cat. no. AM9670G)
Calcium chloride (CaCl2, 2 M; Fisher BioReagents, cat. no. BP9742)
Sucrose (Fisher BioReagents, cat. no. BP220)
Triton X-100 (Sigma-Aldrich, cat. no. T8787)
RNase inhibitor (Promega, cat. no. N2115)
DNase I (Roche, cat. no. 04536282001)
Proteinase K (20 mg/mL, ThermoFisher, cat. no. AM2546)
EDTA, pH 8.0 (0.5 M, ThermoFisher, cat. no. AM9260G)
Phosphate buffered saline, pH 7.4 (PBS; ThermoFisher, cat. no. 10010023)
DMSO, anhydrous (Sigma-Aldrich, cat. no. 276855) CAUTION: DMSO readily passes through skin and latex gloves, and it can facilitate bodily absorption of dissolved substances. Avoid direct contact.
Phenol:cholorform:isoamyl alcohol (25:24:1, ThermoFisher, cat. no. AM9730)
TRIzol reagent (ThermoFisher, cat. no. 15596018)
Chloroform (Fisher BioReagents, cat. no. BP1145–1)
Formamide, highly deionized (ThermoFisher, cat. no. 4311320)
Absolute ethanol (Fisher BioReagents, cat. no. BP2818–500)
Turbo DNase Reaction Buffer (10×, ThermoFisher, cat. no. AM2238)
Turbo DNase (2 U/µl, ThermoFisher, cat. no. AM2238)
RNeasy Mini Kit (Qiagen, cat. no. 74104)
PD-10 desalting columns (GE Healthcare, cat. no. 17085101)
RNeasy mini kit (Qiagen, cat. no. 74104)
REAGENT SETUP
10× denaturing control buffer 500 mM HEPES (pH 8.0) and 40 mM EDTA. CRITICAL: This buffer must be kept free of contamination by divalent ions such as Mg2+ that will rapidly degrade RNA upon heating. This solution is stable at room temperature (20–25 °C) for at least 6 months.
Lysis buffer 40 mM Tris (pH 7.9), 25 mM NaCl, 6 mM MgCl2, 1 mM CaCl2, 256 mM sucrose, 0.5% Triton X-100, 1000 units/mL RNase inhibitor, and 450 units/mL DNase I. This solution should be stored at 4 °C and is stable for up to 6 months. For best results, add RNase inhibitor and DNase I immediately prior to use.
Protease K buffer 40 mM Tris (pH 7.9), 200 mM NaCl, 1.5% SDS, and 500 µg/mL Proteinase K. This solution should be stored at 4 °C and is stable for up to 6 months. For best results, proteinase K should be added immediately prior to use.
Pre-equilibrated phenol:chloroform:isoamyl alcohol Combine equal volumes of 1.1× folding buffer and phenol:chloroform:isoamyl alcohol in a glass bottle. Mix vigorously and allow the aqueous and organic phases to separate. Carefully aspirate the aqueous phase and store the equilibrated solvent mixture at 4 °C for up to 6 months. CAUTION: Phenol can cause severe burns. Always work with phenol in a fume hood and wear safety glasses, gloves, and a lab coat. Avoid direct contact.
1.1× folding buffer 110 mM HEPES (pH 8.0), 110 mM NaCl, and 4.4 mM MgCl2. This buffer can be stored at room temperature for at least 6 months. CRITICAL: The composition of this buffer—particularly the magnesium ion concentration—can be tailored to suit the specific needs of the system under study, but care should be taken to ensure that native RNA structures are preserved during cell-free extraction.
EQUIPMENT
3.5-cm Culture dishes
Cell culture incubator
15-mL conical tubes
1.7-mL Microcentrifuge tubes
0.65-mL Reaction tubes
Refrigerated microcentrifuge
UV spectrophotometer
Tube rotator
Computational requirements
ShapeMapper and SuperFold, both available from http://www.chem.unc.edu/rna/software.html. Extensive documentation, installation instructions, and instructions for accessing sample data are described in the original protocol23. An updated and significantly more user friendly version of ShapeMapper is now available48. These programs run from a command-line terminal (32- or 64-bit computer running Linux or OS X (10.6 or greater); 4 GB RAM).
Optional computational resources (optional, used for running deltaSHAPE.py)
deltaSHAPE.py, available from http://www.chem.unc.edu/rna/software.html. This small program will easily run on the same computer hardware used to run ShapeMapper.
Python 2.7, available at python.org/download/releases/2.7
Python module numpy, version 1.4 or greater, available at http://www.numpy.org
Python module scipy, available at http://www.scipy.org (deltaSHAPE.py validated with version 0.14 or greater).
Python module matplotlib, available at http://www.matplotlib.org (deltaSHAPE.py validated with version 1.5).
PROCEDURE
In-cell RNA modification ● TIMING 30 min
CRITICAL:
We describe in-cell modification conditions that are generally applicable for adherent mammalian cells in culture. The protocol may need to be adjusted depending on the type of cells being probed.
-
1
Culture cells in two 3.5-cm culture dishes (or two wells of a six-well plate) to approximately 80% confluency. Label each dish “+” or “–”.
-
2
Aspirate the media from each dish and gently wash the cells with 1 ml sterile PBS per dish.
-
3
Aspirate the PBS from each dish and add 900 µl of fresh pre-warmed medium.
-
4
Add 100 µl 100 mM 1M7 to the “+” dish while gently and promptly swirling to ensure rapid and thorough mixing.
CRITICAL STEP: It is important that the cell culture is rapidly and uniformly exposed to the SHAPE reagent. Continue to swirl or rock the dish back and forth until the culture medium appears homogenous. If performing multiple probing experiments in parallel, thoroughly mix the SHAPE reagent in one dish before moving on to the next reaction.
-
5
Working quickly, add 100 µl neat DMSO to the “–” dish while gently swirling to ensure thorough mixing.
-
6
Place the “+” and “–” dishes in an incubator at 37 °C for at least five 1M7 hydrolysis half-lives (~75 s at 37 °C).
-
7
For each dish, aspirate the media and add 1 ml TRIzol reagent. Pipette up and down to thoroughly lyse the cells.
CAUTION: TRIzol contains phenol, which can cause severe burns. Always work with TRIzol in a fume hood and wear safety glasses, gloves, and a lab coat. Avoid direct contact.
-
8
Pipette the lysates into separate clean 1.5-ml microcentrifuge tubes and set aside at room temperature while performing the denaturing control reaction (Steps 9–13).
-
9
Place 3 µl previously prepared total cellular RNA, 5 µl 100% formamide, and 1 µl 10× DC buffer into a 0.65-ml reaction tube. Mix well by pipetting up and down.
-
10
Incubate the mixture at 95 °C for 1 min to denature the RNA.
-
11
Place 1 µl 100 mM 1M7 in a clean 0.65-ml reaction tube.
CRITICAL STEP: Do not pre-incubate the SHAPE reagent at 95 °C. At elevated temperatures, the competing hydrolysis reaction proceeds quickly; moisture in the tube can reduce the effective concentration of SHAPE reagent.
-
12
Add 9 µl of denatured RNA from Step 10 to the denaturing control (DC) reaction tube from Step 11, mix well, and incubate at 95 °C for 1 minute.
-
13
Place the DC reaction tube on ice while purifying the “+” and “–” samples.
RNA purification ● TIMING 1.5 h
-
14
Add 200 µl chloroform to each “+” and “–” tube from Step 8, cap tightly and shake vigorously for 15–30 s.
-
15
Incubate 2 min at room temperature, then centrifuge the tubes 12,000 g for 15 min at 4 °C.
-
16
Remove the upper aqueous phase from each tube and place in a clean 1.7-ml microcentrifuge tube, being careful not to disturb the interphase.
-
17
For each sample, add 500 µl 100% isopropanol to the aqueous phase. Mix well and incubate at −20 °C for 20–30 min.
-
18
Centrifuge at 12,000 g for 15 min at 4 °C. Remove the supernatant. A small RNA pellet should be visible on the side of the tube.
-
19
Wash the pellet with 75% ethanol, then centrifuge at 12,000 g for 5 min at 4 °C. PAUSE POINT: The RNA pellet can be stored in ethanol for up to a year at −20 °C.
-
20
Dry the pellet in air or under vacuum, then resuspend the RNA in 88 µl RNase-free water.
DNase treatment ● TIMING 1 h
-
21For each sample, using both cell-free modified RNA from Box 1 and in-cell modified RNA from Step 20, assemble the DNase reaction as follows:
Component Amount (µl) Final concentration Modified RNA 88 Turbo DNase buffer (10×) 10 1× Turbo DNase (2 U/µl) 2 0.04 U/µl -
22
Incubate the DNase reactions at 37 °C for 30 minutes.
-
23
Purify RNA from the DNase reactions and from the DC reaction using individual RNeasy Mini spin columns for each sample, according to the manufacturer’s instructions.
Library preparation, sequencing, and raw data processing ● TIMING 2–9 d, depending on the sequencing platform
-
24
Details for preparing, sequencing, and processing SHAPE-MaP libraries are described in Steps 16–38 in the original protocol23.
ΔSHAPE analysis (optional) ● TIMING 1 h
-
25To calculate regions of significant difference between experiments using ΔSHAPE, use two .map files generated by ShapeMapper48 (see the original protocol for a description of file formats) with the deltaSHAPE.py script by typing the following command. Note that the per-nucleotide reactivity values in file2.map will be subtracted from those in file1.map.
python deltaSHAPE.py file1.map file2.map
Expected outcome: Using default parameters, a plot of calculated ΔSHAPE values will be displayed. Regions of significant SHAPE reactivity increases and decreases will be colored purple and green, respectively. Additionally, a text file, ‘differences.txt’ will be created that contains the ΔSHAPE values and additional statistical information about the highlighted nucleotides. The output and analysis parameters of the software can easily be adjusted by providing additional command-line flags; see Box 2 for a complete description of available flags.
Box 2. Parameters for automated ΔSHAPE analysis with deltaSHAPE.py.
The default parameters are for ΔSHAPE analysis are set such that SHAPE reactivities must differ by at least 1.96 standard deviations and that ΔSHAPE values are at least one standard deviation away from the mean ΔSHAPE value; at least three nucleotides meeting these criteria are required to occur in a five-nucleotide window in order to be highlighted by the program. To run deltaSHAPE.py with these default parameters, enter the following command:
python deltaSHAPE.py file1.map file2.map
where ‘file1.map’ and ‘file2.map’ are the names of .map files corresponding to each experiment being compared. deltaSHAPE.py automatically generates a file named ‘differences.txt’, which is a tab-delimited file providing the position, sequence, and statistical data for nucleotides identified as showing significant changes between experiments. The behavior of deltaSHAPE.py can be changed using the following flags:
| --help | Displays available flags with descriptions. |
| --out [.txt file] | Name and location of output file. Default: ./differences.txt |
| --mask5 [int] | Specify the number of nucleotides at the 5’ end to ignore. Default: 0 |
| --mask3 [int] | Specify the number of nucleotides at the 3’ end to ignore. Default: 0 |
| --pad [int] | Indicate the smoothing window size. Window = 2*pad+1. To turn off smoothing, set PAD = 0. Default: 1 |
| --Zcoeff [float] | Adjust the Z-factor stringency by changing the equation coefficient. Default: 1.96 |
| --Zthresh [float] | Adjust the Z-factor stringency by changing the cutoff threshold. Default: 0.0 |
| --SSthresh [float] | Set the cutoff threshold for standard score filtering. Default: 1.0 |
| --FindSite [int,int] | Comma-separated pair of numbers indicating the window pad size and number of required hits when finding binding sites. Default settings look for 3+ nucleotides within a 5-nucleotide window. Default: 2,3 |
| --magrank | Sort output file by decreasing deltaSHAPE magnitude instead of nucleotide position. Default: OFF |
| --all | Output data for all nucleotides. Insignificant changes are listed as zero. Default: OFF |
| Save plot as PDF. If output file is given, PDF will have same prefix. Default: OFF | |
| --noshow | Generate the plot but do not display automatically. Often used with --pdf or when running many comparisons in series. Default: display plot |
| --noplot | Skip plotting completely. Default: OFF |
| --dots | Plot markers indicating nucleotides that pass Z-factor and standard score filtering. This can get unwieldy for large RNAs (>1000 nt). Standard score (open) dots are plotted above Z-factor (filled) dots. Default: OFF |
| --Zdots | Plot markers indicating only nucleotides that pass Z-factor filtering. Default: OFF |
| --SSdots | Plot markers indicating only nucleotides that pass standard score filtering. Default: OFF |
| --colorfill | Highlight ΔSHAPE sites with coloration beneath the plot line. |
| --ymin [float] | Set plot y-axis minimum. Default: Determined automatically |
| --ymax [float] | Set plot y-axis maximum. Default: Determined automatically |
| --xmin [float] | Set plot x-axis minimum. Default: Determined automatically |
| --xmax [float] | Set plot x-axis maximum. Default: Determined automatically |
CRITICAL:
When analyzing datasets that include nucleotides masked by primer-binding sites at the 5’ or 3’ ends, it is important to specify the lengths of these masked regions using the --mask5 and/or --mask3 flags. Failure to do so will artificially skew the statistical calculations used by the ΔSHAPE analysis.
TROUBLESHOOTING
The approaches for troubleshooting an in-cell SHAPE-MaP experiment are nearly identical to those for a conventional cell-free experiment. For troubleshooting advice pertaining to in-cell SHAPE modification, refer to Table 1. For troubleshooting advice pertaining to mutational profiling, library generation, and raw data processing, refer to the original protocol23.
Table 1.
In-cell SHAPE-MaP troubleshooting
| Step | Problem | Possible cause | Solution |
|---|---|---|---|
| 4 | Low SHAPE reactivity values throughout the transcript(s) of interest. | Clumped cells may be preventing the SHAPE reagent from uniformly probing cells. | Ensure that the cells are monodisperse if grown in suspension, or that adherent cells are grown in a monolayer without clumping. Optionally, trypsinize cells prior to probing. |
| 4 | Low SHAPE reactivity values throughout the transcript(s) of interest. | pH of the growth medium may be outside the optimal range for SHAPE probing. | Ensure that the pH is within a range of 7.4– 8.3. If necessary and possible, replace growth media with PBS at a suitable pH immediately prior to SHAPE probing. |
| 4 | Low SHAPE reactivity values throughout the transcript(s) of interest. | SHAPE reagent may not be permeating through the cellular membrane. | Perform a control experiment using cells known to be compatible with in- cell SHAPE-MaP such as mouse embryonic stem cells or Jurkat cells. Alternatively, select a different SHAPE reagent. |
TIMING
Steps 1–13, In-cell RNA modification: 30 min
Steps 14–20, RNA purification: 1.5 h
Steps 21–23, DNase treatment: 1 h
Step 24, Library preparation, sequencing, and data processing: 2–9 d, depending on the sequencing platform
Step 25, ΔSHAPE analysis: 1 hr
ANTICIPATED RESULTS
In-cell SHAPE-MaP enables measurement of RNA flexibility at single-nucleotide resolution in living cells, and can be adapted for use with RNAs of varying abundance and length. When paired with cell-free structure probing data, in-cell SHAPE reactivities can be used to highlight possible areas of cellular interaction on both local per-nucleotide and global scales (Fig. 2 and 3). These data are also suitable for ΔSHAPE analysis, which identifies significant local differences between datasets and can be used to identify RNA-protein interaction sites with high resolution. The examples provided here highlight instructive applications of in-cell SHAPE-MaP when compared with cell-free data using the 1M7 SHAPE reagent, but essentially any informative set of experimental conditions and nearly any RNA-modifying reagent can be considered.
As an example of DSHAPE analysis, cell-free and in-cell SHAPE-MaP profiles were generated for the mouse U1 snRNA18. This RNA interacts with several proteins (U1A, U1C, U1–70K, and the heteroheptameric Sm ring) to form the U1 snRNP complex. Qualitative analysis of the two SHAPE profiles indicates many differences – possibly indicative of protein interactions – throughout the RNA (Fig. 4a). However, when these data are analyzed using the ΔSHAPE framework, only some of the observed qualitative differences are significant (Fig. 4b, in green). These ΔSHAPE sites correspond well to RNA-protein interactions when superimposed on a crystallographic model of the U1 snRNP complex (Fig. 4c). These include nucleotides 30–33, which are deeply buried in the U1–70K binding pocket; nucleotides 73–75, which interact with the U1A protein; and nucleotides 124–129, which are single-stranded and sequestered by the Sm ring complex.
Figure 4.

ΔSHAPE analysis for a small RNP complex (adapted from ref. 18). (a) In-cell and cell-free SHAPE reactivities are shown for the mouse U1 snRNA. Error bars represent the estimated standard error, calculated by ShapeMapper. (b) ΔSHAPE reactivity profile for the U1 snRNA. Regions of the RNA exhibiting significant changes between in-cell and cell-free datasets are highlighted in green. Other regions exhibiting large but statistically insignificant changes are colored in grey. (c) Crystallographic model of the U1 snRNP complex55 highlighting the locations of ΔSHAPE sites (green spheres) and their proximities to known RNA-protein interactions.
In-cell SHAPE-MaP can also be applied to large, rare transcripts. The previously described amplicon workflow uses gene-specific primers to amplify and detect chemical adducts in a specific region of interest (see Fig. 4 in ref. 23). In one example, the SHAPE-MaP amplicon strategy makes it possible to generate very high quality in-cell and cell-free SHAPE-MaP profiles over the entire 18-kb mouse Xist lncRNA, even in the background of total transcriptome RNA. In conjunction with secondary structure modeling, a global difference analysis of cell-free and in-cell SHAPE reactivities revealed locations throughout the transcript that exhibit strong regional changes (Fig. 5a)24. These large-scale changes were broken down into contributions reflecting positive and negative differences (Fig. 5b) to identify regions that likely transition between structured and unstructured states as a result of cellular interactions (Fig. 5c). This global analysis of Xist highlighted a repetitive sequence element in the middle of the transcript (repeat E) that undergoes a dramatic change from being highly unstructured in the cell-free state to being highly constrained in cells, likely due, at least in part, to extensive binding by proteins.
Figure 5.

Large-scale difference analyses applied to the ~18kb Xist lncRNA (adapted from ref. 24). (a) Absolute difference in SHAPE reactivity between in-cell and cell-free experiments, smoothed over a 50-nt sliding window. Regions exhibiting a smoothed reactivity difference greater than the global median for at least 100 nucleotides are highlighted purple. (b) The contributions of positive (blue) and negative (red) differences to the absolute difference highlight regions where Xist is more or less reactive in the cellular environment than in the cell-free state, respectively. (c) The ratio of positive to negative differences is plotted for regions identified as undergoing large-scale reactivity changes in (a). By examining the ratios, regions can be sorted by whether they exhibit mostly positive or mostly negative changes, suggestive of protein binding and RNA structural rearrangement, respectively. (d) The location of positive (blue) and negative (red) ΔSHAPE sites across the Xist lncRNA. In this example, ΔSHAPE sites are non-uniformly distributed and tend to overlap with regions of large-scale change identified in (a). (e) Sequence motifs enriched in +ΔSHAPE sites. These U-rich sequences were identified by searching for motifs in the 20 nucleotides surrounding the center of +ΔSHAPE sites (corresponding to protection in cells) and generally map to an unstructured region spanning nucleotides 10,000–11,000.
ΔSHAPE analysis can also be applied to large transcripts such as Xist. When in-cell and cell-free probing datasets were compared, approximately 200 DSHAPE sites were identified across the Xist RNA (Fig. 5d)24. When many sites are identified within a large transcript, it is often helpful to apply additional downstream analyses to further explore the nature of these sites. For example, DSHAPE sites at which the in-cell reactivity is reduced relative to the cell-free state are good candidates for possible RNA-protein interaction sites18. These sites showing protection in cells can be searched for shared sequence motifs. In the Xist lncRNA, we identified strong signals corresponding to two U-rich motifs likely bound by proteins in the repeat E unstructured repetitive sequence element (Fig. 5e). Identification of these sites was made possible by focusing specifically on sequence motifs shared among in-cell protected regions24.
Second, ΔSHAPE sites can be used to support or identify interactions with specific proteins, based on overlap with protein binding sites identified by CLIP-seq experiments. CLIP sites mapped on the Xist RNA typically span much of the RNA, and we found that it was generally not possible to identify any sequence or structure consensus interaction site for a given protein (Fig. 6a, open symbols). We reasoned that specific protein binding should impact the RNA sufficiently to perturb the local SHAPE reactivity, as measured by a ∆SHAPE signal. Indeed, when CLIP-seq sites for different proteins were filtered by ∆SHAPE sites, the smaller set of ∆SHAPE-supported sites revealed sequence- and structure-recognition features that were otherwise obscured by the likely low resolution and low stringency of typical CLIP-seq sites (Fig. 6a, closed symbols; Fig. 6b). In the case of two proteins, CELF1 and PTBP1, CLIP sites overlapping DSHAPE sites were enriched for a sequence motif that could not be identified when searching over all reported CLIP sites (Fig. 6b).
Figure 6.

Examples of downstream analyses of mouse Xist DSHAPE sites (adapted from ref. 24). (a) Locations of reported RNA-binding protein CLIP sites supported by ΔSHAPE are emphasized with filled circles; sites identified by CLIP only are shown with open symbols. CELF1 and PTBP1 sites generally occur near the repeat E region; FUS sites are situated in a low SHAPE/low entropy region spanning nucleotides 13,500–15,00024. Although multiple TARDBP CLIP sites have been reported, only one is supported by ΔSHAPE. (b) Motif analysis of the CELF1 and PTBP1 ΔSHAPE-supported CLIP sites reveals similar sequence motifs, suggesting that these RNA-binding proteins recognize similar sequence elements in Xist. These motifs could not be identified when searching over all reported CLIP sites for these proteins. (c) Structural preferences of DSHAPE-supported FUS CLIP sites. The predicted pairing probabilities were calculated for the 20-nt window centered on ΔSHAPE sites overlapping FUS CLIP sites, revealing a preference for single-stranded binding sites flanked by base pairs. (d) Structure model of the TARDBP-Xist interaction site. Positive (blue) and negative (red) ΔSHAPE sites, and the reported CLIP site (grey) are shown.
We also examined the interactions of Xist with the FUS protein, which binds many RNAs and is generally considered to be a promiscuous binder52. We evaluated the cell-free derived structure model of Xist at ΔSHAPE sites overlapping FUS CLIP sites and identified a conserved structural motif: the ΔSHAPE-supported FUS sites tend to be single-stranded but flanked by base pairs (Fig. 6c). SHAPE-supported FUS sites also were overrepresented in a specific region with high levels of well-determined RNA secondary structure, using the low SHAPE/low entropy metric outlined in the original protocol23,24. In-cell SHAPE experiments thus revealed an underlying structural code for RNA-protein interactions and suggested that a well-determined and highly structured element in a large RNA might constitute a recognition domain for binding by multiple FUS proteins.
Finally, we examined the interactions between Xist and TARDBP, a splicing regulator with a reported preference for UG-rich sequences53,54. Based on two fully independent biological replicates, only a single TARDBP CLIP site was supported by ΔSHAPE. This site overlapped a UG-rich structural motif at a splice junction (Fig. 6e), suggesting that TARDBP recognizes a specific sequence and structure context to regulate Xist splicing. These examples of downstream ΔSHAPE analysis highlight how a comparison of two or more experimental states can lead to insightful hypotheses about RNA structure-function relationships.
In conclusion, in-cell SHAPE-MaP enables RNA structure to be examined at single-nucleotide resolution in a native cellular environment, including for RNAs of low to moderate abundance. In-cell SHAPE is simple to perform and amenable to many cell types, media, and growth conditions. Global difference analysis and the ΔSHAPE framework are proven approaches for examining how the cellular environment impacts RNA structure relative to a reference state and can complement other biochemical assays. We anticipate that in-cell SHAPE-MaP will be a broadly useful technology for understanding the role of RNA structure-function interrelationships in regulating cellular biology.
ACKNOWLEDGEMENTS
Work in our lab focused on developing quantitative and biophysically rigorous RNA structure probing technologies is supported by the NIH (R35 GM122532 and R01 AI068462). M.J.S. was a Graduate Research Fellow of the National Science Foundation (DGE-1144081) and was supported in part by an NIH training grant in molecular and cellular biophysics (T32 GM08570). We are indebted to the Calabrese laboratory for assistance in developing in-cell probing strategies and to members of the Weeks laboratory for thoughtful feedback regarding the analysis algorithms and strategies described here.
Footnotes
COMPETING FINANCIAL INTERESTS
The authors declare competing financial interests (see the HTML version of this article for details).
REFERENCES
- 1.Sharp PA The Centrality of RNA. Cell 136, 577–580 (2009). [DOI] [PubMed] [Google Scholar]
- 2.Wang Z & Burge CB Splicing regulation: from a parts list of regulatory elements to an integrated splicing code. RNA 14, 802–813 (2008). [DOI] [PMC free article] [PubMed] [Google Scholar]
- 3.Ghildiyal M & Zamore PD Small silencing RNAs: an expanding universe. Nat. Rev. Genet 10, 94–108 (2009). [DOI] [PMC free article] [PubMed] [Google Scholar]
- 4.Sherwood AV & Henkin TM Riboswitch-Mediated Gene Regulation: Novel RNA Architectures Dictate Gene Expression Responses. Annu. Rev. Microbiol 70, 361–374 (2016). [DOI] [PubMed] [Google Scholar]
- 5.Lau MWL & Ferré-D’Amaré AR Many Activities, One Structure: Functional Plasticity of Ribozyme Folds. Molecules 21, 1570 (2016). [DOI] [PMC free article] [PubMed] [Google Scholar]
- 6.Rinn JL & Chang HY Genome Regulation by Long Noncoding RNAs. Annu. Rev. Biochem 81, 145–166 (2012). [DOI] [PMC free article] [PubMed] [Google Scholar]
- 7.Engreitz JM, Ollikainen N & Guttman M Long non-coding RNAs: spatial amplifiers that control nuclear structure and gene expression. Nat. Rev. Mol. Cell Biol 17, 756–770 (2016). [DOI] [PubMed] [Google Scholar]
- 8.Cech TR & Steitz JA The noncoding RNA revolution-trashing old rules to forge new ones. Cell 157, 77–94 (2014). [DOI] [PubMed] [Google Scholar]
- 9.Mortimer SA, Kidwell MA & Doudna JA Insights into RNA structure and function from genome-wide studies. Nat. Rev. Genet 15, 469–479 (2014). [DOI] [PubMed] [Google Scholar]
- 10.Butcher SE & Pyle AM The molecular interactions that stabilize RNA tertiary structure: RNA motifs, patterns, and networks. Acc. Chem. Res 44, 1302–1311 (2011). [DOI] [PubMed] [Google Scholar]
- 11.Nicholson BL & White KA Exploring the architecture of viral RNA genomes. Curr Opin Virol 12, 66–74 (2015). [DOI] [PubMed] [Google Scholar]
- 12.Gebhard LG, Filomatori CV & Gamarnik AV Functional RNA elements in the dengue virus genome. Viruses 3, 1739–1756 (2011). [DOI] [PMC free article] [PubMed] [Google Scholar]
- 13.Licatalosi DD & Darnell RB RNA processing and its regulation: global insights into biological networks. Nat. Rev. Genet 11, 75–87 (2010). [DOI] [PMC free article] [PubMed] [Google Scholar]
- 14.Spitale RC et al. RNA SHAPE analysis in living cells. Nat. Chem. Biol 9, 18–20 (2012). [DOI] [PMC free article] [PubMed] [Google Scholar]
- 15.Talkish J, May G, Lin Y, Woolford JL & McManus CJ Mod-seq: high-throughput sequencing for chemical probing of RNA structure. RNA 20, 713–720 (2014). [DOI] [PMC free article] [PubMed] [Google Scholar]
- 16.Loughrey D, Watters KE, Settle AH & Lucks JB SHAPE-Seq 2.0: systematic optimization and extension of high-throughput chemical probing of RNA secondary structure with next generation sequencing. Nucleic Acids Res 42, e165–e165 (2014). [DOI] [PMC free article] [PubMed] [Google Scholar]
- 17.Siegfried NA, Busan S, Rice GM, Nelson JAE & Weeks KM RNA motif discovery by SHAPE and mutational profiling (SHAPE-MaP). Nat. Methods 11, 959–965 (2014). [DOI] [PMC free article] [PubMed] [Google Scholar]
- 18.Smola MJ, Calabrese JM & Weeks KM Detection of RNA-Protein Interactions in Living Cells with SHAPE. Biochemistry 54, 6867–6875 (2015). [DOI] [PMC free article] [PubMed] [Google Scholar]
- 19.McGinnis JL et al. In-cell SHAPE reveals that free 30S ribosome subunits are in the inactive state. Proc. Natl. Acad. Sci. U.S.A 112, 2425–2430 (2015). [DOI] [PMC free article] [PubMed] [Google Scholar]
- 20.Tyrrell J, McGinnis JL, Weeks KM & Pielak GJ The cellular environment stabilizes adenine riboswitch RNA structure. Biochemistry 52, 8777–8785 (2013). [DOI] [PMC free article] [PubMed] [Google Scholar]
- 21.McGinnis JL & Weeks KM Ribosome RNA assembly intermediates visualized in living cells. Biochemistry 53, 3237–3247 (2014). [DOI] [PMC free article] [PubMed] [Google Scholar]
- 22.Fang R, Moss WN, Rutenberg-Schoenberg M & Simon MD Probing Xist RNA Structure in Cells Using Targeted Structure-Seq. PLoS Genet 11, e1005668 (2015). [DOI] [PMC free article] [PubMed] [Google Scholar]
- 23.Smola MJ, Rice GM, Busan S, Siegfried NA & Weeks KM Selective 2’- hydroxyl acylation analyzed by primer extension and mutational profiling (SHAPE-MaP) for direct, versatile and accurate RNA structure analysis. Nat. Protoc 10, 1643–1669 (2015). [DOI] [PMC free article] [PubMed] [Google Scholar]
- 24.Smola MJ et al. SHAPE reveals transcript-wide interactions, complex structural domains, and protein interactions across the Xist lncRNA in living cells. Proc. Natl. Acad. Sci. U.S.A 113, 10322–10327 (2016). [DOI] [PMC free article] [PubMed] [Google Scholar]
- 25.Weeks KM & Mauger DM Exploring RNA structural codes with SHAPE chemistry. Acc. Chem. Res 44, 1280–1291 (2011). [DOI] [PMC free article] [PubMed] [Google Scholar]
- 26.Spitale RC et al. Structural imprints in vivo decode RNA regulatory mechanisms. Nature 519, 486–490 (2015). [DOI] [PMC free article] [PubMed] [Google Scholar]
- 27.Homan PJ et al. Single-molecule correlated chemical probing of RNA. Proc. Natl. Acad. Sci. U.S.A 111, 13858–13863 (2014). [DOI] [PMC free article] [PubMed] [Google Scholar]
- 28.Larman BC, Dethoff EA & Weeks KM Packaged and Free Satellite Tobacco Mosaic Virus (STMV) RNA Genomes Adopt Distinct Conformational States. Biochemistry 56, 2175–2183 (2017). [DOI] [PMC free article] [PubMed] [Google Scholar]
- 29.Underwood JG et al. FragSeq: transcriptome-wide RNA structure probing using high-throughput sequencing. Nat. Methods 7, 995–1001 (2010). [DOI] [PMC free article] [PubMed] [Google Scholar]
- 30.Lucks JB et al. Multiplexed RNA structure characterization with selective 2’-hydroxyl acylation analyzed by primer extension sequencing (SHAPE-Seq). Proc. Natl. Acad. Sci. U.S.A 108, 11063–11068 (2011). [DOI] [PMC free article] [PubMed] [Google Scholar]
- 31.Ding Y et al. In vivo genome-wide profiling of RNA secondary structure reveals novel regulatory features. Nature 505, 696–700 (2014). [DOI] [PubMed] [Google Scholar]
- 32.Incarnato D, Neri F, Anselmi F & Oliviero S Genome-wide profiling of mouse RNA secondary structures reveals key features of the mammalian transcriptome. Genome Biol 15, 491 (2014). [DOI] [PMC free article] [PubMed] [Google Scholar]
- 33.Rouskin S, Zubradt M, Washietl S, Kellis M & Weissman JS Genome-wide probing of RNA structure reveals active unfolding of mRNA structures in vivo. Nature 505, 701–705 (2015). [DOI] [PMC free article] [PubMed] [Google Scholar]
- 34.Krokhotin A, Mustoe AM, Weeks KM & Dokholyan NV Direct identification of base-paired RNA nucleotides by correlated chemical probing. RNA 23, 6–13 (2017). [DOI] [PMC free article] [PubMed] [Google Scholar]
- 35.McGinnis JL, Dunkle JA, Cate JHD & Weeks KM The mechanisms of RNA SHAPE chemistry. J. Am. Chem. Soc 134, 6617–6624 (2012). [DOI] [PMC free article] [PubMed] [Google Scholar]
- 36.Gherghe CM, Shajani Z, Wilkinson KA, Varani G & Weeks KM Strong correlation between SHAPE chemistry and the generalized NMR order parameter (S2) in RNA. J. Am. Chem. Soc 130, 12244–12245 (2008). [DOI] [PMC free article] [PubMed] [Google Scholar]
- 37.Deigan KE, Li TW, Mathews DH & Weeks KM Accurate SHAPE-directed RNA structure determination. Proc. Natl. Acad. Sci. U.S.A 106, 97–102 (2009). [DOI] [PMC free article] [PubMed] [Google Scholar]
- 38.Hajdin CE et al. Accurate SHAPE-directed RNA secondary structure modeling, including pseudoknots. Proc. Natl. Acad. Sci. U.S.A 110, 5498–5503 (2013). [DOI] [PMC free article] [PubMed] [Google Scholar]
- 39.Watters KE, Abbott TR & Lucks JB Simultaneous characterization of cellular RNA structure and function with in-cell SHAPE-Seq. Nucleic Acids Res (2015). doi: 10.1093/nar/gkv879 [DOI] [PMC free article] [PubMed] [Google Scholar]
- 40.Takahashi MK et al. Using in-cell SHAPE-Seq and simulations to probe structure-function design principles of RNA transcriptional regulators. RNA 22, 920–933 (2016). [DOI] [PMC free article] [PubMed] [Google Scholar]
- 41.Kuhlmann MM, Chattopadhyay M, Stupina VA, Gao F & Simon AE An RNA Element That Facilitates Programmed Ribosomal Readthrough in Turnip Crinkle Virus Adopts Multiple Conformations. J. Virol 90, 8575–8591 (2016). [DOI] [PMC free article] [PubMed] [Google Scholar]
- 42.Sztuba-Solinska J et al. Kaposi’s sarcoma-associated herpesvirus polyadenylated nuclear RNA: a structural scaffold for nuclear, cytoplasmic and viral proteins. Nucleic Acids Res 45, 6805–6821 (2017). [DOI] [PMC free article] [PubMed] [Google Scholar]
- 43.Lee B et al. Comparison of SHAPE reagents for mapping RNA structures inside living cells. RNA 23, 169–174 (2017). [DOI] [PMC free article] [PubMed] [Google Scholar]
- 44.Lavender CA et al. Model-Free RNA Sequence and Structure Alignment Informed by SHAPE Probing Reveals a Conserved Alternate Secondary Structure for 16S rRNA. PLoS Comput Biol 11, e1004126 (2015). [DOI] [PMC free article] [PubMed] [Google Scholar]
- 45.Engreitz JM et al. The Xist lncRNA Exploits Three-Dimensional Genome Architecture to Spread Across the X Chromosome. Science 341, 1237973–1237973 (2013). [DOI] [PMC free article] [PubMed] [Google Scholar]
- 46.Simon MD et al. High-resolution Xist binding maps reveal two-step spreading during X-chromosome inactivation. Nature 504, 465–469 (2013). [DOI] [PMC free article] [PubMed] [Google Scholar]
- 47.Jabara CB, Jones CD, Roach J, Anderson JA & Swanstrom R Accurate sampling and deep sequencing of the HIV-1 protease gene using a Primer ID. Proc. Natl. Acad. Sci. U.S.A 108, 20166–20171 (2011). [DOI] [PMC free article] [PubMed] [Google Scholar]
- 48.Busan S & Weeks KM Accurate detection of chemical modifications in RNA by mutational profiling (MaP) with ShapeMapper 2. RNA rna.061945. 117 (2017). doi: 10.1261/rna.061945.117 [DOI] [PMC free article] [PubMed] [Google Scholar]
- 49.Mortimer SA & Weeks KM A fast-acting reagent for accurate analysis of RNA secondary and tertiary structure by SHAPE chemistry. J. Am. Chem. Soc 129, 4144–4145 (2007). [DOI] [PubMed] [Google Scholar]
- 50.Steen K-A, Siegfried NA & Weeks KM Synthesis of 1-methyl-7-nitroisatoic anhydride (1M7). Protocol Exchange (2011). doi: 10.1038/protex.2011.255 [DOI] [Google Scholar]
- 51.Turner R, Shefer K & Ares M Safer one-pot synthesis of the ‘SHAPE’ reagent 1-methyl-7-nitroisatoic anhydride (1m7). RNA 19, 1857–1863 (2013). [DOI] [PMC free article] [PubMed] [Google Scholar]
- 52.Wang X, Schwartz JC & Cech TR Nucleic acid-binding specificity of human FUS protein. Nucleic Acids Res 43, 7535–7543 (2015). [DOI] [PMC free article] [PubMed] [Google Scholar]
- 53.Lagier-Tourenne C, Polymenidou M & Cleveland DW TDP-43 and FUS/TLS: emerging roles in RNA processing and neurodegeneration. Hum. Mol. Genet 19, R46–R64 (2010). [DOI] [PMC free article] [PubMed] [Google Scholar]
- 54.Bhardwaj A, Myers MP, Buratti E & Baralle FE Characterizing TDP-43 interaction with its RNA targets. Nucleic Acids Res 41, 5062–5074 (2013). [DOI] [PMC free article] [PubMed] [Google Scholar]
- 55.Kondo Y, Oubridge C, van Roon A-MM & Nagai K Crystal structure of human U1 snRNP, a small nuclear ribonucleoprotein particle, reveals the mechanism of 5’ splice site recognition. Elife 4, (2015). [DOI] [PMC free article] [PubMed] [Google Scholar]