Abstract
Many cognitive and computational models have been proposed to help understand working memory. In this paper, we present a simulation study of cortical processing of visual objects during several working memory tasks using an extended version of a previously constructed large-scale neural model (Tagamets & Horwitz, 1998). The original model consisted of arrays of Wilson-Cowan type neuronal populations representing primary and secondary visual cortices, inferior temporal cortex and prefrontal cortex (PFC). We added a module representing entorhinal cortex, which functions as a gating module. We successfully implemented multiple working memory tasks using the same model and produced neuronal patterns in visual cortex, IT and PFC that match experimental findings. These working memory tasks can include distractor stimuli, or can require that multiple items be retained in mind during a delay period (Sternberg’s task). Besides electrophysiology data and behavioral data, we also generated fMRI BOLD time-series from our simulation. Our results support the involvement of inferior temporal cortex in working memory maintenance and suggest the cortical architecture underlying the neural mechanisms mediating particular working memory tasks. Furthermore, we noticed during simulations of memorizing a list of objects, the first and the last item in the sequence were recalled best, which may implicate the neural mechanism behind this important psychological effect (i.e., the primacy and recency effect).
Keywords: working memory, computational modeling, neural network, visual object processing, fMRI
I. Introduction
The past three decades have witnessed an explosion of studies on memory in both humans and other primates. The prefrontal cortex (PFC) has been considered to play a crucial role in the maintenance of working memory, the cognitive process that is involved in the transient holding and manipulating of information. A large number of nonhuman primate studies using single-neuron recordings (Funahashi, Bruce, & Goldman-Rakic, 1989; Fuster, Bauer, & Jervey, 1982; Miller, Erickson, & Desimone, 1996) and lesions (Levy & Goldman-Rakic, 1999) have supported the involvement of the PFC in working memory-related processes. Human brain-imaging studies (Courtney, Petit, Maisog, Ungerleider, & Haxby, 1998; D’Esposito et al., 1995; Haxby, Ungerleider, Horwitz, Rapoport, & Grady, 1995; Husain, Tagamets, Fromm, Braun, & Horwitz, 2004; Riley & Constantinidis, 2015), using positron emission tomography (PET) and functional magnetic resonance imaging (fMRI), have also revealed the crucial role that PFC plays in both object and spatial working memory.
Working memory tasks, such as the delayed match-to-sample (DMS) task and Sternberg’s recognition task (Sternberg, 1966, 1969), have been extensively used in the study of the behavior of neurons and microcircuits related to working memory maintenance in the PFC (Funahashi, Inoue, & Kubota, 1993; Fuster & Alexander, 1971, 1973; Kubota & Niki, 1971; Schon, Ross, Hasselmo, & Stern, 2013). However, the underlying neurobiological mechanisms for the brain activations seen in these studies and the interactions between PFC and other brain regions, such as inferior temporal cortex, to support working memory operations is not well understood.
We and others have argued that large-scale neural network models can be powerful tools for addressing such issues (Chaudhuri, Knoblauch, Gariel, Kennedy, & Wang, 2015; Corchs & Deco, 2002; Garagnani, Wennekers, & Pulvermuller, 2008; Gisiger & Kerszberg, 2006; Tagamets & Horwitz, 1998). In order to understand better the neural substrate of human imaging studies using PET and fMRI, Tagamets and Horwitz proposed a large-scale model (LSNM) based on the visual ventral pathway that simulated a DMS task for objects (Horwitz & Tagamets, 1999; Tagamets & Horwitz, 1998). The model was later updated for transcranial magnetic stimulation (TMS), structural equation modeling (SEM), function magnetic resonance imaging (fMRI) and magnetoencephalography (MEG) simulations (Horwitz & Banerjee, 2012; Husain et al., 2002; Kim & Horwitz, 2009). A similar model was also developed to perform auditory tasks for fMRI simulations (Husain et al., 2004) based on the hypothesis that the sensory cortices involved in visual and auditory object processing perform similar operations but act on different features. These models successfully simulated cortical neuronal activities and functional brain imaging data that generally agree with experimental results. However, a number of limitations of the original models exist, including: (1) the models could not handle distractors or multiple stimuli; (2) the inferior temporal neural activity during the delay period did not always match the experimental findings in nonhuman electrophysiology study in which the IT area showed higher-than-baseline activity during the delay period (Fuster et al., 1982); and (3) the rest of the brain was not included in the model.
In this paper, we will present a large-scale neural network model that can perform multiple short-term memory (STM) tasks for novel objects, with the simulated neuronal behaviors and simulated fMRI patterns matching experimental data. We modified and expanded the original model by adding one module representing the entorhinal cortex to perform a gating mechanism. We successfully simulated three versions of DMS tasks with or without distractors, and a variation of Sternberg’s recognition task that required the model to hold multiple items in working memory. A primacy/recency effect was observed during the simulations of memorizing a list of objects, i.e., the first and the last item in the sequence were recalled best, which may implicate the neural mechanisms behind this important psychological effect. Moreover, we have now improved the match between simulated and experimental activity and observed rich neuronal behaviors during the delay period in the module representing inferior temporal cortex. Finally, we have placed our model in a whole-brain connectome framework (Ulloa & Horwitz, 2016). In this paper, we will restrict our attention to the visual processing model.
II. Methods
1. Brief review of visual object processing model
The visual object processing model developed by Tagamets and Horwitz (Horwitz & Tagamets, 1999; Tagamets & Horwitz, 1998) consisted of interconnected neuronal populations representing the cortical ventral pathway found to process primarily the features of a visual object (Haxby et al., 1991; Mishkin & Ungerleider, 1982) (see Fig. 1 of Ulloa and Horwitz, 2016). Shape is the feature used in the model to characterize a visual object. Model neurons in modules representing early visual cortex were assumed to be orientation selective (for simplicity, horizontal and vertical orientations were used). Beginning in striate visual cortex, the ventral processing pathway extends into the inferior temporal gyrus and projects into ventrolateral prefrontal cortex. The modules that comprise the visual model include ones representing primary and secondary visual cortex (V1/V2), area V4, anterior inferotemporal cortex (IT), and prefrontal cortex (PFC). Each of these regions contains one or more neural populations with different functional attributes (discussed below). The response properties of the simulated neuronal populations were based on known monkey neural electrophysiological data (e.g., Funahashi, Bruce, & Goldman-Rakic, 1990). An important assumption for the visual model, inferred from such experimental data, was that the spatial receptive field of neurons increased along the ventral processing pathway.
Fig. 1.
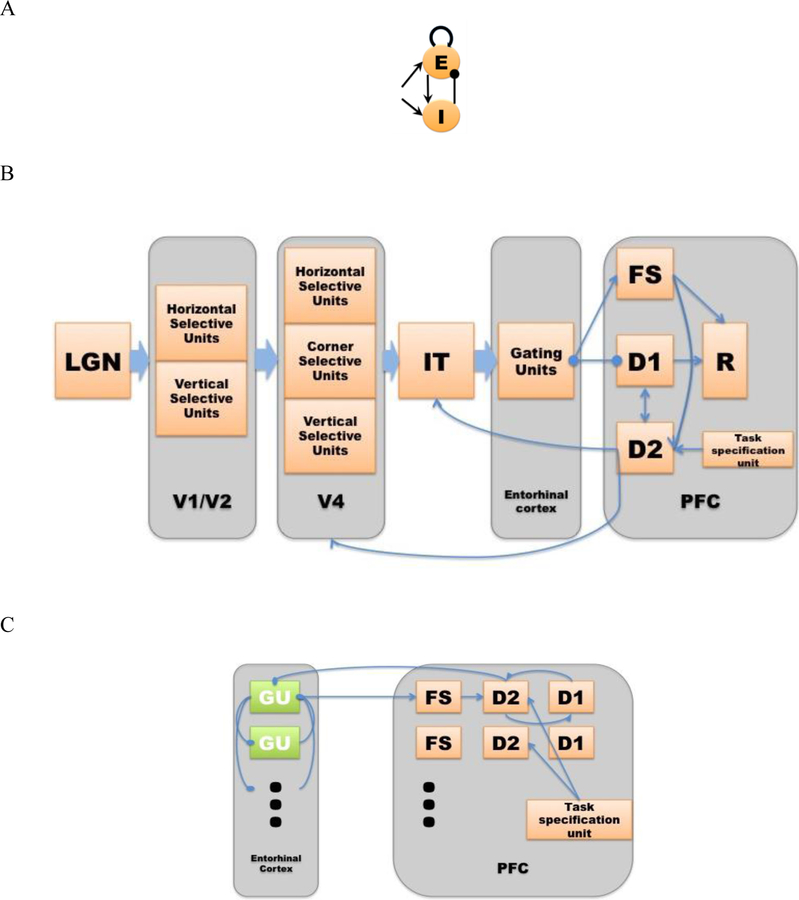
A. Structure of a Wilson-Cowan microcircuit, which can be considered as a simplified representation of a cortical column. Each microcircuit consists of an excitatory and an inhibitory element with the excitatory element corresponding to the pyramidal neuronal population in a column and the inhibitory element corresponding to the inhibitory interneurons. B. The network structure of the modified visual LSNM. Compared to the original LSNM structure (Tagamets & Horwitz, 1998; Ulloa & Horwitz, 2016), (1) a gating module (GU) has been added, which is tentatively located in the entorhinal cortex (EC); (2) multiple sets of working memory modules (D1 and D2 in PFC) are used, instead of one set of D1 and D2 units in the original model. C. The entorhinal cortex and additional working memory modules are designed to act as a gate between IT and PFC. Multiple groups of entorhinal neurons and prefrontal cortex neurons are incorporated to hold multiple items in short-term memory. The entorhinal neurons competitively inhibit each other so that a group of gating neurons will be activated when a stimulus comes in and inhibits other groups of gating neurons. Once the item is stored, an inhibitory feedback from PFC to entorhinal cortex will suppress the active gating neurons and release other gating neurons so that the remaining gating neurons are ready for new stimuli.
Each neuronal population in our model consisted of 81 microcircuits, each representing a cortical column. As shown in Fig. 1A, the model employed modified Wilson-Cowan units (an interacting excitatory and inhibitory pair of elements) as the microcircuit (Tagamets & Horwitz, 1998; Wilson & Cowan, 1972). The input synaptic activity to each microcircuit can also be evaluated and combinations of this activity were related to the fMRI or MEG/EEG signals via a forward model. In this paper, we will only consider simulated fMRI (Horwitz & Tagamets, 1999).
This visual large-scale neural model was designed to perform a short-term recognition memory delayed match-to-sample (DMS) task. During each trial of the task a stimulus S1 is presented for a certain amount of time, followed by a delay period in which S1 has to be kept in short-term memory. When a second stimulus (S2) is presented, the model has to respond as to whether S2 matches S1. The model also performs a control task: passive perception of the stimuli. Multiple trials of the active and passive tasks constitute a simulated functional neuroimaging study.
Ulloa and Horwitz (Ulloa & Horwitz, 2016) embedded the visual LSNM into a whole brain framework using The Virtual Brain (TVB) software package (Sanz Leon et al., 2013). TVB is a simulator that combines: (i) white matter structural connections among brain regions to simulate long-range connections, (ii) a neuronal population model to simulate local brain activity, and forward models that convert simulated neural activity into simulated functional neuroimaging data (i.e., fMRI or EEG/MEG). The TVB framework is helpful for simulating functional and effective connectivity neuroimaging data (see Ulloa and Horwitz, 2016) and the interaction between our model and TVB enables us to explore how task and intrinsic activities interact (Ulloa and Horwitz, in preparation). In the current paper, TVB neurons provide neural noise to the embedded LSNM. The structural connectome we employ is that due to Hagmann et al. (2008), which comprises 998 regions of interest (ROIs), and the simulated neuronal microcircuits at each TVB node are Wilson-Cowan units.
2. The structural network
The structural network of the modified visual model is shown in Fig. 1B. Each module of the modified network is explained in detail in the following. As detailed in the original paper by Tagamets and Horwitz (Cerebral Cortex, 1998), most of the connections are hand-tuned. However, the connections between V4 and IT were learned by means of a Hebbian algorithm.
V1/V2
In the model, the early visual areas V1 and V2 are combined and are designed to consist of orientation selective units (for simplicity we have only employed horizontal selective units and vertical selective units). Single-neuron recording experiments in primates have confirmed that neurons exist in both V1 and V2 areas that respond preferentially to visual features such as line orientation, edges and colors (Hubel, Wiesel, & Stryker, 1977; Peterhans & von der Heydt, 1993; Roe & Ts’o, 1995). This formulation is unchanged from the original Tagamets & Horwitz (Tagamets & Horwitz, 1998) model.
V4
The V4 area is designed as a continuation of the shape processing pathway and consists of three populations of units: horizontal selective units, vertical selective units and corner selective units. They are constructed to have an increased spatial receptive field relative to V1/V2, i.e., they respond to longer horizontal and vertical line segments, and also corners formed by adjacent pairs of horizontal and vertical lines. Experimental studies provide the basis for this design; neurons in area V4 share similar properties with earlier areas but appear to encode more complex properties of shape (Desimone & Schein, 1987; Gallant, Braun, & Van Essen, 1993). As with V1/V2, this module is the same as in the original model. We did add one new item, however; there is now feedback connectivity from V4 to V1/V2.
IT
The next processing module of the model corresponds to inferior temporal cortex and is denoted by IT. The IT module functions as a feature integrator and generates the initial rough representation of a percept. In single-neuron recordings, as we mentioned in the introduction, IT areas exhibit various active behaviors during the short delay periods that might be relevant to visual feature selective activity and visual information maintenance (Fuster et al., 1982; Horel, Pytko-Joiner, Voytko, & Salsbury, 1987; Miyashita, 1988; Petrides, 2000; Ranganath & D’Esposito, 2005). IT was also a module in the original model.
Entorhinal cortex (EC)
In our new model, we have added a new module - the entorhinal cortex - to serve as a gate between IT and PFC. We designed the gating mechanism by incorporating several groups of neurons in entorhinal cortex that competitively inhibit one another (see Fig. 1C). The purpose of such a mechanism is to avoid the working memory of one stimulus being overwritten by later incoming stimuli. We tentatively assigned the entorhinal cortex based on results of a series of empirical findings. The involvement of entorhinal cortex in working memory encoding has been supported by multiple experimental studies (for a review, see (Lech & Suchan, 2014)), although the actual neural mechanisms remain unclear. Divergent projections from the anterior IT area to the EC have been verified by anatomical studies in monkeys (Saleem & Tanaka, 1996). Some recent evidence suggests that the outputs of the medial PFC are sent back to the lateral EC and perirhinal cortex (Navawongse & Eichenbaum, 2013). In our design, a group of gating neurons will be activated when a stimulus comes in and inhibits other groups of gating neurons. Once the item is stored in this working memory buffer, an inhibitory feedback from PFC to entorhinal cortex will suppress the active gating neurons and release other gating neurons so that the remaining gating neurons are ready for new stimuli. By such a design, we are assuming that each group of entorhinal gating neurons could be used only once during a task trial.
Prefrontal area
Model neurons in the PFC module, in a short-term memory task condition, can be delineated into four types based on experimental data acquired by Funahashi et al. (1990). In our model (see Fig. 1B), the submodule FS contains cue-sensitive units that in general reflect the activities in the IT module. D1 and D2 submodules form the short-term memory units by exciting one another during the delay period. D1 is active only during the delay period and D2 is active during the stimuli presentations and the delay period. In our modified model, we now have multiple sets of D1 and D2 submodules built into the model such that holding more than one item in short-term memory is possible (see Fig. 1C). R serves as a response module (output). It receives information from D1 (containing a representation of a stimulus being kept in short-term memory) and FS (containing the temporary representation of the stimulus just presented). FS or D1 alone cannot activate R. When the incoming stimulus matches an item in working memory, FS and D1 together can activate R. Note also that we assume that there are a limited number of gating units and a similar limited number of D1-D2 units, since empirical studies indicate that only a limited number of items can be simultaneously kept in short-term memory [e.g., the so-called 7±2 (G. A. Miller, 1956); others have proposed a more limited capacity such as 3 or 4 (Cowan, 2001)]. For computational simplicity, in this paper we will employ no more than three items.
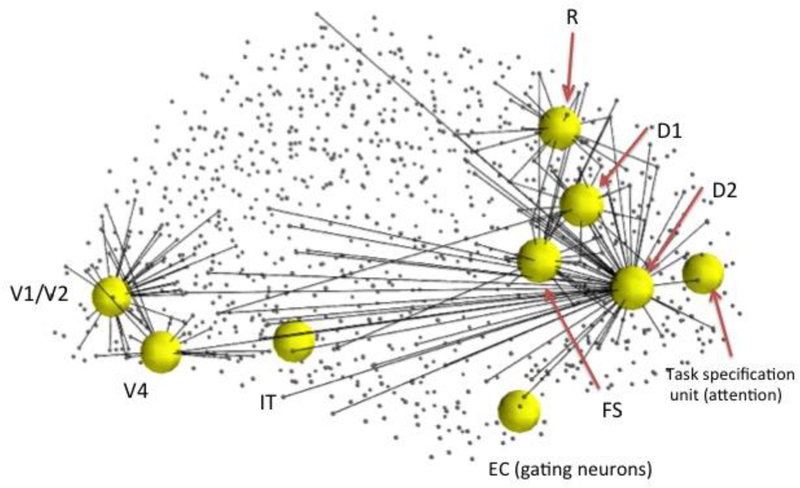
We first found the hypothetical regions of interest (ROIs) corresponding to each module in our LSNM and the connected nodes in Hagmann’s connectome. Then we embedded our revised model of microcircuits and network structure into the connectome. We ran the simulations using our in-house simulator in parallel with Hagmann’s connectome using the Virtual Brain software (Sanz Leon et al., 2013). Fig. 2 shows the embedded model in the Hagmann’s connectome. Overall, the LSNM embedded in TVB was able to perform the DMS task, generated simulated neural activities in the various brain regions that match empirical data from non-human preparations, and produced simulated functional neuroimaging data that generally agree with human experimental findings (see Ulloa and Horwitz, 2016, for details).
Fig. 2.
Embedded model in Hagmann’s connectome (Hagmann et al., 2008). We first found hypothetical locations for our model’s regions of interest (ROIs) and the connected nodes in the connectome (small dots connected to ROIs). We embedded our model of microcircuits and network structure into the structural connectome model of Hagmann et al. (2008). See Ulloa and Horwitz (2016) for details.
Although arbitrary, a task specification module, which is located in the superior frontal gyrus of the Virtual Brain model, gives instructions to the model concerning what task is going to be performed: whether only the first stimulus should be remembered or a list of items should be remembered. This module provides a low-level, diffuse incoming activity to the D2 module in the prefrontal area which can be interpreted as an attention level. The attention level/task parameter can be modulated and is specified before each trial in a simulation. High attention will ensure a (better) working memory for the presenting stimulus. When the attention level is low, the working memory modules are not able to hold a stimulus throughout the delay period. Note that the mutual inhibition within the EC module does not depend explicitly on the level of attention.
The Talairach coordinates (Talairach, 1988) and the closest node in Hagmann’s connectome for each of the LSNM modules discussed above were identified (see Table 1), based on visual experimental findings (Haxby et al., 1991). As to the prefrontal module, which contains four submodules (FS, D1, D2, R), we used the Talairach coordinates of the prefrontal cortex in Haxby et al. (1995) for the D1 submodule and assigned the locations of adjacent nodes for the rest of the submodules (FS, D2, R) (see Table 1). This arrangement is due to the fact, as mentioned above, that the four types of neuronal populations were based on the experimental findings in monkey PFC during a delayed response task (Funahashi, Bruce, & Goldman-Rakic, 1990). It is not known if these four neuronal types were found in separate anatomical locations in PFC or were found in the same brain region.
Table 1.
The Talairach coordinates (Talairach, 1988) and the closest node in the Hagmann’s connectome (Hagmann et al., 2008) corresponding to visual LSNM modules. Note that the locations of FS, D1, D2 and R are not explicitly known (see text) and were chosen only to demonstrate validity of the method.
| Modules | Talairach location | Source | Host connectome node | |
|---|---|---|---|---|
| V1/V2 | (18, −88, 8) | Haxby et al., 1995 | (14, −86, 7) | |
| V4 | (30, −72, −12) | Haxby et al., 1995 | (33, −70, −7) | |
| IT | (28, −36, −8) | Haxby et al., 1995 | (31, −39, −6) | |
| EC | (25, −12, −25) | Hagmann et al., 2008 | (25, −12, −25) | |
| FS | Location selected for illustrative purposes | (47, 19, 9) | ||
| D1 | (42, 26, 20) | Haxby et al., 1995 | (43, 29, 21) | |
| D2 | Location selected for illustrative purposes | (42, 39, 2) | ||
| R | Location selected for illustrative purposes | (29, 25, 40) | ||
3. Simulated experiments
We use the extended model to perform a number of simulated experiments that can include not only one stimulus, but others as well, some of which can be considered to be distractors. The complete set of simulated experiments is the following:
Experiment 1: Single stimulus
We first displayed a single stimulus to the model as a test to observe the responses of different modules of the model to a transient visual input. No response is required. The attention/task parameter is set to a high value (0.3).
Experiment 2: Delayed match-to-sample task
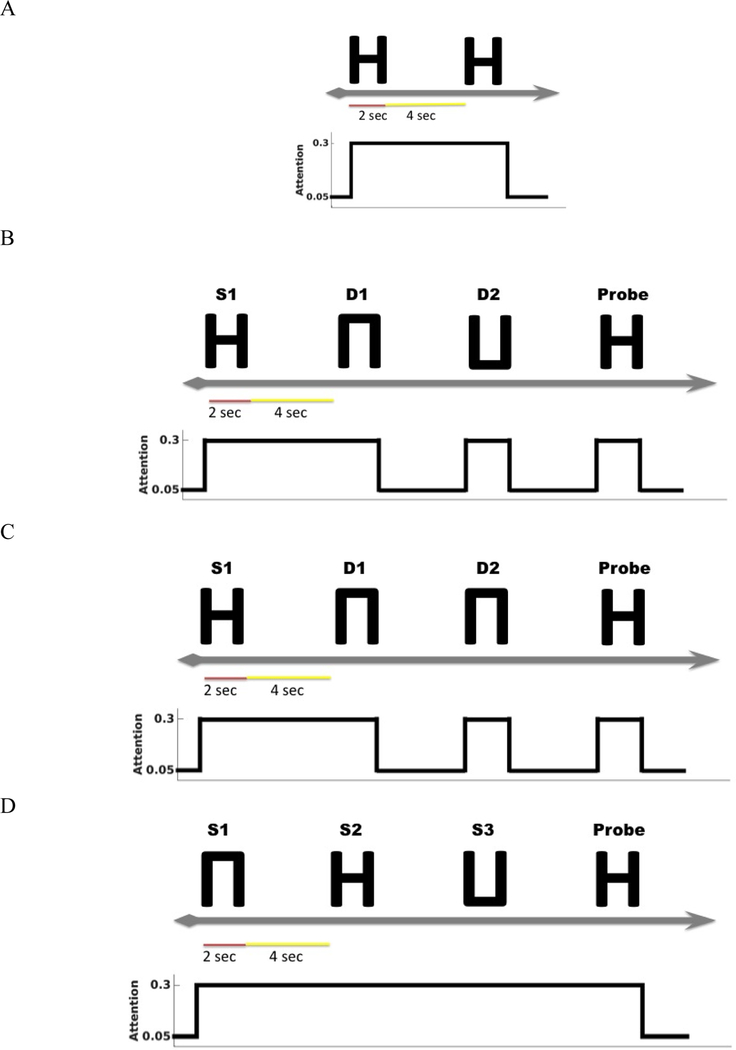
This experiment implemented the original delayed match-to-sample (DMS) task to demonstrate that the new model (with an added node – the entorhinal cortex) continues to perform the DMS task and gives the same results as the original model (Ulloa & Horwitz, 2016). One typical DMS trial consists of the presentation of a stimulus, an ensuing delay period, a presentation of a probe (the same or a new stimulus) and at the end of it, the simulated subjects need to decide whether the probe is the same as the first stimulus presented (see Fig. 3A). The attention/task parameter is set to high (0.3) during a trial.
Fig. 3.
A. The timeline and task-parameter/attention level of a single delayed match-to-sample trial. The simulated subjects’ task is to identify whether the probe is a match with the first stimulus. B. The timeline for a single trial of a DMS task with distractors. The simulated subjects need to ignore the two intervening distractors and only respond to the probe. C. The timeline for a single trial of an “ABBA” task, i.e., a DMS task with two repeated distractors. D. The timeline for a single trial of Sternberg’s recognition task. The simulated subjects are shown a list of stimuli and their task is to decide, after a delay, whether the probe is a match with any stimulus in the list.
Experiment 3: Delayed match-to-sample task with distractors
We implemented a version of DMS task with intervening distractors. The simulated subjects were shown two distractors before the probe was displayed (see Fig. 3B). The attention/task parameter is set to high (0.3) for the first stimulus and decreased to low (0.05) following the presentation of the distractors.
Experiment 4: “ABBA” task
A special version of the distractor task (the “ABBA” task) is used. The “ABBA” task was employed by Miller et al. (Miller, Gochin, & Gross, 1993) in monkey electrophysiology experiments. The model is supposed to hold its response when repeated distractors (“B”) are shown and to respond only to the matched stimulus (“A”) (see Fig. 3C).
Experiment 5: Sternberg’s recognition task
A variant of Sternberg’s recognition task (Sternberg, 1966, 1969) was used. On each trial of the simulation, three stimuli were presented sequentially, followed by a delay period and then a probe. The subjects’ task was to decide whether the probe was a match to any of the three stimuli presented earlier (see Fig. 3D). The Sternberg paradigm with visual objects has been used in many studies, and thus allows us to compare our simulated results with experimental results.
4. Simulating electrical activity and fMRI activity
We simulated the electrical activity and fMRI activity of the model as our measure while implementing the tasks discussed above. The electrical activity of one simulated neuronal unit, a modified Wilson-Cowan configuration, is given by the following equations:
and
where is the rate of change, is the decay rate, are gain constants, are the connectivity weights within one neuronal unit, are the input threshold, is the noise. and are the incoming inputs from other nodes. is given by:
where and are the weights for connections from the excitat ory (E) and inhibitory (I) elements of th LSNM unit to the excitatory element of th LSNM unit, is the electrical activity of the connectome excitatory unit connected to LSNM unit , and is the connection weight. is a coupling term obtained by the Gaussian pseudo-random number generator of Python. is given by:
where and are the weights for connections from the excitatory (E) and inhibitory (I) elements of th LSNM unit to the excitatory element of th LSNM unit.
The integrated synaptic activity is computed prior to computing fMRI BOLD activity, by spatially integrating over each LSNM module and temporally integrating over 50 ms (Horwitz & Tagamets, 1999)
where is the sum of absolute values of inputs to the excitatory and inhibitory elements of unit at time :
The last term is the sum of synaptic connections from all other LSNM units and connectome nodes to the th unit in LSNM.
In simulating an fMRI study, the model alternately implements a block of DMS task trials (three trials) and a block of control task trials (three trials). The control task used degraded shapes and each trial of the control task followed the design of the DMS task in Experiment 2, except that the attention/task parameter is set to a low value. We first computed the integrated synaptic activity for select regions of interests (ROIs) (Ulloa & Horwitz, 2016). Using the integrated synaptic activity of ROIs as the input to the fMRI BOLD balloon model of hemodynamic response (Stephan, Weiskopf, Drysdale, Robinson, & Friston, 2007; Ulloa & Horwitz, 2016), we calculated the simulated fMRI signal time-series for all our ROIs and then downsampled the time-series to correspond to a TR value of 2 seconds.
A top-down task control signal is also used before each trial. The top-down task control signal informs the model that the trial is a DMS task, DMS task with distractors, an “ABBA” task, in which only the first stimulus is the target to be remembered, or a Sternberg’s recognition task, in which there are multiple targets to remember. The top-down control doesn’t change the network structure; it only controls the attention module so as to apply high attention to targets and low attention to distractors.
In each of the tasks, the simulated stimulus was on for 2 seconds (one time step in the model is considered to have a duration of 5 ms) followed by a 4 seconds delay period. After each trial, the model was reset in the intertrial interval. When performing the tasks, we varied the connectivity weights between brain regions by slight amounts to create multiple “subjects” (see (Ulloa & Horwitz, 2016)). In both the DMS task and the Sternberg’s recognition task, the short delay periods between the presentations of stimuli and the probe are the main elements that make the two tasks tests of short-term memory.
III. Results
1. Response to a single stimulus
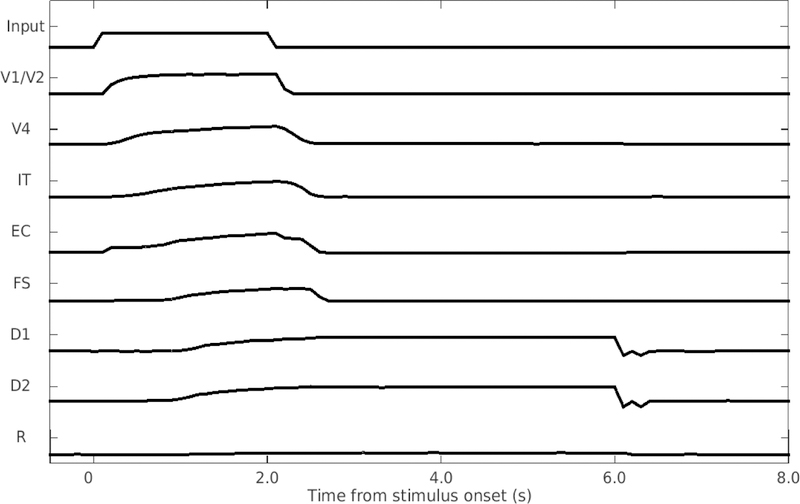
Fig. 4 shows the responses of the different modules of the model when a single visual input (a shape composed of horizontal and vertical line segments) was displayed. The attention level was set to high. Each module of the model exhibited proper behaviors in the simulation. Early visual cortex (V1/V2) responded quickly to the stimulus and displayed a sharp decrease in activity when the stimulus disappeared. As the visual input propagated deeper into the network, the average activity displayed slower and smoother responses. For instance, the average activity of working memory modules (D1, D2) slowly climbed during the presentation of the stimulus and displayed persistent activity in the delay period when the stimulus disappeared. The response module (R) showed only noise since only one stimulus was presented.
Fig. 4.
Response of the model to a single stimulus. One stimulus is shown to the model for 2 seconds, followed by a 4-second delayed period before resetting. The vertical axis is the normalized mean neuronal activity (i.e., normalized firing rate) in the different modules.
2. Delayed match-to-sample task
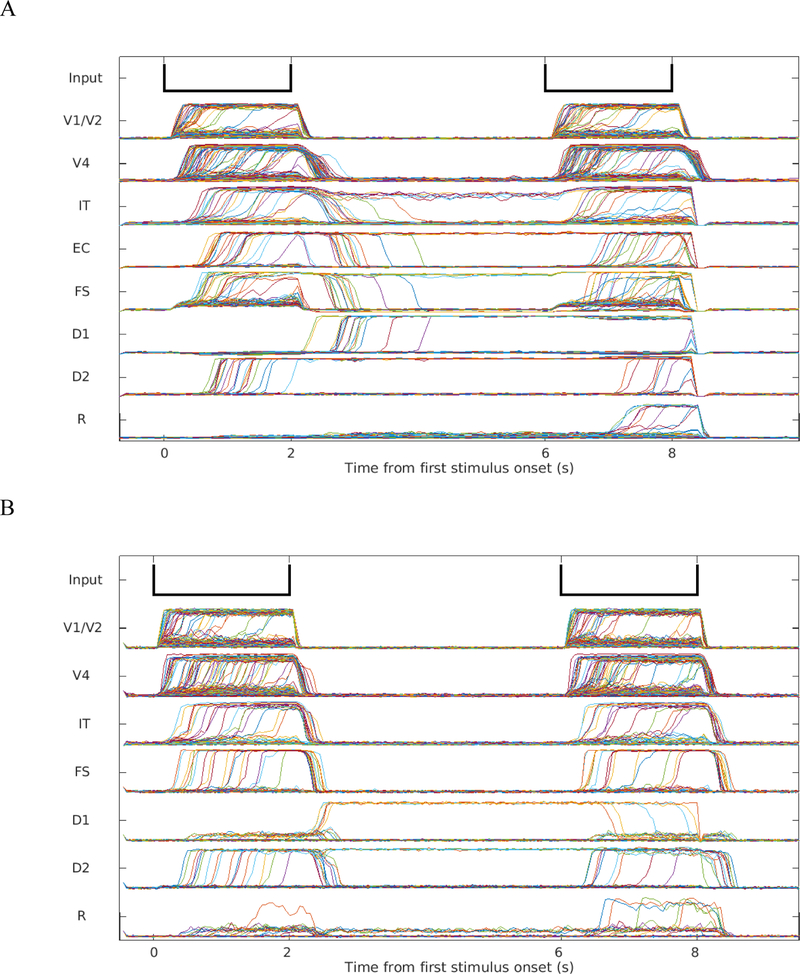
We ran simulations of the delayed match-to-sample condition using both our extended visual LSNM and the original LSNM (Tagamets & Horwitz, 1998; Ulloa & Horwitz, 2016). The simulated neuronal activities of the extended LSNM and the original LSNM are shown in Fig. 5. As shown in Table 1, the accuracy of simulations run using the extended model is as high as the simulations run using the original model.
Fig. 5.
A. Neuronal activities of the excitatory neurons in the different modules during one trial of the DMS task simulated using the extended model. B. The excitatory neuronal activities of the different modules during one trial of DMS task simulated using the original model. In the simulations with the new model, the IT module showed activity during the delay period, which does not occur for the original model.
The new model also improved the performance of the inferotemporal area compared with the original model (see Fig. 5). The module representing the inferotemporal area showed higher-than-baseline mean activation level during the delay periods in the delayed match-to-sample task, which eliminated the discrepancy between previous simulation and experimental results. As pointed out in the Introduction, the neurons of the IT module of the original LSNM of Tagamets and Horwitz (Tagamets & Horwitz, 1998) did not show increased activity during the delay period of a DMS trial, in contradiction with nonhuman electrophysiological findings (Fuster et al., 1982). To address this small yet important disagreement, we added a feedback connection from the D2 module in PFC to IT. Fig. 5A shows the mean activities of selected modules in a simple delayed match-to-sample task from which the delay activation of the inferotemporal area can be seen.
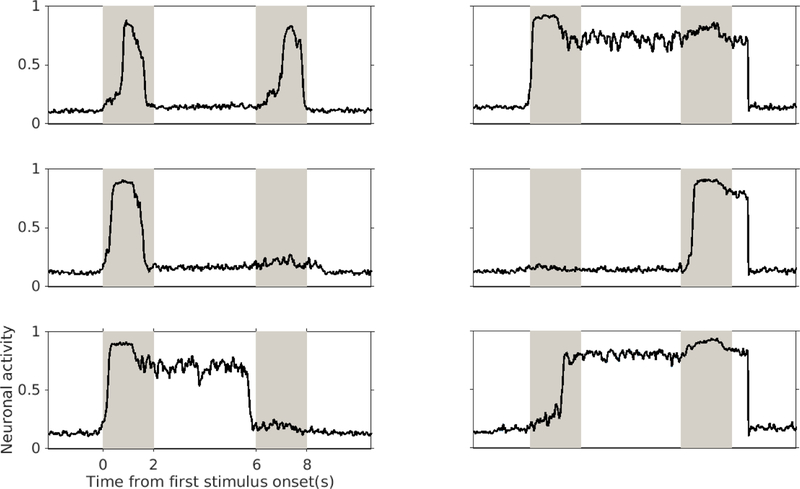
When looking into individual behaviors of inferotemporal neurons of the extended model, we noticed that these neurons exhibited selectivity to different stimuli (Fig. 6). Among activated inferotemporal neurons, most responded to all stimuli with or without delay activity, but neurons with selective activity can be observed in each trial. The data for the multiple-item holding Sternberg’s task also displayed similar behaviors of stimulus-selectivity. We did not observe similar behaviors in PFC. This difference between the model’s IT and PFC is consistent with experimental results (Miller et al., 1996) and shows that PFC is mostly involved in working memory and decision-making and thus supporting the idea that PFC neurons have little or no contribution in coding complex visual features.
Fig. 6.
Different types of excitatory neuronal activity and selectivity behaviors of simulated inferotemporal neurons during one DMS trial. Each of the gray stripes represents the presentation of one stimulus and the white stripes between them represent the delay periods. We observed that the simulated neurons in the IT module exhibited several different activity patterns and selectivity to different stimuli. Most of activated inferotemporal neurons responded to both stimuli with or without delay activity (top panel), but in each trial we observed neurons that responded only to the first or the second stimulus (middle and bottom panels); neurons with delay activity are shown in the bottom panel).
3. DMS task with distractors and the “ABBA” task
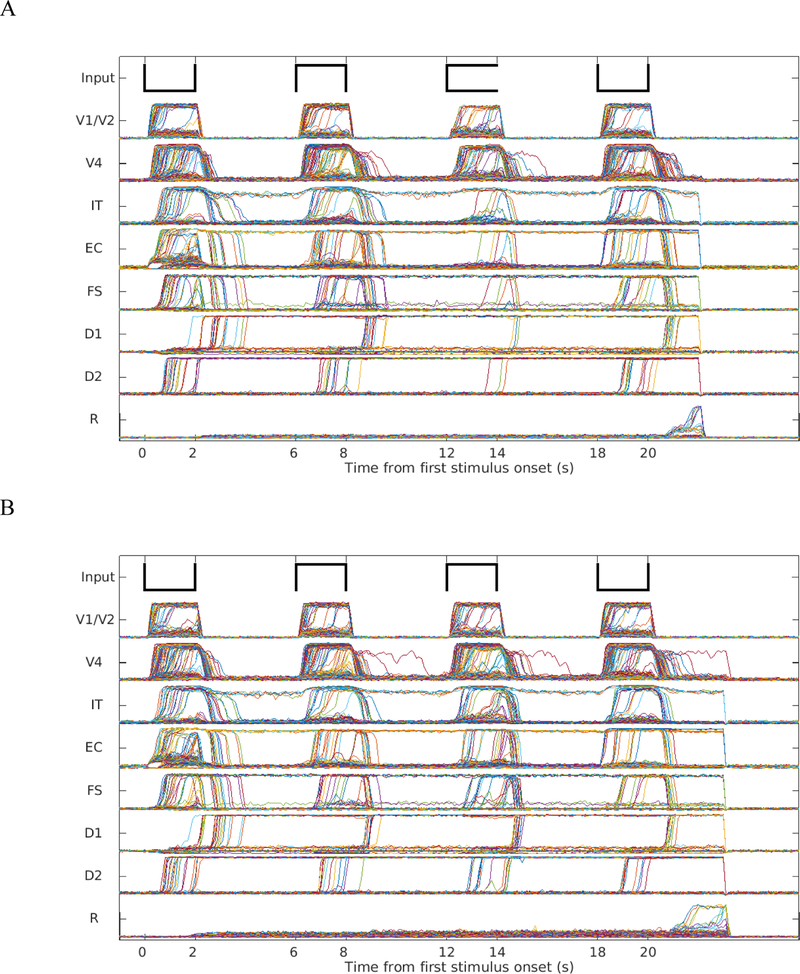
The model performed the DMS task with distractors and the “ABBA” task at a slightly lower accuracy rate (although still well above chance) than the simple DMS task (see Table 2). Figs. 7A and 7B show the simulated neuronal activities of the different modules for the distractor task and the ABBA task, respectively. All modules (except the response module R) show increases in activation to all stimuli, but importantly, the response units (R) display activity greater than background noise only to the stimulus that matches the target. During the simulations shown in Figs. 7A and 7B, four separate groups of entorhinal neuronal units responded respectively to the four items and passed the information to prefrontal cortex for storage and comparison. The target (first stimulus) and intervening distractors are all stored in working memory modules (D1 and D2), but in separate groups of neuronal units during the simulation. The target is stored with high attention while the intervening distractors are stored with lower attention. Consequently, the storage of distractors is weaker than the storage of targets, i.e., fewer simulated neuronal units in their D1 and D2 modules showed persistent activity throughout the trial.
Table 2.
Performances of 10 simulated subjects during 4 tasks (DMS task, DMS task with distractors, ABBA task, Sternberg’s recognition task). Performances are measured by counting the number of neuronal units in the decision-making module (R) firing above a certain threshold during the response period.
| Subject | DMS | DMS w/ distractors | ABBA | Sternberg |
|---|---|---|---|---|
| S1 | 92.3% | 90.5% | 88.7% | 90.3% |
| S2 | 81.0% | 80.5% | 80.7% | 78.7% |
| S3 | 92.0% | 92.0% | 89.7% | 87.0% |
| S4 | 86.5% | 84.0% | 82.3% | 82.0% |
| S5 | 88.5% | 89.0% | 87.0% | 87.7% |
| S6 | 77.5% | 75.5% | 75.7% | 73.0% |
| S7 | 81.0% | 79.5% | 79.0% | 78.7% |
| S8 | 73.0% | 69.5% | 68.0% | 69.3% |
| S9 | 79.0% | 79.5% | 79.0% | 78.0% |
| S10 | 84.0% | 81.0% | 81.7% | 79.7% |
| Mean | 84.5% | 82.1% | 81.2% | 80.4% |
| Standard deviation | 6.02% | 6.63% | 6.15% | 6.22% |
Fig. 7.
A. Neuronal activities for DMS task with two intervening distractors. B. The neuronal activities for the “ABBA” task. The two distractors were held in PFC with low attention (the persistent activities in D1 and D2 modules). The response module in both tasks properly avoided the distractors and responded when the probe was a match of the first stimulus.
4. Sternberg’s recognition task
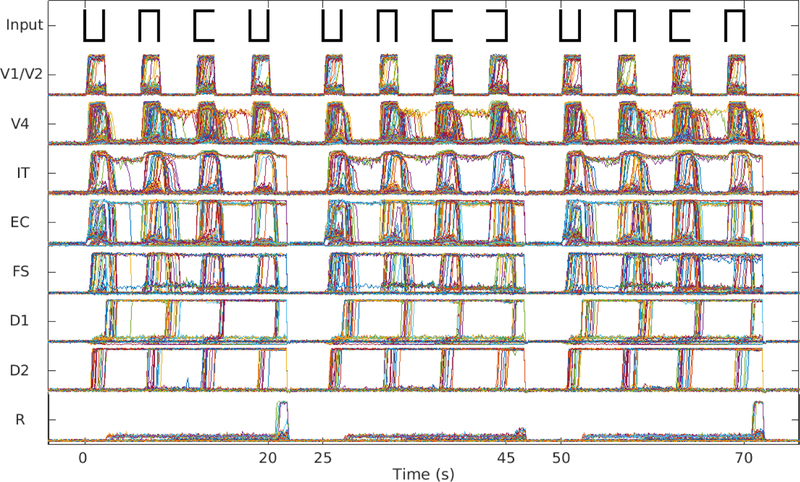
Fig. 8 shows the simulated neuronal activity of each module in three trials of Sternberg’s recognition task, in which the model successfully responded to two matched cases and rejected 1 non-matched case. Note that in the first trial, the probe stimulus matches the first of the three stimuli being held in short-term memory, whereas in the third trial, the probe matches the second presented stimulus. In both trials, the response units show increased activity, unlike the second trial where none of the stimuli matches the probe. The average accuracy rates of 10 simulated subjects can be found in Table 2.
Fig. 8.
Neuronal activities for Sternberg’s task. Three trials of Sternberg’s recognition task are shown. In each trial, the first three stimuli are the targets that the model needs to hold in working memory. In the first and last trial, the probe (last stimulus) was a match of one of the targets (the first and the second, respectively) and the response module R made proper responses. In the second trial shown, the probe was not a match of any of the targets and R didn’t respond to it.
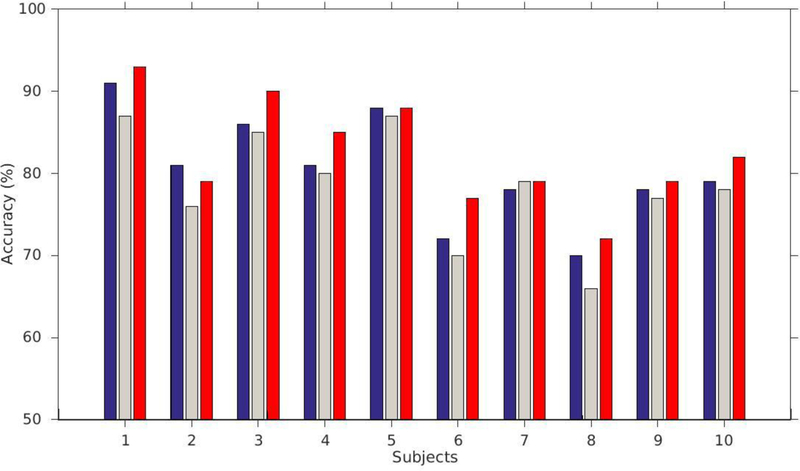
In the simulated results of the Sternberg’s recognition task, we noticed a significant primacy/recency effect. When the test stimulus is a match with the first or the last item of the three items remembered, the model has a greater chance to make a correct response than when the test stimulus is a match with the second item (see Fig. 9 and Table 3). The recency effect is stronger than the primacy effect. We will discuss our tentative explanation of this finding in the Discussion.
Fig. 9.
Mean accuracy (percent correct) for each subject for each position of the stimulus matching the probe stimulus of the Sternberg task. Blue bars correspond to the case when the matching stimulus was first, gray when it was second and red when it was third. Nine of the 10 subjects had more errors for the second position than for the other two, and nine subjects had their highest accuracy for the third position (recency effect).
Table 3.
Performances of 10 simulated subjects during Sternberg’s task when the probe is a match of the first, the second and the third target, respectively.
| Target 1 | Target 2 | Target 3 | |
|---|---|---|---|
| S1 | 91% | 87% | 93% |
| S2 | 81% | 76% | 79% |
| S3 | 86% | 85% | 90% |
| S4 | 81% | 80% | 85% |
| S5 | 88% | 87% | 88% |
| S6 | 72% | 70% | 77% |
| S7 | 78% | 79% | 79% |
| S8 | 70% | 66% | 72% |
| S9 | 78% | 77% | 79% |
| S10 | 79% | 78% | 82% |
| Mean | 80% | 79% | 82% |
| Standard deviation | 6.28% | 6.53% | 6.17% |
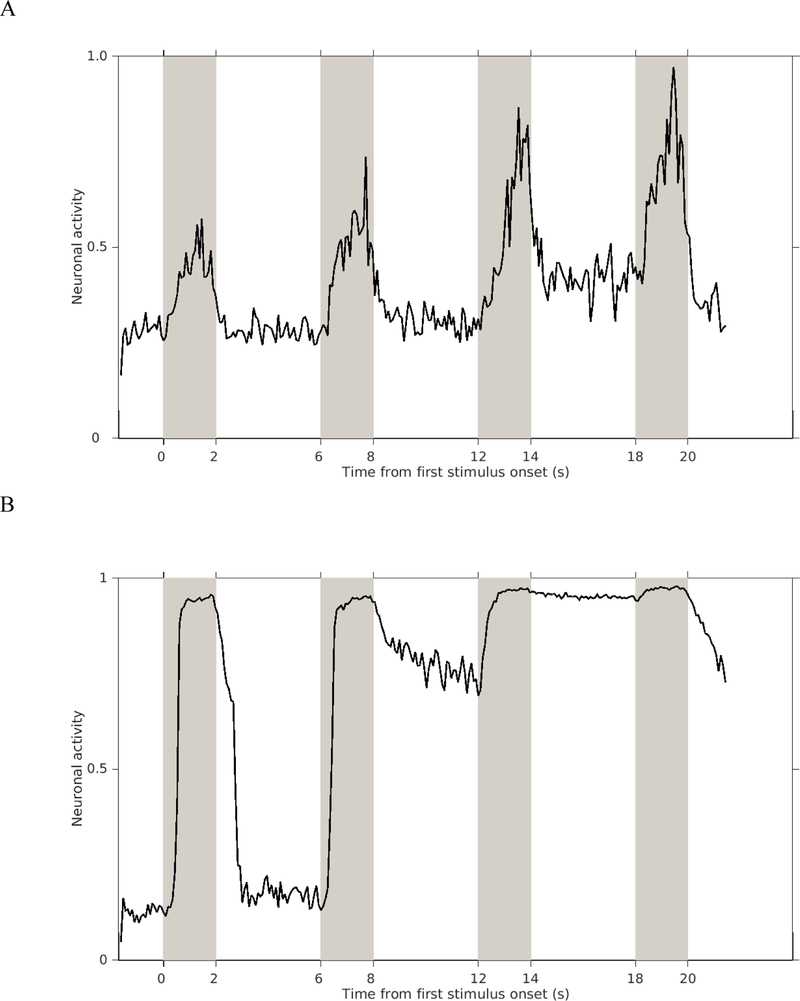
In simulating the holding of multiple items in short-term memory, one interesting finding related to the feedback from PFC to IT is that many simulated neurons in both PFC and IT displayed a progressive increase in activity level across the DMS trial with multiple distractors and the Sternberg task (Fig. 10). This type of behavior could not be observed once we removed the feedback from PFC to IT. We found neurons with climbing activity in both PFC and IT while monkey physiological studies have reported such activity only in PFC (Miller et al., 1996).
Fig. 10.
Simulated neurons with climbing activities during one trial of Sternberg’s task. A. Activity of one neuron found in the PFC module. B. Activity of one neuron found in the IT module. Each of the grey stripes indicates the presentation of one stimulus and the white stripes between the grey are delay periods.
5. Simulated fMRI BOLD signal
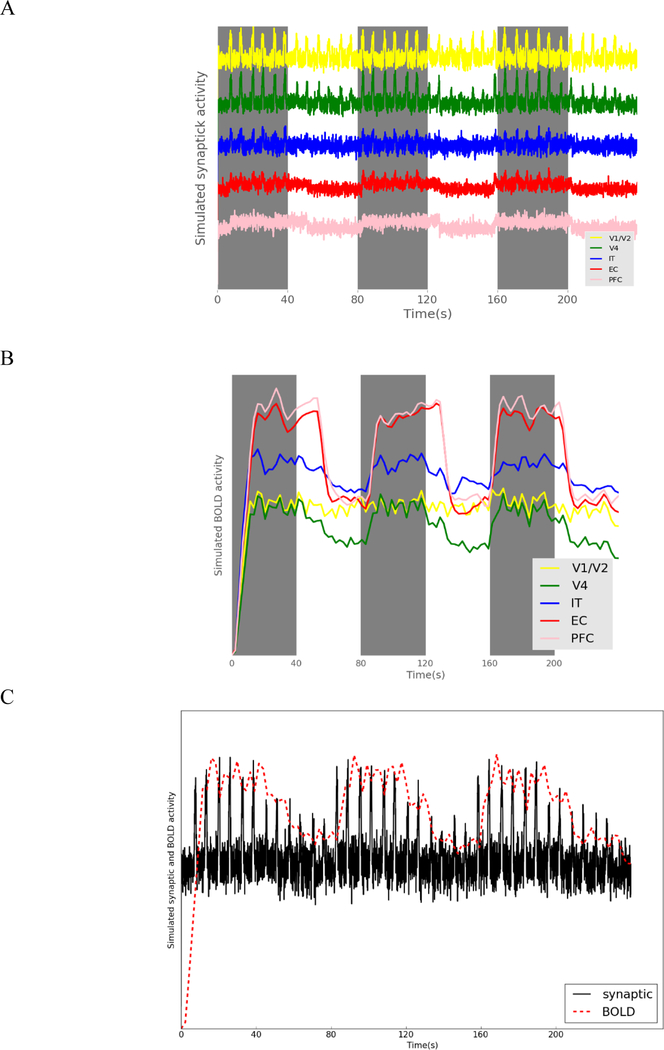
As discussed in the Methods section, we implemented an experiment that consisted of alternative blocks of DMS trials and control trials (passive viewing of degraded shapes), and then calculated the integrated synaptic activity and fMRI BOLD time series for select regions of interest (ROIs). Fig. 11A and Fig. 11B show the integrated synaptic activity and fMRI BOLD signal, respectively, for ROIs during three blocks of DMS task (grey) and three blocks of the control task (white). Each block consists of three trials. We can conclude from the figures that the modules of higher order show more signal change between the DMS and control tasks. Early visual cortex V1/V2 did not show much change between DMS trials and control trials, but higher order modules such as PFC module and entorhinal cortex module displayed much larger changes.
Fig. 11.
A simulated experiment with three blocks of alternative DMS trials (gray stripes) and control trials (white stripes) was implemented. Each block consisted of three trials. A. The integrated synaptic activity of different modules. B. The simulated fMRI BOLD signal of the different modules. Modules of higher order have larger difference in activity between the DMS and control tasks. C. A comparison of the simulated synaptic activity and the fMRI BOLD signal of the V4 module during the simulated experiment for one task and one control block.
Fig. 11C shows a comparison, using signals from V4 module as an example, between the integrated synaptic activity and fMRI BOLD signal. From the figure, we see that using such a block design, the simulated BOLD signal cannot isolate the detailed response profile for each stimulus, as is well known to the experimental research community.
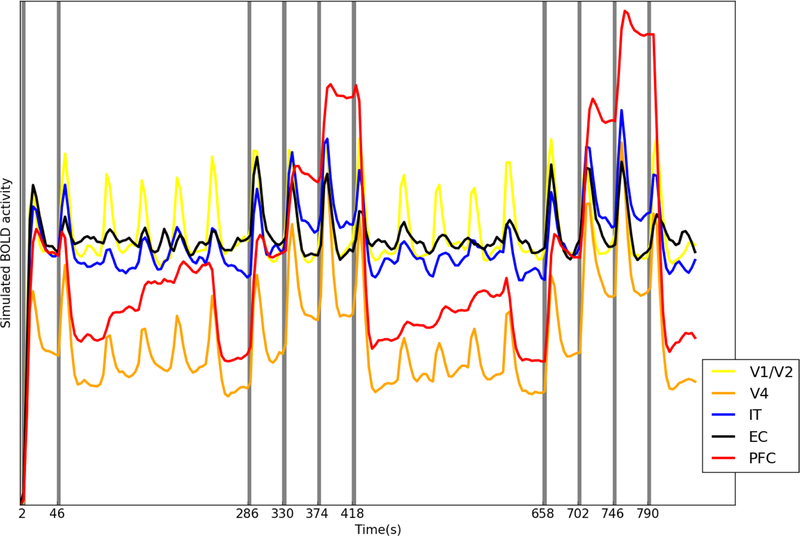
We also performed a simulated event-related experiment by extending the delay period to 20 seconds in order to show a more complete response curve in BOLD signal for each incoming stimulus. Fig. 12 shows the simulated fMRI BOLD signal for an event-related design that consists of a DMS trial, a DMS trial with two intervening distractors and a Sternberg’s task trial. The signal differences between these tasks and the control task (passive viewing of four stimuli separating each of the aforementioned tasks) were calculated and are shown in Table 4. By employing such a design, we could examine the effect of working memory load (by comparing the DMS task with the Sternberg task) and the effect of attention (by comparing the Sternberg’s task with the DMS task with distractors). The V1/V2 module (the yellow trace in Fig. 12) did not show statistically significant differences in terms of mean fMRI BOLD signals between the DMS tasks and the control tasks. We observed that the entorhinal cortex (black trace) displayed greater activity, compared with the control task, during encoding (stimuli presentations) and retrieval (probe presentations) but not during maintenance (delay periods), which is consistent with experimental findings (Schon, Quiroz, Hasselmo, & Stern, 2009). V4, IT and PFC showed increased activity during the delay periods, which indicated their roles in working memory maintenance. The activity of PFC increases when multiple items are stored, which agrees with the experimental evidence for both visual working memory (Cairo, Liddle, Woodward, & Ngan, 2004; Druzgal & D’Esposito, 2003; Rypma, Berger, & D’Esposito, 2002; Rypma & D’Esposito, 1999) and verbal working memory (Veltman, Rombouts, & Dolan, 2003). We also noticed the effect of working memory load for V4 and IT during encoding and maintenance (stimuli presentations and delay periods), but not during the retrieval phase (probe presentation).
Fig. 12.
The simulated fMRI BOLD signals of different modules of an event-related experiment. Each gray bar represents the presentation of a stimulus. The experiment consists of one DMS trial (first two gray bars), one DMS trial with two distractors (the middle four gray bars) and one trial of Sternberg’s task (the last four gray bars). Passive viewing of 4 stimuli separates each of these task trials. The V4 (orange), IT (blue), EC (black) and PFC (red) modules showed higher fMRI BOLD signals when the working memory load increased (DMS vs. Sternberg’s task).
Table 4.
The mean signal change (in percentage) of specific task from control task (passive viewing). Both integrated synaptic activity and fMRI data of different brain regions are shown. Paired t-test was used for the signal difference
| Integrated synaptic activity | fMRI | |||||
|---|---|---|---|---|---|---|
| DMS | DMS w/distractors | Sternberg’s task | DMS | DMS w/distractors | Sternberg’s task | |
| V1 | 6.533* | 5.318* | 8.702* | 2.739 | 1.841 | 3.028 |
| V4 | 25.786* | 27.861* | 29.250* | 23.034* | 25.548* | 26.947* |
| IT | 13.318* | 16.470* | 18.852* | 11.750* | 14.824* | 15.773* |
| EC | 8.161* | 8.803* | 10.182* | 5.709* | 8.871* | 9.098* |
| PFC | 25.083* | 28.915* | 32.594* | 20. 623* | 23.647* | 26.992* |
= p<0.05.
IV. Discussion
We have presented a simulation study of several short-term memory tasks using an extended version of a previously constructed large-scale neural model. A module representing the entorhinal cortex to serve as a gating module was added to process multiple items. We successfully implemented multiple short-term memory tasks using this extended model and produced neuronal patterns in visual cortex, IT, EC and PFC that match experimental findings. These short-term memory tasks can include distractor stimuli, or can require that multiple items be retained in mind during a delay period.
Fuster and Jervey (Fuster & Jervey, 1982) first revealed in primate single-unit recording studies that inferior temporal neurons exhibit sustained, increased activity during the short delay of a delay match-to-sample task. A number of later studies have also supported the notion that inferior temporal cortex is important for the maintenance of visual object information (Horel et al., 1987; Petrides, 2000; Ranganath & D’Esposito, 2005). The neuronal behaviors in IT across short delays in DMS trials were indicated to be relevant to object-selective activity and associative learning (Erickson & Desimone, 1999; Miller et al., 1993; Miyashita, 1988). The extended version of our large-scale neural model, compared to the original version, explicitly implements this critical role for IT, which will be important for extending our model to incorporate a long-term memory component.
Fuster and colleagues first reported the presence of PFC neurons with climbing activity across delay periods in DMS trials without distractors (Quintana & Fuster, 1992). Similar behavior was also observed in DMS trials with distractors (Miller et al., 1996). Fuster and colleagues interpreted the climbing activity as expectation. Our model doesn’t have expectation built-in; rather, our simulations suggest that the climbing activity is related to feedback from PFC to IT, i.e., a recurrent loop is formed with feedback from PFC to IT so that the information stored in PFC can strengthen itself through the loop, and it represents the working memory distributed in the network. These two notions of the neural mechanism for the observed climbing behavior may in fact complement one another.
We modeled working memory using the D1-D2 microcircuit as a fixed state. Meanwhile, the recurrent connectivity between PFC and IT in our model enables a network dependent mechanism of working memory represented by the “climbing neurons” we observed. There is experimental evidence for both views of working memory. Persistent activity of neurons in PFC was observed during the delay period by Funahashi et al. (1990), while some neuronal activity in PFC declined and was reactivated during the delay period (Barak, Tsodyks, & Romo, 2010; Rainer & Miller, 2002), indicating the existence of a dynamic mechanism for working memory.
In the simulations of DMS with distractors and the “ABBA” task, we assumed that the intervening distractors are also stored in the prefrontal cortex. Due to the low attention level applied, the storage of distractors is weaker than the storage of targets. Experimental studies in visual search and incidental learning supports our assumption that the distractors are stored in working memory (Goolsby, Shapiro, & Raymond, 2009; Williams, Henderson, & Zacks, 2005). We used separate working memory modules to handle distractors in the DMS task based on the fact that the attention paid to the distractors is lower than the target and the target has a special status in working memory that is not shared by the distractors (Peters, Goebel, & Roelfsema, 2009). The structural network of multiple working memory modules was inspired by a similar scheme proposed by Ulloa et al. in an auditory model that dealt with long-duration tonal patterns (Ulloa et al., 2008). The capacity limit of working memory is implemented by limiting the number of memory pools (we used three, but the number is arbitrary). Once the memory pools are all filled, further items will not be stored and the corresponding BOLD signal will reach a plateau. This was instantiated in our model for simplicity, but future research could aim toward determining whether or not this assumption is warranted.
Whereas the classic view is that working memory has a limited number of slots (Cowan, 2001), some recent experimental and modeling studies propose working memory as a continuous resource that is distributed among all remembered items (Bays & Husain, 2008; Fougnie, Suchow, & Alvarez, 2012; Keshvari, van den Berg, & Ma, 2013; for a review, see Ma, Husain, & Bays, 2014). According to this view, the precision of memory, which decreases as more items are remembered, is the key metric of working memory limits instead of the quantity of memory items. In our model, the working memory representations of different items are stored in non-overlapping PFC modules, which, in the future, could be integrated into one continuous module.
Even though we did not explicitly set out to incorporate a primacy and recency effect in our model, nonetheless, we observed such effects in our simulation results. In our model, the observed primacy effect in the Sternberg task was a result of decayed attention. In our simulated experimental design, the attention applied to the prefrontal area decays with time and higher attention helps the working memory network encoding for new items. The neural basis underlying the experimentally observed recency effect has been debated (Baddeley & Hitch, 1993). Based on our simulation, we suggest that the gating mechanism, specifically competitive inhibition and the inhibitory feedback from PFC to entorhinal cortex, may contribute to the recency effect. The inhibitory feedback from PFC to entorhinal area reduces the competition level among gating neurons; thus, later incoming stimuli have less inhibition and stronger representations in working memory. Previous experiments have shown that these effects are sensitive to the duration of the delay periods (Wright, 1999), which we have not observed in our simulation study, possibly due to a lack of a “forgetting” mechanism in the current version of the model.
Because working memory is such an important cognitive process, many research groups have developed models of this process. They range from purely cognitive models (Baddeley, 1992) to computational models of varying levels of complexity (e.g., Amit, Fusi, & Yakovlev, 1997; Ashby, Ell, Valentin, & Casale, 2005; Dehaene & Changeux, 1989; Rolls, Dempere-Marco, & Deco, 2013; for reviews, see Barak & Tsodyks, 2014; Durstewitz, Seamans, & Sejnowski, 2000; Maex & Steuber, 2009). Many computational models aimed to account for both behavioral and neural activity observed in monkey electrophysiological studies during the delay portion of a delayed response task. For instance, one approach, exemplified by Amit and colleagues (e.g., Amit et al., 1997) employed recurrent excitatory connections in a cell assembly to maintain stable activity patterns (i.e., attractors). In initial studies, Hebb-like learning methods were employed to generate synaptic weights that reinforced the connections between specific neurons. These attractor models initially dealt with maintaining in short-term memory one or more previously learned images. More recent work has extended these models so that novel images can also be handled (e.g., Amit, Yakovlev, & Hochstein, 2013). Although a number of modeling efforts addressing working memory have focused on the prefrontal cortex, a substantial number have also argued that the basal ganglia play an important role as well (e.g., Ashby et al., 2005; Monchi & Taylor, 1999). The modeling framework proposed by Ashby et al. (2005) is of particular interest because, like the model we presented in this paper, it also provides a distributed neurocomputational model that incorporates multiple, interacting brain regions, and aims to account for both neurophysiological data and behavioral data. Furthermore, the authors argue that this approach, like ours, also can account for human neuroimaging data (Ashby & Valentin, 2007).
The basal ganglia and the thalamus have been implicated in working memory function. Lesions of caudate and medial dorsal nuclei of the thalamus can severely impair working memory capacity (Kubat-Silman, Dagenbach, & Absher, 2002). However, as pointed out by Ashby et al. (2005), lesions of the caudate and medial dorsal nuclei of the thalamus can impair but will not abolish working memory, and this has been found experimentally (e.g., Gabrieli et al, 1996; Janahashi et al., 2002). It is worth noting that the examples used in this paper deal with a rather limited working memory capacity (i.e., no more than three objects).
The interactions between the PFC and the basal ganglia and the thalamus have also been interpreted as a gating mechanism (Braver & Cohen, 2000; Cohen, Braver, & O’Reilly, 1996; O’Reilly & Frank, 2006). For example, the O’Reilly-Frank working memory model incorporates a prefrontal cortex that controls both itself and other brain areas in a task-dependent manner. It does this by employing learning mechanisms that involve a number of subcortical structures including the basal ganglia that act as a gating mechanism for updating working memory. However, the EC is considered to be directly involved in the visual ventral (object) processing pathway and declarative memory encoding (Preston & Eichenbaum, 2013).
In the current paper, we chose parameters for the added components of the model so as to provide a reasonable match to the electrophysiological data, although we did not employ explicit model-fitting to any particular data set. As pointed out by Ashby et al. (2005), there is much variability between cells in monkey electrophysiological data, which may preclude quantitative data fitting. Moreover, another reason that explicit data-fitting was not employed was that there are numerous data sets (behavioral performance, electrophysiological data in multiple brain regions, fMRI activation and connectivity data, MEG/EEG data) that we want our model to account for. These data have different featural and temporal characteristics. It is not clear to us how in principle one should go about fitting all these data simultaneously. In fact, as far as the neuroimaging data is concerned, other researchers (e.g., Friston, Preller et al., in press) have just begun to develop a systematic approach to this problem.
Some caveats of our work include: the attention level and the top-down task control we used in the model are not realistically modeled; we hypothesized that the entorhinal cortex was responsible for a gating process, which needs to be confirmed by experiments; the locations we chose for prefrontal nodes (D1, D2, FS, R) in the Virtual Brain are somewhat arbitrary. We plan to address these caveats in future work, and extend the model to incorporate long-term memory and implement related cognitive tasks (e.g., paired associate task).
In summary, we have performed several short-term memory tasks using one large-scale neural network model and studied various neuronal behaviors in the inferotemporal cortex and prefrontal cortex. We modeled working memory with local microcircuits (D1, D2) and a large-scale recurrent network (PFC, IT), which produced neuronal behaviors that matched experimental findings. For generating a brain-like environment, we embedded the model into The Virtual Brain framework. The model in the future can be extended to incorporate more brain regions and functions, such as long-term memory. Our results indicate that computational modeling can be a powerful tool for interpreting human and nonhuman primate neuroimaging data.
Acknowledgements
The authors thank Dr. Paul Corbitt for useful discussions and John Gilbert with help with incorporating our model into The Virtual Brain framework. We also wish to thank Drs. Fatima Husain and Daniel Butts for comments on the manuscript. The research was supported by the NIH/NIDCD Intramural Research Program.
References:
- Amit DJ, Fusi S, & Yakovlev V (1997). Paradigmatic working memory (attractor) cell in IT cortex. Neural Comput, 9(5), 1071–1092. [DOI] [PubMed] [Google Scholar]
- Amit Y, Yakovlev V, & Hochstein S (2013). Modeling behavior in different delay match to sample tasks in one simple network. Front Hum Neurosci, 7, 408. [DOI] [PMC free article] [PubMed] [Google Scholar]
- Ashby FG, Ell SW, Valentin VV, & Casale MB (2005). FROST: a distributed neurocomputational model of working memory maintenance. J Cogn Neurosci, 17(11), 1728–1743. [DOI] [PubMed] [Google Scholar]
- Ashby FG, & Valentin VV (2007). Computational Cognitive Neuroscience: Building and Testing Biologically Plausible Computational Models of Neuroscience, Neuroimaging, and Behavioral Data. In M. J. S. Wenger C (Ed.), Statistical and Process Models for Cognitive Neuroscience and Aging (pp. 15–58). Mahwah, NJ: Erlbaum. [Google Scholar]
- Baddeley A (1992). Working Memory: The Interface between Memory and Cognition. J Cogn Neurosci, 4(3), 281–288. [DOI] [PubMed] [Google Scholar]
- Baddeley AD, & Hitch G (1993). The recency effect: implicit learning with explicit retrieval? Mem Cognit, 21(2), 146–155. [DOI] [PubMed] [Google Scholar]
- Barak O, & Tsodyks M (2014). Working models of working memory. Curr Opin Neurobiol, 25, 20–24. [DOI] [PubMed] [Google Scholar]
- Barak O, Tsodyks M, & Romo R (2010). Neuronal population coding of parametric working memory. J Neurosci, 30(28), 9424–9430. [DOI] [PMC free article] [PubMed] [Google Scholar]
- Bays PM, & Husain M (2008). Dynamic shifts of limited working memory resources in human vision. Science, 321(5890), 851–854. [DOI] [PMC free article] [PubMed] [Google Scholar]
- Braver TS, & Cohen JD (2000). On the control of control: The role of dopamine in regulating prefrontal function and working memory. In Monsell S & Driver J (Eds.), Control of cognitive processes: Attention and performance (Vol. XVIII, pp. 713–737). Cambridge, MA: MIT Press. [Google Scholar]
- Cairo TA, Liddle PF, Woodward TS, & Ngan ET (2004). The influence of working memory load on phase specific patterns of cortical activity. Brain Res Cogn Brain Res, 21(3), 377–387. [DOI] [PubMed] [Google Scholar]
- Chaudhuri R, Knoblauch K, Gariel MA, Kennedy H, & Wang XJ (2015). A Large-Scale Circuit Mechanism for Hierarchical Dynamical Processing in the Primate Cortex. Neuron, 88(2), 419–431. [DOI] [PMC free article] [PubMed] [Google Scholar]
- Cohen JD, Braver TS, & O’Reilly RC (1996). A computational approach to prefrontal cortex, cognitive control and schizophrenia: recent developments and current challenges. Philos Trans R Soc Lond B Biol Sci, 351(1346), 1515–1527. [DOI] [PubMed] [Google Scholar]
- Corchs S, & Deco G (2002). Large-scale neural model for visual attention: integration of experimental single-cell and fMRI data. Cereb Cortex, 12(4), 339–348. [DOI] [PubMed] [Google Scholar]
- Courtney SM, Petit L, Maisog JM, Ungerleider LG, & Haxby JV (1998). An area specialized for spatial working memory in human frontal cortex. Science, 279(5355), 1347–1351. [DOI] [PubMed] [Google Scholar]
- Cowan N (2001) The magic number 4 in short-term memory: a reconsideration of mental storage capacity. Beh Brain Sci, 24, 87–114. [DOI] [PubMed] [Google Scholar]
- D’Esposito M, Detre JA, Alsop DC, Shin RK, Atlas S, & Grossman M (1995). The neural basis of the central executive system of working memory. Nature, 378(6554), 279–281. [DOI] [PubMed] [Google Scholar]
- Dehaene S, & Changeux JP (1989). A simple model of prefrontal cortex function in delayed-response tasks. J Cogn Neurosci, 1(3), 244–261. [DOI] [PubMed] [Google Scholar]
- Desimone R, & Schein SJ (1987). Visual properties of neurons in area V4 of the macaque: sensitivity to stimulus form. J Neurophysiol, 57(3), 835–868. [DOI] [PubMed] [Google Scholar]
- Druzgal TJ, & D’Esposito M (2003). Dissecting contributions of prefrontal cortex and fusiform face area to face working memory. J Cogn Neurosci, 15(6), 771–784. [DOI] [PubMed] [Google Scholar]
- Durstewitz D, Seamans JK, & Sejnowski TJ (2000). Neurocomputational models of working memory. Nat Neurosci, 3 Suppl, 1184–1191. [DOI] [PubMed] [Google Scholar]
- Erickson CA, & Desimone R (1999). Responses of macaque perirhinal neurons during and after visual stimulus association learning. J Neurosci, 19(23), 10404–10416. [DOI] [PMC free article] [PubMed] [Google Scholar]
- Fougnie D, Suchow JW, & Alvarez GA (2012). Variability in the quality of visual working memory. Nat Commun, 3, 1229. [DOI] [PMC free article] [PubMed] [Google Scholar]
- Friston KJ, Preller KH, Mathys C, Cagnan H, Heinzle J, Razi A, & Zeidman P (in press). Dynamic causal modelling revisited. Neuroimage [DOI] [PMC free article] [PubMed]
- Funahashi S, Bruce CJ, & Goldman-Rakic PS (1989). Mnemonic coding of visual space in the monkey’s dorsolateral prefrontal cortex. J Neurophysiol, 61(2), 331–349. [DOI] [PubMed] [Google Scholar]
- Funahashi S, Bruce CJ, & Goldman-Rakic PS (1990). Visuospatial coding in primate prefrontal neurons revealed by oculomotor paradigms. J Neurophysiol, 63(4), 814–831. [DOI] [PubMed] [Google Scholar]
- Funahashi S, Inoue M, & Kubota K (1993). Delay-related activity in the primate prefrontal cortex during sequential reaching tasks with delay. Neurosci Res, 18(2), 171–175. [DOI] [PubMed] [Google Scholar]
- Fuster J, Bauer R, & Jervey J (1982). Cellular Discharge in the Dorsolateral Prefrontal Cortex of the Monkey in Cognitive Tasks. Experimental Neurology, 77, 679–694. [DOI] [PubMed] [Google Scholar]
- Fuster JM, & Alexander GE (1971). Neuron activity related to short-term memory. Science, 173(3997), 652–654. [DOI] [PubMed] [Google Scholar]
- Fuster JM, & Alexander GE (1973). Firing changes in cells of the nucleus medialis dorsalis associated with delayed response behavior. Brain Res, 61, 79–91. [DOI] [PubMed] [Google Scholar]
- Fuster JM, & Jervey JP (1982). Neuronal firing in the inferotemporal cortex of the monkey in a visual memory task. J Neurosci, 2(3), 361–375. [DOI] [PMC free article] [PubMed] [Google Scholar]
- Gabrieli JD, Singh J, Stebbins GT, & Goetz CG (1996). Reduced working memory span in Parkinson’s disease: Evidence of the role of a frontostriatal system in working and strategic memory. Neuropsychology, 10, 322–332. [Google Scholar]
- Gallant JL, Braun J, & Van Essen DC (1993). Selectivity for polar, hyperbolic, and Cartesian gratings in macaque visual cortex. Science, 259(5091), 100–103. [DOI] [PubMed] [Google Scholar]
- Garagnani M, Wennekers T, & Pulvermuller F (2008). A neuroanatomically grounded Hebbian-learning model of attention-language interactions in the human brain. Eur J Neurosci, 27(2), 492–513. [DOI] [PMC free article] [PubMed] [Google Scholar]
- Gisiger T, & Kerszberg M (2006). A model for integrating elementary neural functions into delayed-response behavior. PLoS Comput Biol, 2(4), e25. [DOI] [PMC free article] [PubMed] [Google Scholar]
- Goolsby BA, Shapiro KL, & Raymond JE (2009). Distractor devaluation requires visual working memory. Psychon Bull Rev, 16(1), 133–138. [DOI] [PubMed] [Google Scholar]
- Hagmann P, Cammoun L, Gigandet X, Meuli R, Honey CJ, Wedeen VJ, et al. (2008). Mapping the structural core of human cerebral cortex. PLoS Biol, 6(7), e159. [DOI] [PMC free article] [PubMed] [Google Scholar]
- Haxby J, Ungerleider L, Horwitz B, Rapoport S, & Grady C (1995). Hemispheric differences in neural systems for face working memory: a PET-rCBF study. Hum Brain Mapp, 3, 68–82. [Google Scholar]
- Haxby JV, Grady CL, Horwitz B, Ungerleider LG, Mishkin M, Carson RE, et al. (1991). Dissociation of object and spatial visual processing pathways in human extrastriate cortex. Proc Natl Acad Sci U S A, 88(5), 1621–1625. [DOI] [PMC free article] [PubMed] [Google Scholar]
- Horel JA, Pytko-Joiner DE, Voytko ML, & Salsbury K (1987). The performance of visual tasks while segments of the inferotemporal cortex are suppressed by cold. Behav Brain Res, 23(1), 29–42. [DOI] [PubMed] [Google Scholar]
- Horwitz B, & Banerjee A (2012). A role for neural modeling in the study of brain disorders. Front Syst Neurosci, 6, 57. [DOI] [PMC free article] [PubMed] [Google Scholar]
- Horwitz B, & Tagamets MA (1999). Predicting human functional maps with neural net modeling. Hum Brain Mapp, 8(2–3), 137–142. [DOI] [PMC free article] [PubMed] [Google Scholar]
- Hubel DH, Wiesel TN, & Stryker MP (1977). Orientation columns in macaque monkey visual cortex demonstrated by the 2-deoxyglucose autoradiographic technique. Nature, 269(5626), 328–330. [DOI] [PubMed] [Google Scholar]
- Husain FT, Nandipati G, Braun AR, Cohen LG, Tagamets MA, & Horwitz B (2002). Simulating transcranial magnetic stimulation during PET with a large-scale neural network model of the prefrontal cortex and the visual system. Neuroimage, 15(1), 58–73. [DOI] [PubMed] [Google Scholar]
- Husain FT, Tagamets MA, Fromm SJ, Braun AR, & Horwitz B (2004). Relating neuronal dynamics for auditory object processing to neuroimaging activity: a computational modeling and an fMRI study. Neuroimage, 21(4), 1701–1720. [DOI] [PubMed] [Google Scholar]
- Janahashi M, Rowe J, Saleem T, Brown R, Limousin-Dowsey P, Rothwell J, Thomas D, & Quinn N (2002). Striatal contribution to cognition: Working memory and executive function in Parkinson’s Disease before and after unilateral posteroventral pallidotomy. J. Cogn. Neurosci, 14, 298–310. [DOI] [PubMed] [Google Scholar]
- Keshvari S, van den Berg R, & Ma WJ (2013). No evidence for an item limit in change detection. PLoS Comput Biol, 9(2), e1002927. [DOI] [PMC free article] [PubMed] [Google Scholar]
- Kim J, & Horwitz B (2009). How well does structural equation modeling reveal abnormal brain anatomical connections? An fMRI simulation study. Neuroimage, 45(4), 1190–1198. [DOI] [PMC free article] [PubMed] [Google Scholar]
- Kubat-Silman AK, Dagenbach D, & Absher JR (2002). Patterns of impaired verbal, spatial, and object working memory after thalamic lesions. Brain Cogn, 50(2), 178–193. [DOI] [PubMed] [Google Scholar]
- Kubota K, & Niki H (1971). Prefrontal cortical unit activity and delayed alternation performance in monkeys. J Neurophysiol, 34(3), 337–347. [DOI] [PubMed] [Google Scholar]
- Lech RK, & Suchan B (2014). Involvement of the human medial temporal lobe in a visual discrimination task. Behav Brain Res, 268, 22–30. [DOI] [PubMed] [Google Scholar]
- Levy R, & Goldman-Rakic PS (1999). Association of storage and processing functions in the dorsolateral prefrontal cortex of the nonhuman primate. J Neurosci, 19(12), 5149–5158. [DOI] [PMC free article] [PubMed] [Google Scholar]
- Ma WJ, Husain M, & Bays PM (2014). Changing concepts of working memory. Nat Neurosci, 17(3), 347–356. [DOI] [PMC free article] [PubMed] [Google Scholar]
- Maex R, & Steuber V (2009). The first second: models of short-term memory traces in the brain. Neural Netw, 22(8), 1105–1112. [DOI] [PubMed] [Google Scholar]
- Miller EK, Erickson CA, & Desimone R (1996). Neural mechanisms of visual working memory in prefrontal cortex of the macaque. J Neurosci, 16(16), 5154–5167. [DOI] [PMC free article] [PubMed] [Google Scholar]
- Miller EK, Gochin PM, & Gross CG (1993). Suppression of visual responses of neurons in inferior temporal cortex of the awake macaque by addition of a second stimulus. Brain Res, 616(1–2), 25–29. [DOI] [PubMed] [Google Scholar]
- Miller GA (1956). The magical number seven plus or minus two: some limits on our capacity for processing information. Psychol Rev, 63(2), 81–97. [PubMed] [Google Scholar]
- Mishkin M, & Ungerleider LG (1982). Contribution of striate inputs to the visuospatial functions of parieto-preoccipital cortex in monkeys. Behav Brain Res, 6(1), 57–77. [DOI] [PubMed] [Google Scholar]
- Miyashita Y (1988). Neuronal correlate of visual associative long-term memory in the primate temporal cortex. Nature, 335(6193), 817–820. [DOI] [PubMed] [Google Scholar]
- Monchi O, & Taylor JG (1999). A hard wired model of coupled frontal working memories for various tasks. Information Sciences, 113(1999), 221–243. [Google Scholar]
- Navawongse R, & Eichenbaum H (2013). Distinct pathways for rule-based retrieval and spatial mapping of memory representations in hippocampal neurons. J Neurosci, 33(3), 1002–1013. [DOI] [PMC free article] [PubMed] [Google Scholar]
- O’Reilly RC, & Frank MJ (2006). Making working memory work: a computational model of learning in the prefrontal cortex and basal ganglia. Neural Comput, 18(2), 283–328. [DOI] [PubMed] [Google Scholar]
- Peterhans E, & von der Heydt R (1993). Functional organization of area V2 in the alert macaque. Eur J Neurosci, 5(5), 509–524. [DOI] [PubMed] [Google Scholar]
- Peters JC, Goebel R, & Roelfsema PR (2009). Remembered but unused: the accessory items in working memory that do not guide attention. J Cogn Neurosci, 21(6), 1081–1091. [DOI] [PubMed] [Google Scholar]
- Petrides M (2000). Dissociable roles of mid-dorsolateral prefrontal and anterior inferotemporal cortex in visual working memory. J Neurosci, 20(19), 7496–7503. [DOI] [PMC free article] [PubMed] [Google Scholar]
- Preston AR, & Eichenbaum H (2013). Interplay of hippocampus and prefrontal cortex in memory. Curr Biol, 23(17), R764–773. [DOI] [PMC free article] [PubMed] [Google Scholar]
- Quintana J, & Fuster JM (1992). Mnemonic and predictive functions of cortical neurons in a memory task. Neuroreport, 3(8), 721–724. [DOI] [PubMed] [Google Scholar]
- Rainer G, & Miller EK (2002). Timecourse of object-related neural activity in the primate prefrontal cortex during a short-term memory task. Eur J Neurosci, 15(7), 1244–1254. [DOI] [PubMed] [Google Scholar]
- Ranganath C, & D’Esposito M (2005). Directing the mind’s eye: prefrontal, inferior and medial temporal mechanisms for visual working memory. Curr Opin Neurobiol, 15(2), 175–182. [DOI] [PubMed] [Google Scholar]
- Riley MR, & Constantinidis C (2015). Role of Prefrontal Persistent Activity in Working Memory. Front Syst Neurosci, 9, 181. [DOI] [PMC free article] [PubMed] [Google Scholar]
- Roe AW, & Ts’o DY (1995). Visual topography in primate V2: multiple representation across functional stripes. J Neurosci, 15(5 Pt 2), 3689–3715. [DOI] [PMC free article] [PubMed] [Google Scholar]
- Rolls ET, Dempere-Marco L, & Deco G (2013). Holding multiple items in short term memory: a neural mechanism. PLoS One, 8(4), e61078. [DOI] [PMC free article] [PubMed] [Google Scholar]
- Rypma B, Berger JS, & D’Esposito M (2002). The influence of working-memory demand and subject performance on prefrontal cortical activity. J Cogn Neurosci, 14(5), 721–731. [DOI] [PubMed] [Google Scholar]
- Rypma B, & D’Esposito M (1999). The roles of prefrontal brain regions in components of working memory: effects of memory load and individual differences. Proc Natl Acad Sci U S A, 96(11), 6558–6563. [DOI] [PMC free article] [PubMed] [Google Scholar]
- Saleem KS, & Tanaka K (1996). Divergent projections from the anterior inferotemporal area TE to the perirhinal and entorhinal cortices in the macaque monkey. J Neurosci, 16(15), 4757–4775. [DOI] [PMC free article] [PubMed] [Google Scholar]
- Sanz Leon P, Knock SA, Woodman MM, Domide L, Mersmann J, McIntosh AR, et al. (2013). The Virtual Brain: a simulator of primate brain network dynamics. Front Neuroinform, 7, 10. [DOI] [PMC free article] [PubMed] [Google Scholar]
- Schon K, Quiroz YT, Hasselmo ME, & Stern CE (2009). Greater working memory load results in greater medial temporal activity at retrieval. Cereb Cortex, 19(11), 2561–2571. [DOI] [PMC free article] [PubMed] [Google Scholar]
- Schon K, Ross RS, Hasselmo ME, & Stern CE (2013). Complementary roles of medial temporal lobes and mid-dorsolateral prefrontal cortex for working memory for novel and familiar trial-unique visual stimuli. Eur J Neurosci, 37(4), 668–678. [DOI] [PubMed] [Google Scholar]
- Stephan KE, Weiskopf N, Drysdale PM, Robinson PA, & Friston KJ (2007). Comparing hemodynamic models with DCM. Neuroimage, 38(3), 387–401. [DOI] [PMC free article] [PubMed] [Google Scholar]
- Sternberg S (1966). High-speed scanning in human memory. Science, 153(3736), 652–654. [DOI] [PubMed] [Google Scholar]
- Sternberg S (1969). Memory-scanning: mental processes revealed by reaction-time experiments. Am Sci, 57(4), 421–457. [PubMed] [Google Scholar]
- Tagamets MA, & Horwitz B (1998). Integrating electrophysiological and anatomical experimental data to create a large-scale model that simulates a delayed match-to-sample human brain imaging study. Cereb Cortex, 8(4), 310–320. [DOI] [PubMed] [Google Scholar]
- Talairach J, Tournoux P (1988). Co-Planar Stereotaxic Atlas of the Human Brain New York: Thieme Medial Publishers, Inc. [Google Scholar]
- Ulloa A, & Horwitz B (2016). Embedding task-based neural models into a connectome-based model of the cerebral cortex. Frontiers in Neuroinformatics, 10, 32. [DOI] [PMC free article] [PubMed] [Google Scholar]
- Ulloa A, Husain FT, Kemeny S, Xu J, Braun AR, & Horwitz B (2008). Neural mechanisms of auditory discrimination of long-duration tonal patterns: a neural modeling and fMRI study. Journal of integrative neuroscience, 7(04), 501–527. [DOI] [PMC free article] [PubMed] [Google Scholar]
- Veltman DJ, Rombouts SA, & Dolan RJ (2003). Maintenance versus manipulation in verbal working memory revisited: an fMRI study. Neuroimage, 18(2), 247–256. [DOI] [PubMed] [Google Scholar]
- Williams CC, Henderson JM, & Zacks RT (2005). Incidental visual memory for targets and distractors in visual search. Percept Psychophys, 67(5), 816–827. [DOI] [PMC free article] [PubMed] [Google Scholar]
- Wilson HR, & Cowan JD (1972). Excitatory and inhibitory interactions in localized populations of model neurons. Biophys J, 12(1), 1–24. [DOI] [PMC free article] [PubMed] [Google Scholar]
- Wright AA (1999). Auditory list memory and interference processes in monkeys. J Exp Psychol Anim Behav Process, 25(3), 284–296. [PubMed] [Google Scholar]


