

Abstract
Introduction:
we sought to determine the relative velocity sensitivity of stretch reflex threshold angle and reflex stiffness during stretches of the paretic elbow joint in individuals with chronic hemiparetic stroke, and to provide guidelines to streamline spasticity assessments.
Methods:
we applied ramp-and-hold elbow extension perturbations ranging from 15-150°/s over the full range of motion in 13 individuals with hemiparesis. After accounting for the effects of passive mechanical resistance, we modeled velocity-dependent reflex threshold angle and torque-angle slope to determine their correlation with overall resistance to movement.
Results:
Reflex stiffness exhibited substantially greater velocity sensitivity than threshold angle, accounting for ~74% (vs. ~15%) of the overall velocity-dependent increases in movement resistance.
Discussion:
Reflex stiffness is a sensitive descriptor of the overall velocity dependence of movement resistance in spasticity. Clinical spasticity assessments can be streamlined by using torque-angle slope, a measure of reflex stiffness, as their primary outcome measure, particularly at stretch velocities greater than 100°/s.
Keywords: Spasticity, stretch reflex, movement resistance, joint torque, threshold angle, stroke
INTRODUCTION
Spasticity is classically defined as a velocity-dependent increase in resistance to imposed movement, indicative of an exaggerated stretch reflex in elongating muscles (Lance 1980b). Although the impact of spasticity on the overall post-stroke movement disorder has increasingly been questioned (Burne et al. 2005; Ellis et al. 2017; McPherson et al. 2017; Sommerfeld et al. 2004), the degree of stretch reflex exaggeration is nevertheless a readily observable marker of spinal motoneuron excitability. Presumably, altered stretch reflex excitability stems from a subset of the same neural substrates that contribute to other, more functionally limiting, components of the post-stroke motor impairment sequelae (e.g., flexion synergy expression; (Brunnstrom 1966; Dewald et al. 1995; Ellis et al. 2008; Sukal et al. 2007)). Thus, stretch reflex excitability could continue to be a useful clinical tool, particularly when viewed as a means to gauge the impact of rehabilitation interventions on spinal sensorimotor integration itself (in addition to being used as a potential marker of functional impairment). This is likely to become increasingly important as new pharmacological treatments arise that directly target endogenous neuromodulatory pathways and spinal motoneuron excitability.
To meet the demands of this purpose, the precision of stretch reflex assessments must be substantially improved over current clinical standards. Indeed, the Ashworth/Modified Ashworth Scale – long the clinical standard – is poorly correlated both with neuromechanical and biophysical measures of stretch reflex excitability (Alibiglou et al. 2008; Bakheit et al. 2003; Bhadane et al. 2015; Calota et al. 2008; de Vlugt et al. 2010; Naghdi et al. 2008). A full characterization of stretch reflex excitability is infeasible in the clinical and/or clinical research settings. It requires quantitative measures of the angle of reflex initiation (also known as the threshold angle) and reflex stiffness during imposed excursions, both at a range of velocities. However, if either the threshold angle or reflex stiffness alone is capable of adequately describing the reflex behavior across velocities, then assessments could be directed to that specific feature of the reflex response – minimizing the additional time required for examination over current clinical standards while increasing the precision of measurement.
Here, we systematically probe the proportion of reflex-driven movement resistance mathematically accounted for by reflex threshold angle and reflex stiffness in the contralesional elbow flexors of individuals with chronic unilateral brain injury. The contralesional elbow flexors are implicated in a variety of functional impairments arising from changes in spinal motor excitability, including flexion synergy expression and spasticity (Ellis et al. 2017; Jin and Zhao 2018; McPherson et al. 2018a; McPherson et al. 2018b; Sommerfeld et al. 2012). We balance the competing needs of efficient implementation and high precision by using a clinically available mechatronic device and biomechanical measures of the stretch reflex response. The choice of biomechanical (rather than electromyographic) outcome measures supports the goal of increased efficiency primarily because placement and analysis of electrodes requires more time than a purely biomechanical assessment, limiting its translation to clinical settings. Biomechanical outcome measures also retain high precision when extracted using mechatronic devices and afford multiple options for reflex response parameterization.
Our primary finding was that increases in reflex stiffness mathematically account for a significantly greater proportion of the overall movement resistance during elbow extension than do reductions in reflex threshold angle. Across all participants and changes in velocity, increased reflex stiffness explained an average of 74% of the increases in movement resistance associated with increased stretch velocity compared to only 15% for threshold angle. These findings indicate that reflex stiffness provides a more sensitive means of inferring spinal motor excitability in the paretic elbow flexors than reflex threshold angle. Because reflex stiffness accounts for the majority of changes in movement resistance across all velocities, these findings also suggest that reflex stiffness alone may be sufficiently sensitive to be used alone as a primary outcome measure in the paretic elbow flexors when speed of assessment is a priority. The experimental protocol described here could also be extended to joints with different neural, biomechanical, and functional properties to determine whether reflex stiffness and reflex threshold angle continue to exhibit differential velocity-sensitivity and whether either parameter can serve as a standalone marker of spinal motor excitability.
METHODS
Participants
Thirteen individuals with unilateral brain injury participated this study. Participants were examined by J.P.A.D. to verify their admissibility into the study using the following inclusion criteria: hemiparesis with motor impairment of the upper limb, absence of sensory, proprioceptive, and muscle tone abnormalities in the non-paretic upper limb, absence of severe wasting or contracture in the paretic upper limb, absence of significant cognitive or affective impairments, lack of significant concurrent medical problems (e.g., cardiorespiratory impairment), no current use of anti-spastic medications, and capacity to provide informed consent.
Motor function of the paretic upper extremity was evaluated with a protocol first described by Brunnstrom (Brunnstrom 1966) and further elaborated by Fugl-Meyer and colleagues (Fugl-Meyer et al. 1975). This assessment evaluated muscle tone (including passive and active range of motion and tendon reflexes), as well as the ability of the participant to perform movements within and outside of the pathological stereotypic movement patterns. Cumulative upper extremity scores on the Fugl-Meyer motor assessment approaching 60 or more of a total of 66 are commonly considered to indicate mild involvement, whereas scores less than 20 indicate severe impairment (Velozo and Woodbury 2011). Participants had mild to severe levels of spasticity as assessed by the Ashworth scale, with scores ranging from 1 to 4 (out of 4) for the elbow flexors (Ashworth 1964). The results of these assessments are given in Table 1. All experimental procedures were approved by the Institutional Review Board of Northwestern University and complied with the principles of the Declaration of Helsinki. Informed consent was obtained prior to each experimental session.
Table 1:
Description of Study Participants
| Particinant ID |
Type of Injury |
Affected Arm |
Ashworth* | Fugl- Meyer† |
Time post- injury (yr) |
Age |
|---|---|---|---|---|---|---|
| A | Stroke | Right | 2 | 58 | 5 | 41 |
| B | Stroke | Left | 2 | 16 | 3 | 64 |
| C | Stroke | Left | 2 | 21 | 5 | 66 |
| D | TBI‡ | Left | 3 | 18 | 18 | 48 |
| E | Stroke | Left | 2 | 27 | 3 | 58 |
| F | Stroke | Left | 3 | 12 | 13 | 61 |
| G | Stroke | Right | 3 | 17 | 3 | 53 |
| H | Stroke | Left | 2 | 25 | 3 | 53 |
| I | Stroke | Right | 1 | 40 | 4 | 55 |
| J | Stroke | Right | 4 | 17 | 9 | 58 |
| K | TBI‡ | Right | 4 | 14 | 8 | 27 |
| L | Stroke | Left | 4 | 15 | 14 | 57 |
| M | Stroke | Right | 2 | 51 | 4 | 61 |
Four point Ashworth Scale;
sixty-six point upper extremity motor function score;
TBI: traumatic brain injury.
Experimental Protocol
The experimental apparatus and participant preparation used in this study have been described previously (Schmit et al. 1999). Briefly, a Biodex Rehabilitation/Testing System 2 (Biodex Medical Systems, Inc, Shirley, NY; hereafter referred to as Biodex) device was used to impose elbow flexion/extension ramp stretches that contained a constant angular velocity portion. The hand and wrist were casted and fixed to a manipulandum extending from the Biodex motor axis (Figure 1). The center of rotation of the elbow was aligned with that of the Biodex motor. The motor position was adjusted to achieve a shoulder abduction angle of 80° and shoulder flexion of 3-10°. With full elbow extension defined as 180°, minimum elbow angles ranged from 47-55° while maximums were 130-157°. The variation in angles was due to inter-subject variations in ROM and arm size. After being interfaced with the Biodex device, a series of ~30 passive elbow flexion/extension stretches (6°/s, full ROM) were delivered to the relaxed arm to ensure that reflex responses would be stable without substantial adaptation effects during subsequent reflex quantification procedures (Schmit et al. 2000).
Fig. 1.

Experimental setup. Left panel: Participant’s limb interfaced with Biodex device; elbow axis of rotation centered over the axis of the Biodex motor. The hand and wrist are casted, providing a rigid point of attachment to the motor axis. EMGs were recorded to validate the assumption of inactive muscles during slow stretches. Right panel: example of stretch perturbation profile for a 100° excursion at 60°/s from flexion to extension, followed by a 10 second hold and a return to the original limb configuration
Building on recent work (Condliffe et al. 2005; McPherson et al. 2011; McPherson et al. 2017), we chose to use larger displacement stretches (~90 degrees) than are traditionally used with ramp-and-hold (Powers et al. 1989; Powers et al. 1988; Thilmann et al. 1991), pseudo-random binary (Ludvig et al. 2011; Mirbagheri et al. 2012), or multi-sine perturbations (Forbes et al. 2011; Ludvig et al. 2011; Mirbagheri et al. 2012). The choice of large displacement ramp-and-hold stretches facilitates clinical translation because it most closely mirrors current clinical examinations in terms of the stretch profile (e.g., Ashworth, Tardieu), it does not require reprogramming of commercially available mechatronic devices, it does not require use of advanced system identification techniques or applied mathematics to compute reflex-related parameters (as do pseudo-random binary and multisine perturbations), and it ensures a sufficient angular range over which to exceed the threshold angle and estimate reflex stiffness.
Each elbow perturbation sequence consisted of a constant velocity stretch of the elbow flexors, a 10 second pause and a return to the starting position using constant velocity stretch of elbow extensors (Figure 1). The cycle was repeated every 60 seconds. Ten angular stretch velocities were tested: 6, 15, 30, 45, 60, 75, 90, 105, 120 and 150°/s, with five trials conducted at each velocity. All stretches were performed with the limb in a relaxed state, and participants were asked not to intervene during the execution of the ramp stretches. If excessive postural or contralateral upper limb movements, yawning or coughing occurred during a trial, it was not included in subsequent analyses. Five test epochs, each consisting of one trial per test velocity, were applied sequentially. Within each epoch, stretch velocities were tested in a random order. This procedure was implemented to eliminate any bias associated with the order in which stretch velocities were applied (Schmit et al. 2000).
Surface electromyographic (EMG) recordings were made of the biceps, the brachioradialis and the lateral head of the triceps. Electrodes (Conmed, Diagnostic 1700-003) were placed on lightly abraded skin with the sensor directly over on the muscle belly, approximately halfway between the origin and insertion and approximately halfway medio-lateral. Electrode contacts were oriented perpendicular to the primary muscle fiber direction. Electrode leads were connected to an isolated, differential preamplifier/filter, the signal was band pass filtered at 10-500 Hz and pre-amplified by 1000. Further amplification of 1-50, depending on the signal amplitude, was performed prior to digitizing the data.
Analysis
Given the generally higher prevalence of reflex hyperexcitability in the elbow flexors compared to the elbow extensors post-stroke, the analyses and results presented herein focus on elbow flexor stretch reflexes. The overall resistance to a single imposed stretch – that is, the net elbow torque recorded by the Biodex – contained inertial, viscous, and stiffness components whose contribution to the total resistance was dependent upon a given stretch profile. For the fully passive limb, the total resistance to movement has traditionally been modeled with a second-order rigid body equation of motion such as the following (Bennett et al. 1992; de Vlugt et al. 2001; Halaki et al. 2006; Kearney et al. 1997; Lambertz et al. 2003; Perreault et al. 2000; Zhang and Rymer 1997):
where τ is net torque, t is time, ϕ is elbow angle, I is inertia, B is viscosity, and K is passive stiffness. In stretches that elicit a reflex, the net torque also contains an active resistance component, and thus the torque-angle relationship can be described as follows (Koo and Mak 2006; Lindberg et al. 2011):
where the net resistance to movement (τNet) is the sum of passive inertial (τI, passive), viscous (τB, passive), and elastic (τK, passive) contributions, respectively, and the reflex-driven stiffness (τReflex).
To avoid the undue influence of inertial torque, we extracted reflex-related parameters from the constant velocity portion of each stretch. Additionally, we subtracted from the net torque evoked at each test velocity a 5th order polynomial approximation of the 6 °/s torque for each participant (Figure 2A), which represents the passive stiffness of the joint (Dewald et al. 1996; Schmit et al. 2000; Schmit et al. 1999; Schmit and Rymer 2001; Sinkjaer and Magnussen 1994). We then bandpass filtered this torque 3-5 Hz using a zero-phase delay filter. This manipulation minimized the impact of passive stiffness on subsequent parameter estimations, and was possible because passive resistance during elbow extension is largely velocity insensitive for the angular range and velocities tested in this study (Given et al. 1995). Note, however, that passive stiffness is a function of joint angle (i.e., it is not constant over the range of motion). The passive nature of each 6 °/s stretch was verified by assuring that no significant increase in EMG activity was present during the stretch (< 3X standard deviation of background biceps EMG; Figure 2B). For comparison, Figure 3 shows the EMG activity and torque records from a 6 °/s and a 90 °/s stretch within a single participant, with clear reflex-evoked biceps EMG and torque present in the 90 °/s stretch.
Fig. 2.

Subtraction of passive stiffness from stretches evoking a reflex. (A) Passive elbow flexion torque generated during a 6°/s stretch (solid grey line) is subtracted from the net elbow flexion torque generated at 90°/s (dashed black line), leaving a reflex-dominated 90°/s torque profile (solid black line). X-axis: angular excursion (degrees); y-axis: elbow torque (Nm). (B) Verification of passive resistance to stretch. EMG activity of the biceps is shown during the 6°/s stretch in (A). Reflex threshold (dashed black line) was set at 3x standard deviation of resting activity level, which was estimated over 1 second immediately prior to stretch initiation (shaded dark gray area). If smoothed EMG activity (black line) exceeded this threshold, a stretch was considered to elicit a reflex. Grey trace: raw biceps EMG; x-axis: time (sec); y-axis: EMG amplitude (% maximum)
Fig. 3.

Comparison of EMG and biomechanical responses to 6°/s and 90°/s stretches. No significant EMG activity is elicited during the slow 6°/s stretch, accompanied by a small increase in passive elbow flexion torque. In contrast, strong reflex activation of biceps (BIC) and brachioradialis (BRD) is observed during a 90°/s stretch, accompanied by increased reflex-driven elbow flexion torque. Top row: BIC EMG; middle row: BRD EMG; bottom row: elbow flexion torque. Left column: 6°/s stretch; right column: 90°/s stretch. In all cases: X-axis depicts angular excursion (deg). EMG and are torque expressed as a percentage of max; Y-axis truncated at 100% for visualization only. Data from a single representative participant
The torque resulting from removal of inertial resistance and passive stiffness was thus dominated by reflex-driven stiffness. However, it should also be noted that the viscous contribution to overall movement resistance remained present in these reflex torque estimates. Although this contribution does increase with increasing stretch velocity, its impact is fixed throughout the constant velocity portion of an individual stretch and thus does not account for the increased resistance seen with increased angular displacement. Additionally, Lindberg et al. (2011) has found that passive viscosity may in actuality be reduced in individuals with spasticity secondary to unilateral brain injury.
The following reflex-related parameters were separately extracted for each stretch velocity and participant:
- Torque magnitude:
- Peak reflex torque.
- Torque at 5° from end range.
Fig. 4.

Estimation of velocity dependent reflex threshold angle and stiffness. Threshold and stiffness were each estimated with two methodologies. Top panel: Absolute threshold angle is defined as the angle at which the reflex torque exceeds 0.2Nm. Regression-based stiffness is defined as the slope of a linear regression fit to the torque-angle plot. X-axis: elbow angle (deg); y-axis: elbow torque (Nm); solid grey line: reflex torque. Bottom panel: Relative threshold is defined as the angle corresponding to 20% of peak incremental stiffness. Peak stiffness is the defined as the maximum incremental stiffness. X-axis: elbow angle (deg); y-axis: incremental stiffness (Nm/deg); solid grey line: incremental stiffness as function of angle
The dual estimation approach was used to determine the robustness of each component (i.e., maximum reflex torque, reflex stiffness, reflex threshold angle) to changes in parameter definitions, given the lack of standardization observed across the experimental and clinical literature. The magnitude and direction of association between each of the above parameters and stretch velocity (i.e., the velocity dependence) was calculated using Pearson’s product-moment correlation. All comparisons were considered significant at the α=0.05 level.
RESULTS
Qualitative aspects of reflex torque as a function of stretch velocity
Stretch reflex torques for two representative participants (at three velocities) are shown in Figure 5, each over the full extension range. Both participants demonstrated a velocity-dependent increase in average reflex stiffness and a velocity-dependent decrease in absolute threshold angle. Furthermore, the shape of the torque-angle plots changed significantly for larger angular perturbations, as demonstrated by the participant depicted in the bottom panel of Figure 5. Such torque plateau behavior has been previously reported (Schmit et al. 1999).
Fig. 5.

Representative torque-angle plots for three stretch velocities. Reductions in reflex threshold and increases in reflex torque are qualitatively apparent in two participants as stretch velocity is increased. Additionally, in Participant J, peak torque plateaus prior to end range. Top panel: Participant K. Bottom panel: Participant J. Both panels: x-axis: elbow angle (deg); y-axis: reflex torque (Nm); dark grey lines: 30°/s perturbation; black lines: 90°/s perturbation; light grey lines: 150°/s perturbation
Quantitative aspects of reflex torque as a function of stretch velocity: single participant data
The overall velocity sensitivity that was observed qualitatively in the individual torque-angle profiles (Figure 5) was also evident in the extracted stretch reflex parameters, which are shown for a single representative participant in Figure 6. Peak reflex torque and torque measured at 5° from end range both increased as a function of increasing stretch velocity, and were statistically indistinguishable from one another (Figure 6A). The average reflex stiffness and the peak instantaneous stiffness also increased with increasing stretch velocity (Figure 6B). Expectedly, average reflex stiffness was less than or equal to instantaneous peak reflex stiffness due to a plateau in the torque-angle curves before the end of the stretch. Both estimates of reflex threshold angle exhibited an inverse relationship with stretch velocity and were statistically indistinguishable from one another (Figure 6C).
Fig. 6.

Representative comparison of torque magnitude, torque-angle slope, and velocity dependent threshold angle estimation methods at each stretch velocity. (A): Reflex torque magnitude increases with stretch velocity for both estimation methods. X-axis: stretch velocity (deg/s); y-axis: elbow torque (Nm); black circles: peak reflex torque; grey triangles: torque at 5° from end rage. (B): Both estimates of stiffness increase as a function of stretch velocity, however some inconsistencies between estimates are apparent. X-axis: stretch velocity (deg/s); y-axis: incremental stiffness (Nm/deg); black circles: peak incremental stiffness; grey triangles: stiffness derived from the slope of linear regression fit to the torque-angle relationship at each velocity. (C): A reduction in both estimates of threshold angle is apparent as stretch velocity increases, with relatively close agreement between estimation methodologies. X-axis: stretch velocity (deg/s); y-axis: threshold angle (deg); black circles: absolute threshold angle; grey triangles: angle corresponding to 20% of peak incremental stiffness. Data taken from a single representative participant
Quantitative aspects of reflex torque as a function of stretch velocity: group data
All participants demonstrated a marked velocity sensitivity of reflex torque magnitude, with close intra-participant agreement between the two measures of the torque-velocity relationship (Figure 7, top panel). All correlation coefficients between velocity and torque magnitude were positive and significantly different from zero, reflective of the characteristic increase in reflex torque as a function of stretch velocity. The majority of participants also exhibited significant velocity-dependence of reflex stiffness and threshold angle (Figure 7, middle and bottom panels), regardless of parameter definition. Nevertheless, some intra-participant inconsistencies were noted between definitions. For example, while all participants exhibited a significant, positive correlation between torque-angle slope and velocity, participants C, I, and L did not exhibit a significant correlation between stretch velocity and peak incremental stiffness (Figure 7, middle panel). Likewise, some intra-participant inconsistencies were also noted in the apparent velocity sensitivity of threshold angle (Figure 7, bottom panel). Most notably, velocity sensitivity appeared to increase when threshold angle was defined as the angle corresponding to 20% of the peak instantaneous reflex stiffness rather than the angle corresponding to 0.2 Nm above baseline torque. Specifically, threshold angle was significantly correlated with velocity in all but one participant (Participant I) when calculated using 20% of the peak instantaneous reflex stiffness, whereas the absolute threshold angle was not significantly correlated with velocity in 5 participants (C, F, I, L, M). Paradoxically, in participant J we observed an apparent positive correlation between velocity and absolute threshold angle, which was driven by threshold angles at or very near the home elbow position angle even during slow stretches.
Fig. 7.

Velocity-sensitivity of reflex parameters. Top panel: All participants show a significant positive correlation between torque magnitude and velocity. Black circles: torque at 5° from end range; gray circles: overall peak torque. Middle panel: All participants except for C, I, and L exhibit a significant positive correlation between torque-angle slope and velocity. Black circles: regression-based torque-angle slope; gray circles: peak of instantaneous torque-angle slope. Bottom panel: Across participants, threshold angle is less strongly correlated with stretch velocity. Black circles: absolute threshold angle; gray circles: relative threshold angle. All panels: x-axis: participant; y-axis: Pearson correlation coefficient (R). Light grey shading represents statistically significant correlations at the α = 0.05 level
Given the variability inherent to estimates of both the velocity-dependent threshold angle and reflex stiffness, we developed a participant-specific model to further investigate the velocity sensitivity of these two parameters. In this model, resistance to an imposed movement begins at a participant’s threshold angle for a given stretch velocity and increases linearly as a function of angular excursion at a rate defined by the slope of their reflexive torque-angle relationship at that velocity (see Figure 8A for the modeled stretch responses in one participant for all velocities). We then calculated the effect that a change only in the threshold angle (deltaT_threshold) or change only in the torque-angle slope (deltaT_slope) would have had on the overall reflex-driven resistance to movement (deltaT_overall) as stretch velocity was increased (see Figure 8B for a representative example). Subsequently, we determined the Change Accounted For (CAF) by threshold angle and torque-angle slope (again, one measure of reflex stiffness) for all possible increases in stretch velocity, and expressed these values as a percentage of the overall change in elbow torque observed for a given increase in velocity.
Fig. 8.

Linear reconstruction of torque responses and effects of threshold angle or slope changes on net reflex torque at increasing velocities. (A) As stretch velocity increases, the threshold angle (y-intercept of each line) decreases and the torque-angle slope increases, combining to result in a higher net reflex torque. Data derived from a single participant. X-axis: elbow angle (deg); y-axis: reflex torque (Nm); line colors depict reflex responses modeled at different stretch velocities. (B) ΔTthreshold reflects the increase in torque that would result only from a reduction in threshold angle. ΔTslope reflects the increase in torque that would result only from a change in torque-angle slope, and ΔToverall reflects the observed net increase in torque, which reflects changes in both threshold angle and slope. In this example, it can be qualitatively observed that ΔTslope represents a larger proportion of ΔToverall than does ΔTthreshold. X-axis: elbow angle (deg); y-axis: reflex torque (Nm); solid black line: linear approximation of actual reflex response at 15°/s; solid grey line: linear approximation of actual reflex response at 150°/s; dark grey dashed line (small hashes): torque response that would arise from a combination of a 150°/s threshold angle a 15°/s torque-angle slope; light grey dashed line (wide hashes): torque response that would arise from a combination of a 15°/s threshold angle and a 150°/s torque-angle slope
deltaT_overall = (peak regression torque at higher velocity – peak regression torque at lower velocity)
CAF_threshold = deltaT_threshold /deltaT_overall
CAF_slope = deltaT_slope/deltaT_overall
CAF_remainder = 100% - (CAF_slope + CAF_threshold)
As an example, a change in perturbation velocity from 30°/s to 150°/s resulted in approximately 8 Nm of additional resistive torque across participants (Figure 9, crosshatched bar for “mean”). Approximately 70% of this increase in torque could be accounted for by an increase in the slope of the torque-angle relationship (i.e., increased reflex stiffness; Figure 9, blue bar for “mean”), while only 13% was accounted for by a reduction in velocity dependent threshold angle (Figure 9, red bar for “mean”). Results for individual participants are also depicted in Figure 9, ranked in descending order from the greatest to the least overall increase in torque.
Fig. 9.

Proportion of net increased torque attributed to threshold angle and torque-angle slope changes as stretch velocity increases from 30°/s to 150°/s. On average, this velocity increase resulted in approximately 8 Nm of additional resistance, of which an increased torque-angle slope accounted for ~70% and a reduction in threshold angle accounted for ~13%. X-axis: torque (Nm) due to increased perturbation velocity; y-axis: participant ID; red bars: resistance attributed to threshold angle reductions; blue bars: resistance attributed to torque-angle slope increases; purple bars: resistance attributed to the combination of threshold angle reductions and torque-angle slope increases; crosshatched bars: overall increased resistance
Expanding upon these results, Figure 10 represents the CAF for all possible increases in velocity, averaged across all participants. In Figure 10A, the average increase in reflex torque is plotted for all possible increases in stretch velocity. Predictably, the maximum increase in torque (~10Nm) resulted from the greatest increase in velocity, from 15°/s to 150°/s. Panels B and C of Figure 10 show the average CAF by increases in the slope of the torque-angle profile and decreases in reflex threshold angle, respectively. Across all participants and all possible increases in velocity, increases in torque-angle slope accounted for 60-91% of the total observed increase in reflex torque, averaging approximately 74% (Figure 10B). By contrast, velocity-dependent reductions in threshold angle with no associated change in reflex stiffness accounted for only 7-30% of the overall increase in torque, averaging a 15% contribution (Figure 10C).
Fig. 10.
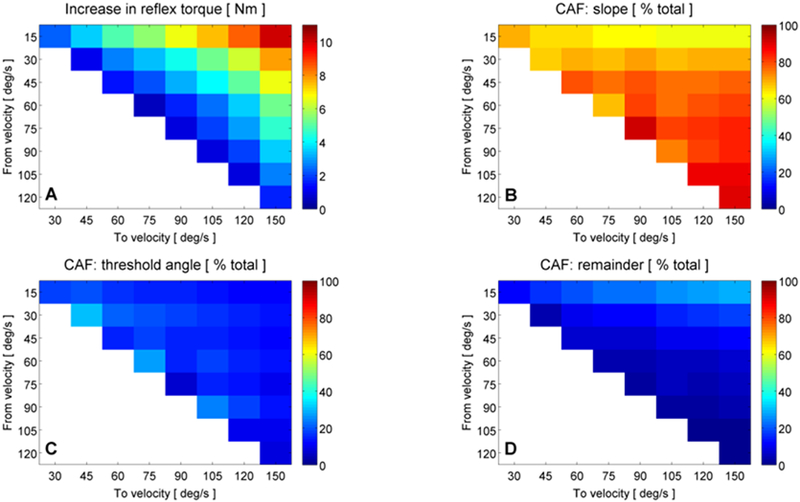
Proportion of increased torque attributed to threshold angle and torque-angle slope changes for all possible increases in stretch velocity. (A): average across-participant increase in reflex torque (Nm) for all possible increases in stretch velocity; colormap: 0-12Nm. The maximum increase in torque occurred for the largest increase in velocity, from 15°/s to 150°/s (red color, top right). (B): average across-participant change accounted for (CAF) by an increased torque-angle slope for all possible increases in stretch velocity; colormap: 0-100%. CAF by torque-angle slope ranged from ~60-91% of the total velocity-dependent increase in reflex torque. (C): CAF by threshold angle reductions; colormap: 0-100%. CAF by threshold accounted for only 7-30% of the increases in torque. (D): CAF by factors other than torque-angle slope and threshold changes (i.e., the remainder); colormap: 0-100%. CAF by remainder ranged from 1-29% of the total increase in torque. All panels: x-axis: stretch velocity (deg/s); y-axis: stretch velocity (deg/s). The location of each colored square within a panel (defined by x-y coordinates) corresponds to an increase in stretch velocity from the y-axis value to the x-axis value, e.g., the top left corner in all panels corresponds to an increase in stretch velocity from 15°/s to 30°/s. Colormaps denote the magnitude of the parameter indicated by the title of each panel. Blank spaces represent no comparison
Interestingly, it can be seen in Figure 10B that the CAF by slope reaches its peak when velocity is increased from 120°/s to 150°/s and not when velocity is increased from 15°/s to 150°/s, where the greatest increase in net torque is observed. This finding is related to the CAF by threshold angle, which reaches a minimum when increasing from 120°/s to 150°/s. Indeed, when increasing from the lowest possible velocity to the highest, both the slope of the torque-angle relationship and the velocity dependent threshold angle have a large capacity for change. As such, each component can account for a significant portion of the increased torque. However, as can be seen in Figure 8A, threshold angles tend to reach a floor as velocity increases above ~90°/s, after which point nearly all additional changes in net torque must be accounted for by slope increases.
It should be noted that reductions in velocity dependent threshold angle and increases in torque-angle slope did not uniformly account for 100% of the overall increase in torque (Figure 10D), even in the case of high velocity stretches. This change unaccounted for by either threshold or slope ranged from 1-29% of the total increase in torque, but on average only accounted for 10% of the increase in torque. Because this residual quantity was greatest when moving from the slowest stretch velocity (i.e., 15°/s) to faster stretches, it presumably reflects slight postural adjustments or voluntary reactions made during the slow stretches, given the relatively long duration of the slow stretches themselves (e.g., a 90° angular excursion at 15°/s would have required 6 seconds to complete). Nevertheless, for all increases in velocity, the associated increase in the torque-angle slope was the predominant driver of increased resistance to movement as compared either to reductions in threshold angle or to changes not captured by this analysis.
DISCUSSION
We investigated the impact of velocity-dependent changes in reflex threshold angle and reflex stiffness, respectively, within the spastic elbow flexors of individuals with chronic unilateral brain injury. This approach differs from conventional investigations, which have focused on increased movement resistance between spastic and non-spastic limbs. Our goal was to determine which parameter (i.e., reflex threshold angle or reflex stiffness) accounts for more of the velocity-dependent increases in movement resistance after unilateral brain injury, and, by extension, which parameter accounts for more of the changes in spinal motor excitability. Our primary finding was that reflex stiffness accounts for significantly more changes in stretch velocity than reflex threshold angle, explaining 74% of increases in movement resistance across all changes in stretch velocity compared to only 15% for threshold angle. This finding has not previously been reported, and suggests that measures of reflex stiffness, for example the slope of a linear regression fit to the reflex torque vs. elbow extension angle relationship (Figure 4, top panel), may be useful as standalone measures of spinal motor excitability. By demonstrating that robust reflex characterization can be achieved using reflex stiffness alone, these findings increase the efficiency of objective, high-resolution approaches to reflex quantification and motivate a transition away from use of coarse clinical reflex rating scales.
Sensitivity and robustness of reflex-related parameters
Although reflex stiffness and threshold angle can be independently parameterized, they are causally linked in the broader context of reflex manifestation. Indeed, they cannot be decoupled either volitionally or biophysically. However, this coupling does not imply that the two parameters necessarily exhibit the same velocity sensitivity, nor does it imply that a given velocity-dependent threshold angle can only be followed by a particular reflex stiffness.
To this point, we found that reflex stiffness mathematically accounted for 74% of changes in reflex-evoked torque increases (on average). By comparison, threshold angle accounted for only ~15%. This finding is related at least in part to the observation that reflex stiffness is modifiable over the entire range of stretch velocities while threshold angle is limited by floor effects. Indeed, at velocities over 90°/s, threshold angle is nearly coincident with starting position across participants. The equilibrium point model (Blanchette et al. 2016; Feldman 1986; Musampa et al. 2007) proposes a solution to the problem of threshold angle compression by defining the tonic stretch reflex threshold (TSRT), the theoretical angle at which reflexive muscle activity would begin under static or quasi-static conditions (Blanchette et al. 2016; Calota et al. 2008). Because the TSRT can appear at angles more acute than biomechanically possible, it removes the floor effect of physiological joint motion. We did not compute TSRT for our participants, however. As a result, our study is not intended to suggest that reflex stiffness is more or less velocity sensitive than the TSRT as defined by the equilibrium point model.
Numerical estimates of reflex stiffness and threshold angle varied depending on the specific parameter definition used. However, reflex stiffness assessed by torque-angle slope was generally more robust to changes in definition than peak instantaneous stiffness or either measure of reflex threshold angle. This may be related to our use of stretches with a large angular excursion, which yields a protracted range over which to compute slope-based metrics. Thus, even in cases where the threshold angle is coincident with the limb’s starting position (i.e., the reflex is elicited immediately), we are able to reliably derive slope-based parameters. Additionally, estimates of reflex stiffness may be less dependent upon an individual’s volitional strength than estimates of threshold angle. For example, absolute measures of threshold angle (e.g., 0.2 Nm above baseline torque) could represent a higher or lower threshold across individuals depending on their volitional strength, whereas relative measures (e.g., the angle at 20% max instantaneous stiffness) are inherently normalized. Indeed, our absolute measure of threshold angle was not significantly correlated with velocity in 5 participants whereas our relative measure of threshold angle was significantly correlated with velocity in all but 1.
Potential influence of clinical presentation on sensitivity of biomechanical variables
We specifically selected a participant cohort with a wide range of clinical spasticity scores. However, if Ashworth score (for example) is well correlated with one of our outcome variables, then our estimates of parameter sensitivity may be confounded by this relationship. The primary consideration from this standpoint would be if higher Ashworth scores were correlated with reduced threshold angles. If this were to be the case, then individuals with more severe clinical spasticity would presumably reach a floor in threshold angle at lower velocities than individuals with milder spasticity. Thus, it would be more difficult to extract a meaningful threshold angle in this population, biasing our estimate of threshold angle sensitivity based on the proportion of individuals with mild versus severe spasticity. However, we found no correlations between clinical score and our biomechanical outcome measures.
First, as a representative example, we consider Participants F and I. From a biomechanical perspective, the participants were similar: they were the only two participants for whom threshold angle accounted for more of the increase in movement resistance than did reflex stiffness when stretch velocity was increased from 30 to 150°/s (Figure 9), and both participants exhibited low reflex-evoked torque. From a clinical perspective, however, each was unique: Participant F had a Fugl-Meyer score of 12, the lowest in our study and indicative of severe post-stroke motor impairment, and an Ashworth score of 3, indicative of considerable spasticity. In contrast, Participant I had a Fugl-Meyer score of 40 and an Ashworth score of 1 – considerably milder overall impairment.
Next, across all participants, we investigated potential correlations between Ashworth score and change accounted for by reflex stiffness and threshold angle, respectively (Figure 11). Pearson correlation analysis revealed that a linear relationship between Ashworth score and reflex threshold angle explained only 14% of the variability in the data, failing to reach significance at the α=0.05 level (Figure 11, gray circles; p=0.21). This finding is further supported by the available literature, which has also found Ashworth score and threshold angle to be independent (Calota et al. 2008). A linear relationship between Ashworth score and reflex stiffness also failed to reach significance (P=0.39), explaining only 7% of the variability in the data (Figure 11, blue circles). However, it should be noted that conflicting reports exist in the literature as to whether reflex stiffness is indeed correlated with Ashworth score (Alibiglou et al. 2008; Bhadane et al. 2015; de Vlugt et al. 2010). Nevertheless, these secondary analyses suggest that our estimates of threshold angle and reflex stiffness were not biased by the distribution of clinical scores in our study population.
Fig. 11.

Ashworth score is not correlated with biomechanical parameters of the elbow stretch reflex response. Gray circles: proportion of increased reflex torque accounted for by threshold angle, plotted as a function of Ashworth score for all participants; blue triangles: proportion of increased reflex torque accounted for by reflex stiffness, plotted as a function of Ashworth score for all participants. Solid black line: linear regression for threshold data; dashed line: linear regression for stiffness data. Ashworth score was not correlated with reflex torque or stiffness (P = 0.21, P = 0.39, respectively).
Limitations
Our study has important limitations. For example, we did not control for time-post-injury across participants, which could have increased the overall variability of our findings via changes in muscle properties (although changes in passive joint stiffnesses and muscle fascicle length can occur within the first year after hemiparetic stroke (Nelson et al. 2018)). The study also did not conduct simultaneous EMG analyses of reflex responses. This choice was made primarily because the definition of spasticity – a common clinical correlate of spinal motor excitability – is an increased velocity-dependent resistance to movement (Lance 1980a; Lance 1980b). We also elected to use biomechanical measures because placement and analysis of EMGs requires more time than a purely biomechanical assessment, limiting its translation to clinical or clinical research settings. Further, only a subset of muscles can be reliably accessed for EMG recording, and the mapping from EMG to joint torque is not clear, particularly during a dynamic task with altered neuromuscular control (Schmit et al. 1999). Finally, because our goal was not to investigate the neural mechanisms that drive changes in reflex stiffness or threshold angle, EMG activity was not required. Nevertheless, the addition of EMG data in this purely research setting would inevitably provide a richer picture of spinal motor excitability, particularly if using advanced tools that enable non-invasive high-yield motor unit analyses (McPherson et al. 2016; Miller et al. 2014).
An additional limitation of this work is that it focused only on the paretic elbow flexors. Therefore, our findings do not provide direct insights into the relative velocity sensitivity of threshold angle and reflex stiffness at the wrist, knee, or ankle joints (although threshold angle and reflex stiffness can be calculated at those joints, as well). Finally, we did not set the home position to be a fixed angular excursion from each participant’s threshold angle. As a consequence, some participants’ threshold angles were closer to the standardized home position than others (47-55° elbow flexion). For example, if the home position for Subject J (Figure 3) had been approximately 60-65°, reflexive torque would have been developed immediately in angle-space, and no clear threshold angle would have been recorded. The dependence of threshold angle on home angular position underscores the utility of reflex stiffness as primary outcome measure.
Clinical implications
Our results indicate that reflex stiffness – and in particular torque-angle slope – is substantially more sensitive to changes in stretch velocity than reflex threshold angle in the paretic elbow flexors. Thus, we advocate using the torque-angle slope as the primary outcome measure for biomechanically-based assessments of spinal motor excitability in the paretic elbow flexors. This approach will continue to yield sensitive assessments of reflex activity even in situations where a clear threshold angle is not readily identifiable (e.g., due to significant spontaneous muscle activity at rest or an inability to achieve a sufficiently flexed home elbow angle). Although the most commonly used clinical spasticity scale (the Ashworth scale) does provide a measure of movement resistance that is indirectly related to the torque-angle slope, this estimate is both coarse and inherently subjective. Additionally, the scale’s inter-rater reliability and sensitivity are questionable (Fleuren et al. 2010). The Tardieu scale and its modified versions seek to estimate both a catch angle (similar to the velocity-dependent threshold angle) and the overall resistance to movement (Tardieu et al. 1954). However, the Tardieu scale is also coarse and has high inter-trial variability (Ben-Shabat et al. 2013; Haugh et al. 2006; Li et al. 2014; Naghdi et al. 2014).
The lack of granularity inherent to current clinical spasticity assessments is particularly problematic when assessing the effects of physical and/or pharmacological interventions, or when patients are assessed by multiple clinicians. As a result, we also advocate using single degree-of-freedom mechatronic devices for spasticity quantification in the clinical setting. For such examinations, we recommend using stretch velocities greater than ~100°/s, as the sensitivity of the torque-angle slope to changes in velocity was most prominent during the fastest stretches while the impact of movement artifacts was simultaneously at its lowest. Additionally, higher stretch velocities will have the pragmatic benefit of more reliably eliciting reflexes, even in individuals with less severe spasticity. And, to reiterate, despite the presence of some intra-participant variability when comparing different definitions of the torque-angle slope, we observed no systematic differences between estimation techniques across the experimental cohort. Thus, torque-angle slope appears to be sufficiently robust in the paretic elbow flexors to be detected with multiple definitions, given a precise, objective means of acquisition and a high-resolution measurement of the biomechanical response.
Our approach also has the potential to be adapted to other joints. For example, the protocol described here could be adapted to the knee, ankle, or wrist joints. Clinically available mechatronic devices (e.g., the Biodex system) typically ship with attachments for the knee and ankle as well as the elbow, and ramp-and-hold perturbations have been described for these joints in the literature (e.g., (Sinkjaer and Magnussen 1994)).
Finally, our approach could be applied to motor abnormalities beyond spasticity and clinical populations beyond unilateral brain injury. Indeed, interventions targeting other components of the post-stroke sensorimotor impairment sequelae (e.g., the upper limb flexion synergy) may still impact spinal motor excitability or benefit from a reduction in spinal motor excitability. For example, it has recently been shown that targeted neuropharmacology can reduce flexion synergy expression by disfacilitating spinal alpha motoneurons (McPherson et al. 2018a). The protocol described here could provide an efficient additional outcome measure for inferring the nature and extent of changes in spinal motor excitability. Additionally, our protocol could be applied to other neurological conditions that would potentially result in altered spinal motor excitability, including but not limited to spinal cord injury, cerebral palsy, and multiple sclerosis.
To summarize, the practical relevance of our approach from a motor impairment standpoint is twofold: (1) the testing protocol and reflex stiffness outcome measure are direct measures of stretch reflex excitability/spasticity, and (2) it is an indirect measure of overall spinal motor excitability. Because changes in spinal motor excitability are implicated in many motor impairments post-stroke, this approach has wide potential applicability. From an intervention standpoint, the practical relevance of our approach is also twofold: (1) it utilizes objective, high resolution outcome measures that provide an efficient yet sensitive approach for characterizing changes in spasticity and/or spinal motor excitability in a given individual before and after an intervention, and (2) because it utilizes clinically available physical rehabilitation devices, it is not contingent upon the intra/inter-rater reliability of individual practitioners. Thus, our approach will facilitate longitudinal tracking of individuals, meta-analyses of reflex data collected across multiple sites, and/or directed multi-site trials.
ACKNOWLEDGEMENTS:
National Institutes of Health (NIH) Grant: 5R01HD039343.
Contributor Information
Jacob G. McPherson, Department of Biomedical Engineering, Florida International University. Mailing address: 10555 W. Flagler St., EC #3171, Miami, FL 33176, USA. jmcphers@fiu.edu
Arno H.A. Stienen, Department of Physical Therapy and Human Movement Sciences, Feinberg School of Medicine, Northwestern University. Mailing address: 645 N Michigan Ave, Suite 1100, Chicago, IL 60611, USA. arno.stienen@motekforcelink.com
Brian D. Schmit, Department of Biomedical Engineering, Marquette University. Mailing address: P.O. Box 1881, Milwaukee, WI 53201, USA. brian.schmit@marquette.edu
Julius P.A. Dewald, Department of Physical Therapy and Human Movement Sciences, Feinberg School of Medicine, Northwestern University. Mailing address: 645 N Michigan Ave, Suite 1100, Chicago, IL 60611, USA. j-dewald@northwestern.edu
REFERENCES
- Alibiglou L, Rymer WZ, Harvey RL, Mirbagheri MM (2008) The relation between Ashworth scores and neuromechanical measurements of spasticity following stroke J Neuroeng Rehabil 5:18 doi: 10.1186/1743-0003-5-18 [DOI] [PMC free article] [PubMed] [Google Scholar]
- Ashworth B (1964) Preliminary Trial of Carisoprodol in Multiple Sclerosis The Practitioner 192:540–542 [PubMed] [Google Scholar]
- Bakheit AM, Maynard VA, Curnow J, Hudson N, Kodapala S (2003) The relation between Ashworth scale scores and the excitability of the alpha motor neurones in patients with post-stroke muscle spasticity Journal of neurology, neurosurgery, and psychiatry 74:646–648 [DOI] [PMC free article] [PubMed] [Google Scholar]
- Ben-Shabat E, Palit M, Fini NA, Brooks CT, Winter A, Holland AE (2013) Intra- and interrater reliability of the Modified Tardieu Scale for the assessment of lower limb spasticity in adults with neurologic injuries Archives of physical medicine and rehabilitation 94:2494–2501 doi: 10.1016/j.apmr.2013.06.026 [DOI] [PubMed] [Google Scholar]
- Bennett DJ, Hollerbach JM, Xu Y, Hunter IW (1992) Time-varying stiffness of human elbow joint during cyclic voluntary movement Experimental brain research 88:433–442 [DOI] [PubMed] [Google Scholar]
- Bhadane MY, Gao F, Francisco GE, Zhou P, Li S (2015) Correlation of Resting Elbow Angle with Spasticity in Chronic Stroke Survivors Front Neurol 6:183 doi: 10.3389/fneur.2015.00183 [DOI] [PMC free article] [PubMed] [Google Scholar]
- Blanchette AK, Mullick AA, Moin-Darbari K, Levin MF (2016) Tonic Stretch Reflex Threshold as a Measure of Ankle Plantar-Flexor Spasticity After Stroke Phys Ther 96:687–695 doi: 10.2522/ptj.20140243 [DOI] [PubMed] [Google Scholar]
- Brunnstrom S (1966) Motor testing procedures in hemiplegia: based on sequential recovery stages Physical therapy 46:357–375 [DOI] [PubMed] [Google Scholar]
- Burne JA, Carleton VL, O‧Dwyer NJ (2005) The spasticity paradox: movement disorder or disorder of resting limbs? Journal of neurology, neurosurgery, and psychiatry 76:47–54 doi: 10.1136/jnnp.2003.034785 [DOI] [PMC free article] [PubMed] [Google Scholar]
- Calota A, Feldman AG, Levin MF (2008) Spasticity measurement based on tonic stretch reflex threshold in stroke using a portable device Clinical neurophysiology : official journal of the International Federation of Clinical Neurophysiology 119:2329–2337 doi: 10.1016/j.clinph.2008.07.215 [DOI] [PubMed] [Google Scholar]
- Condliffe EG, Clark DJ, Patten C (2005) Reliability of elbow stretch reflex assessment in chronic post-stroke hemiparesis Clinical neurophysiology : official journal of the International Federation of Clinical Neurophysiology 116:1870–1878 doi: 10.1016/j.clinph.2005.02.030 [DOI] [PubMed] [Google Scholar]
- de Vlugt E, de Groot JH, Schenkeveld KE, Arendzen JH, van der Helm FC, Meskers CG (2010) The relation between neuromechanical parameters and Ashworth score in stroke patients J Neuroeng Rehabil 7:35 doi: 10.1186/1743-0003-7-35 [DOI] [PMC free article] [PubMed] [Google Scholar]
- de Vlugt E, van der Helm FC, Schouten AC, Brouwn GG (2001) Analysis of the reflexive feedback control loop during posture maintenance Biological cybernetics 84:133–141 [DOI] [PubMed] [Google Scholar]
- Dewald JP, Given JD, Rymer WZ (1996) Long-lasting reductions of spasticity induced by skin electrical stimulation IEEE transactions on rehabilitation engineering : a publication of the IEEE Engineering in Medicine and Biology Society 4:231–242 [DOI] [PubMed] [Google Scholar]
- Dewald JP, Pope PS, Given JD, Buchanan TS, Rymer WZ (1995) Abnormal muscle coactivation patterns during isometric torque generation at the elbow and shoulder in hemiparetic subjects Brain : a journal of neurology 118 ( Pt 2):495–510 [DOI] [PubMed] [Google Scholar]
- Ellis MD, Schut I, Dewald JPA (2017) Flexion synergy overshadows flexor spasticity during reaching in chronic moderate to severe hemiparetic stroke Clin Neurophysiol 128:1308–1314 doi: 10.1016/j.clinph.2017.04.028 [DOI] [PMC free article] [PubMed] [Google Scholar]
- Ellis MD, Sukal T, DeMott T, Dewald JP (2008) Augmenting clinical evaluation of hemiparetic arm movement with a laboratory-based quantitative measurement of kinematics as a function of limb loading Neurorehabil Neural Repair 22:321–329 doi: 10.1177/1545968307313509 [DOI] [PMC free article] [PubMed] [Google Scholar]
- Feldman AG (1986) Once more on the equilibrium-point hypothesis (lambda model) for motor control J Mot Behav 18:17–54 [DOI] [PubMed] [Google Scholar]
- Fleuren JF, Voerman GE, Erren-Wolters CV, Snoek GJ, Rietman JS, Hermens HJ, Nene AV (2010) Stop using the Ashworth Scale for the assessment of spasticity Journal of neurology, neurosurgery, and psychiatry 81:46–52 doi: 10.1136/jnnp.2009.177071 [DOI] [PubMed] [Google Scholar]
- Forbes PA, Happee R, van der Helm FC, Schouten AC (2011) EMG feedback tasks reduce reflexive stiffness during force and position perturbations Experimental brain research 213:49–61 doi: 10.1007/s00221-011-2776-y [DOI] [PMC free article] [PubMed] [Google Scholar]
- Fugl-Meyer AR, Jaasko L, Leyman I, Olsson S, Steglind S (1975) The post-stroke hemiplegic patient. 1. a method for evaluation of physical performance Scandinavian journal of rehabilitation medicine 7:13–31 [PubMed] [Google Scholar]
- Given JD, Dewald JP, Rymer WZ (1995) Joint dependent passive stiffness in paretic and contralateral limbs of spastic patients with hemiparetic stroke Journal of neurology, neurosurgery, and psychiatry 59:271–279 [DOI] [PMC free article] [PubMed] [Google Scholar]
- Halaki M, O'Dwyer N, Cathers I (2006) Systematic nonlinear relations between displacement amplitude and joint mechanics at the human wrist Journal of biomechanics 39:2171–2182 doi: 10.1016/j.jbiomech.2005.06.022 [DOI] [PubMed] [Google Scholar]
- Haugh AB, Pandyan AD, Johnson GR (2006) A systematic review of the Tardieu Scale for the measurement of spasticity Disability and rehabilitation 28:899–907 doi: 10.1080/09638280500404305 [DOI] [PubMed] [Google Scholar]
- Jin Y, Zhao Y (2018) Post-stroke Upper Limb Spasticity Incidence for Different Cerebral Infarction Site Open Med (Wars) 13:227–231 doi: 10.1515/med-2018-0035 [DOI] [PMC free article] [PubMed] [Google Scholar]
- Kearney RE, Stein RB, Parameswaran L (1997) Identification of intrinsic and reflex contributions to human ankle stiffness dynamics IEEE transactions on bio-medical engineering 44:493–504 doi: 10.1109/10.581944 [DOI] [PubMed] [Google Scholar]
- Koo TK, Mak AF (2006) A neuromusculoskeletal model to simulate the constant angular velocity elbow extension test of spasticity Medical engineering & physics 28:60–69 doi: 10.1016/j.medengphy.2005.03.012 [DOI] [PubMed] [Google Scholar]
- Lambertz D, Goubel F, Kaspranski R, Perot C (2003) Influence of long-term spaceflight on neuromechanical properties of muscles in humans Journal of applied physiology 94:490–498 doi: 10.1152/japplphysiol.00666.2002 [DOI] [PubMed] [Google Scholar]
- Lance J (1980a) Pathophysiology of spasticity and clinical experience with baclofen In: Feldman RGYR, Koella WP (ed) Spasticity: disordered motor control. Year Book Publishers, Chicago, pp 185–203 [Google Scholar]
- Lance JW (1980b) The control of muscle tone, reflexes, and movement: Robert Wartenberg Lecture Neurology 30:1303–1313 [DOI] [PubMed] [Google Scholar]
- Li F, Wu Y, Li X (2014) Test-retest reliability and inter-rater reliability of the Modified Tardieu Scale and the Modified Ashworth Scale in hemiplegic patients with stroke European journal of physical and rehabilitation medicine 50:9–15 [PubMed] [Google Scholar]
- Lindberg PG, Gaverth J, Islam M, Fagergren A, Borg J, Forssberg H (2011) Validation of a new biomechanical model to measure muscle tone in spastic muscles Neurorehabilitation and neural repair 25:617–625 doi: 10.1177/1545968311403494 [DOI] [PubMed] [Google Scholar]
- Ludvig D, Visser TS, Giesbrecht H, Kearney RE (2011) Identification of time-varying intrinsic and reflex joint stiffness IEEE transactions on bio-medical engineering 58:1715–1723 doi: 10.1109/TBME.2011.2113184 [DOI] [PubMed] [Google Scholar]
- McPherson JG, Ellis MD, Harden RN, Carmona C, Drogos JM, Heckman CJ, Dewald J (2018a) Neuromodulatory inputs to motoneurons contribute to the loss of independent joint control in chronic moderate to severe hemiparetic stroke Frontiers in Neurology doi: 10.3389/fneur.2018.00470 [DOI] [PMC free article] [PubMed] [Google Scholar]
- McPherson JG, Stienen AH, Drogos JM, Dewald JP (2011) The relationship between the flexion synergy and stretch reflexes in individuals with chronic hemiparetic stroke IEEE Int Conf Rehabil Robot 2011:5975516 doi: 10.1109/ICORR.2011.5975516 [DOI] [PMC free article] [PubMed] [Google Scholar]
- McPherson JG, Stienen AH, Drogos JM, Dewald JP (2017) Modification of Spastic Stretch Reflexes at the Elbow by Flexion Synergy Expression in Individuals With Chronic Hemiparetic Stroke Arch Phys Med Rehabil doi: 10.1016/j.apmr.2017.06.019 [DOI] [PMC free article] [PubMed] [Google Scholar]
- McPherson JG, Stienen AH, Drogos JM, Dewald JP (2018b) Modification of Spastic Stretch Reflexes at the Elbow by Flexion Synergy Expression in Individuals With Chronic Hemiparetic Stroke Arch Phys Med Rehabil 99:491–500 doi: 10.1016/j.apmr.2017.06.019 [DOI] [PMC free article] [PubMed] [Google Scholar]
- McPherson LM, Negro F, Thompson CK, Sanchez L, Heckman CJ, Dewald J, Farina D (2016) Properties of the motor unit action potential shape in proximal and distal muscles of the upper limb in healthy and post-stroke individuals Conf Proc IEEE Eng Med Biol Soc 2016:335–339 doi: 10.1109/EMBC.2016.7590708 [DOI] [PMC free article] [PubMed] [Google Scholar]
- Miller LC, Thompson CK, Negro F, Heckman CJ, Farina D, Dewald JP (2014) High-density surface EMG decomposition allows for recording of motor unit discharge from proximal and distal flexion synergy muscles simultaneously in individuals with stroke Conf Proc IEEE Eng Med Biol Soc 2014:5340–5344 doi: 10.1109/EMBC.2014.6944832 [DOI] [PMC free article] [PubMed] [Google Scholar]
- Mirbagheri MM, Niu X, Varoqui D (2012) Prediction of stroke motor recovery using reflex stiffness measures at one month IEEE transactions on neural systems and rehabilitation engineering : a publication of the IEEE Engineering in Medicine and Biology Society 20:762–770 doi: 10.1109/TNSRE.2012.2205943 [DOI] [PubMed] [Google Scholar]
- Musampa NK, Mathieu PA, Levin MF (2007) Relationship between stretch reflex thresholds and voluntary arm muscle activation in patients with spasticity Exp Brain Res 181:579–593 doi: 10.1007/s00221-007-0956-6 [DOI] [PubMed] [Google Scholar]
- Naghdi S, Ansari NN, Abolhasani H, Mansouri K, Ghotbi N, Hasson S (2014) Electrophysiological evaluation of the Modified Tardieu Scale (MTS) in assessing poststroke wrist flexor spasticity NeuroRehabilitation 34:177–184 doi: 10.3233/NRE-131016 [DOI] [PubMed] [Google Scholar]
- Naghdi S, Ansari NN, Mansouri K, Olyaei GR, Asgari A, Kazemnejad A (2008) The correlation between Modified Ashworth Scale scores and the new index of alpha motoneurones excitability in post-stroke patients Electromyogr Clin Neurophysiol 48:109–115 [PubMed] [Google Scholar]
- Nelson CM, Murray WM, Dewald JPA (2018) Motor Impairment-Related Alterations in Biceps and Triceps Brachii Fascicle Lengths in Chronic Hemiparetic Stroke Neurorehabilitation and neural repair:1545968318792618 doi: 10.1177/1545968318792618 [DOI] [PMC free article] [PubMed] [Google Scholar]
- Perreault EJ, Crago PE, Kirsch RF (2000) Estimation of intrinsic and reflex contributions to muscle dynamics: a modeling study IEEE transactions on bio-medical engineering 47:1413–1421 doi: 10.1109/TBME.2000.880092 [DOI] [PubMed] [Google Scholar]
- Powers RK, Campbell DL, Rymer WZ (1989) Stretch reflex dynamics in spastic elbow flexor muscles Annals of neurology 25:32–42 doi: 10.1002/ana.410250106 [DOI] [PubMed] [Google Scholar]
- Powers RK, Marder-Meyer J, Rymer WZ (1988) Quantitative relations between hypertonia and stretch reflex threshold in spastic hemiparesis Annals of neurology 23:115–124 doi: 10.1002/ana.410230203 [DOI] [PubMed] [Google Scholar]
- Schmit BD, Dewald JP, Rymer WZ (2000) Stretch reflex adaptation in elbow flexors during repeated passive movements in unilateral brain-injured patients Archives of physical medicine and rehabilitation 81:269–278 [DOI] [PubMed] [Google Scholar]
- Schmit BD, Dhaher Y, Dewald JP, Rymer WZ (1999) Reflex torque response to movement of the spastic elbow: theoretical analyses and implications for quantification of spasticity Annals of biomedical engineering 27:815–829 [DOI] [PubMed] [Google Scholar]
- Schmit BD, Rymer WZ (2001) Identification of static and dynamic components of reflex sensitivity in spastic elbow flexors using a muscle activation model Annals of biomedical engineering 29:330–339 [DOI] [PubMed] [Google Scholar]
- Sinkjaer T, Magnussen I (1994) Passive, intrinsic and reflex-mediated stiffness in the ankle extensors of hemiparetic patients Brain : a journal of neurology 117 ( Pt 2):355–363 [DOI] [PubMed] [Google Scholar]
- Sommerfeld DK, Eek EU, Svensson AK, Holmqvist LW, von Arbin MH (2004) Spasticity after stroke: its occurrence and association with motor impairments and activity limitations Stroke 35:134–139 doi: 10.1161/01.STR.0000105386.05173.5E [DOI] [PubMed] [Google Scholar]
- Sommerfeld DK, Gripenstedt U, Welmer AK (2012) Spasticity after stroke: an overview of prevalence, test instruments, and treatments Am J Phys Med Rehabil 91:814–820 doi: 10.1097/PHM.0b013e31825f13a3 [DOI] [PubMed] [Google Scholar]
- Sukal TM, Ellis MD, Dewald JP (2007) Shoulder abduction-induced reductions in reaching work area following hemiparetic stroke: neuroscientific implications Exp Brain Res 183:215–223 doi: 10.1007/s00221-007-1029-6 [DOI] [PMC free article] [PubMed] [Google Scholar]
- Tardieu G, Shentoub S, Delarue R (1954) [Research on a technic for measurement of spasticity] Revue neurologique 91:143–144 [PubMed] [Google Scholar]
- Thilmann AF, Fellows SJ, Garms E (1991) The mechanism of spastic muscle hypertonus. Variation in reflex gain over the time course of spasticity Brain : a journal of neurology 114 ( Pt 1A):233–244 [PubMed] [Google Scholar]
- Velozo CA, Woodbury ML (2011) Translating measurement findings into rehabilitation practice: an example using Fugl-Meyer Assessment-Upper Extremity with patients following stroke Journal of rehabilitation research and development 48:1211–1222 [DOI] [PubMed] [Google Scholar]
- Zhang LQ, Rymer WZ (1997) Simultaneous and nonlinear identification of mechanical and reflex properties of human elbow joint muscles IEEE transactions on bio-medical engineering 44:1192–1209 doi: 10.1109/10.649991 [DOI] [PubMed] [Google Scholar]