Abstract
Repeatability and reproducibility of magnetization transfer magnetic resonance imaging of the breast, and the ability of this technique to assess the response of locally advanced breast cancer to neoadjuvant therapy (NAT), are determined. Reproducibility scans at 3 different 3 T scanners, including 2 scanners in community imaging centers, found a 16.3% difference (n = 3) in magnetization transfer ratio (MTR) in healthy breast fibroglandular tissue. Repeatability scans (n = 10) found a difference of ∼8.1% in the MTR measurement of fibroglandular tissue between the 2 measurements. Thus, MTR is repeatable and reproducible in the breast and can be integrated into community imaging clinics. Serial magnetization transfer magnetic resonance imaging performed at longitudinal time points during NAT indicated no significant change in average tumoral MTR during treatment. However, histogram analysis indicated an increase in the dispersion of MTR values of the tumor during NAT, as quantified by higher standard deviation (P = .005), higher full width at half maximum (P = .02), and lower kurtosis (P = .02). Patients' stratification into those with pathological complete response (pCR; n = 6) at the conclusion of NAT and those with residual disease (n = 9) showed wider distribution of tumor MTR values in patients who achieved pCR after 2–4 cycles of NAT, as quantified by higher standard deviation (P = .02), higher full width at half maximum (P = .03), and lower kurtosis (P = .03). Thus, MTR can be used as an imaging metric to assess response to breast NAT.
Keywords: MT-MRI, MTR, NAT, reproducibility, repeatability
Introduction
Magnetization transfer magnetic resonance imaging (MT-MRI) is sensitive to the macromolecular content of tissue, providing a contrast mechanism that differs from conventional magnetic resonance imaging (MRI) relaxation measurements such as T1 and T2. This macromolecular content includes contributions from a variety of biomolecules. For example, in white matter, the tissue for which MT-MRI has been best characterized, the macromolecular content is considered to include contributions from cholesterol, sphingomyelin, and galactocerebroside (1). The macromolecules that contribute to MT-MRI in cancer have not been fully described, although it has been postulated that increased proteolytic activity or decreased enzyme inhibition may play a role (2). The protons on these macromolecules are difficult to image directly owing to their fast transverse relaxation, but their effects can be observed indirectly by perturbing the macromolecular pool and imaging the effect on free water protons. More specifically, the image contrast in MT-MRI reflects the exchange of magnetization between protons in free water and protons bound to semisolid macromolecules through dipole–dipole interactions and/or chemical exchange. Since first reported by Wolff and Balaban (3), MT-MRI has been used extensively as a research tool in neuroimaging (1, 4), with notable success in assessing the demyelination process accompanying multiple sclerosis (5).
Compared with progress in neuroimaging, MT-MRI has been relatively underexplored in cancer imaging. A study of excised breast tissue found that magnetization transfer (MT) saturation improved the discrimination between healthy and malignant tissue (6). Further in vivo studies in the breast found that MT-MRI improved conspicuity of breast lesions (7) and distinguished malignant and benign lesions (2, 8). Although the biochemical basis for MT-MRI contrast in tumors has not been fully explored, these studies suggest that MT may reflect some aspects of malignant tissue, putatively the extracellular matrix, which has garnered increased recent attention for its role in tumor formation, growth, and metastasis (9). In breast cancer, in particular, the extracellular matrix has been implicated as a crucial driver of tumor progression and metastasis, as well as a potent mediator of treatment resistance (10).
MRI has shown the capability of characterizing changes in the tumor and tumor microenvironment that are associated with therapy. In breast cancer, MRI performed early in the course of neoadjuvant therapy (NAT) has proven capable of predicting the eventual tumor response before downstream changes in tumor size (11–13). The 2 MRI techniques that have been the most investigated for predicting therapeutic response to breast NAT are diffusion-weighted MRI (14) and dynamic contrast-enhanced MRI (15, 16), as well as their combination (17, 18). MT-MRI has not yet been investigated for evaluating (or predicting) response during therapy in locally advanced breast cancer.
In this study, we first characterize the repeatability and reproducibility of MT-MRI in healthy breast fibroglandular tissue (FGT). Then in a pilot cohort of women with locally advanced breast cancer, we investigate changes in MT-MRI in response to NAT and correlate these changes with surgical pathology results. Importantly, these studies are performed on MRI scanners sited in community imaging centers, showing that MT-MRI can be deployed beyond academic research centers and into routine clinical practice.
Methodology
MRI Protocol
MRI was performed using 3 T Siemens Skyra scanners (Erlangen, Germany) equipped with 8- or 16-channel receive double-breast coil (Sentinelle, Invivo, Gainesville, Florida). Three scanners were used in this study: 2 were located at community imaging facilities, while 1 was sited at an academic research facility. Repeatability studies were performed on the scanner sited at the academic research facility, while the normal subject reproducibility experiment was performed on all 3 scanners. The study in patients with breast cancer was performed at the 2 community imaging facilities.
All breast MRI data were acquired in the sagittal plane. To calculate the magnetization transfer ratio, 2 images were acquired, identical, save for the inclusion of an MT saturation pulse on 1 of the acquisitions. Both images consisted of spoiled gradient-echo sequences with repetition time (TR) = 48 milliseconds, echo time (TE) = 6.4 milliseconds, flip angle = 6°, receiver bandwidth = 260 Hz/pixel, acquisition matrix = 192 × 192, field of view = 256 × 256 mm, number of sections = 10, section thickness (with no section gap) = 5 mm. GRAPPA (GeneRalized Autocalibrating Partial Parallel Acquisition) acceleration factor of 2 and SPAIR (SPectral Attenuated Inversion Recovery) fat suppression were performed. The MT saturation pulse consisted of a 9.88-millisecond Gaussian-shaped MT prepulse performed within each repetition, with a flip angle of 500°, which was offset from the water frequency peak by 1.5 kHz. The acquisition time was 53 seconds for each acquisition, yielding a total imaging time of 1 minute, 46 seconds to acquire data both with and without the MT pulse.
The MRI protocol also included a high-resolution T1-weighted 3D gradient-echo FLASH (fast low angle shot) acquisition for identifying anatomy and segmentation of fibroglandular and adipose tissue. The following are parameters of this anatomical image: TR = 5.3 milliseconds, TE = 2.3 milliseconds, flip angle = 20°, acquisition matrix = 256 × 256, FOV = 256 × 256 mm, section thickness = 1 mm, GRAPPA acceleration = 2, and SPAIR fat suppression. Acquisition time for the anatomical image was 3 minutes and 11 seconds. For patients with breast cancer, a dynamic contrast-enhanced MRI protocol was performed after the MT acquisition to segment the tumor. The dynamic contrast-enhanced protocol consisted of a T1-weighted VIBE (volumetric interpolated breath-hold examination; no breath-holding was, however, used in these studies) acquisition with TR = 7.02 milliseconds, TE = 4.6 milliseconds, flip angle = 6°, acquisition matrix = 192 × 192, field of view = 256 × 256 mm, number of sections = 30, slice thickness = 5 mm, GRAPPA acceleration factor = 3. Imaging was performed at 7.27-seconds temporal resolution for 1 minute before and 6 minutes after administration of a gadolinium-based contrast agent (Multihance; Bracco, Monroe Township, NJ) or Gadovist (Bayer, Leverkusen, Germany) via a power injector followed by a saline flush.
Repeatability/Reproducibility Study
Volunteers consisted of healthy women (n = 10; median age = 39.5 years [range = 22–62]) with no history of breast disease who were neither pregnant nor breastfeeding. For the repeatability study, 2 MRI examinations were performed on the same day on a single MRI scanner, with subject removal from the examination table and repositioning between scans. To assess reproducibility of MTR, subjects were scanned at 3 different locations (which included 1 academic and 2 community radiology centers) on 3 different days.
Response to Breast Cancer NAT Study
Women (n = 15; median age = 41 years [range = 25–63 years]) with stage II or III locally advanced breast cancer undergoing NAT were recruited from community oncology practices (n = 15). Longitudinal MTR measurements were performed at 4 time points: before the start of NAT, after 1 cycle of NAT, after 2–4 cycles of NAT, and 1 cycle after MRI #3.
Image Analysis
MTR was calculated for each voxel via equation (1):
| (1) |
where SMT and S0 are the measured signal intensities with and without the MT saturation pulse, respectively. MTR values for voxels that returned undefined values (for which S0 = 0) or for which SMT > S0 were excluded from subsequent analyses. All pixels with MTR values of 0 were excluded to minimize the number of residual pixels, with partial volume averaging from adipose tissue.
Segmentation of FGT was performed on the anatomical images as previously described (20). Briefly, a k-means clustering algorithm was used to generate a mask specific to FGT based on image intensity. Segmentation of the tumor in the patient population with breast cancer was performed using dynamic contrast-enhanced images. A fuzzy c-means algorithm separated tumor from surrounding tissue based on the dynamics of signal intensity after contrast agent injection, similarly to a method previously described (21).
Statistical Analysis
Statistical analysis was performed using the statistical toolbox in MATLAB 2018a (The MathWorks, Natick, MA). Voxel values were averaged across the FGT, and repeatability/reproducibility statistics were calculated as previously described (20). Voxel values were both averaged across the tumor and binned into histograms for the therapeutic response study. Voxel distributions quantified the Kolmogorov–Smirnov test, and histogram analysis, similar to methods previously used to characterize MTR distributions in the brain (22). The following histogram parameters were derived from the histograms of MTR values: standard deviation; kurtosis; and the 25th, 75th, and 95th percentiles of the tumor MTR, where the nth percentile is the point at which n% of the voxel values that form the histogram are found to the left. The full width at half maximum, which was calculated using the “dfittool” in MATLAB to fit voxel values to a Gaussian distribution. To ensure that differences in voxel distributions were not due solely to tumor regression and thus a smaller number of voxels in the distribution, MTR distributions were truncated to be the same number of voxels and compared. Comparisons between 2 groups were made using a 2-tailed t test, with P < .05 considered significant. The voxel-wise distributions of MTR values were tested for equal variance using a 2-sample F-test to compare the pCR and non-pCR groups and Levene test to compare groups through time (multiple-sample test). Comparisons among >2 groups were made using 1-way ANOVA or, for measurements repeated in the same subject, repeated-measures ANOVA. Data are expressed as mean ± standard deviation.
Results
Repeatability and Reproducibility
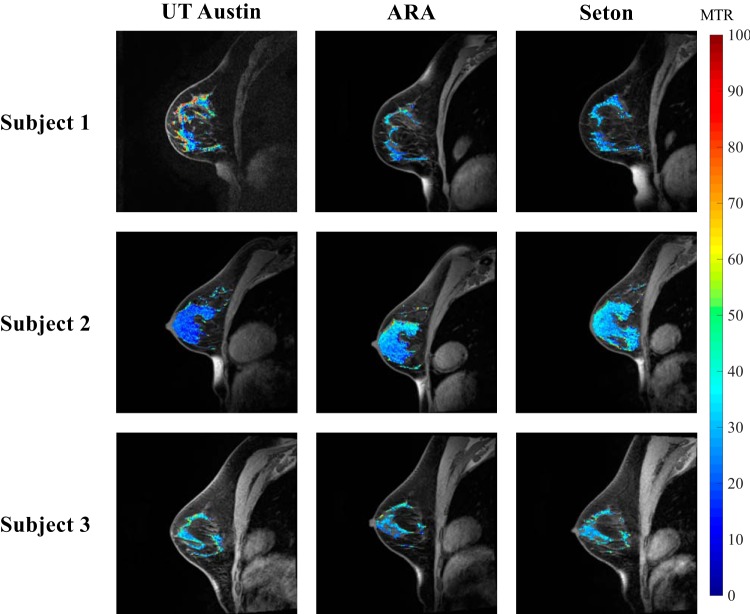
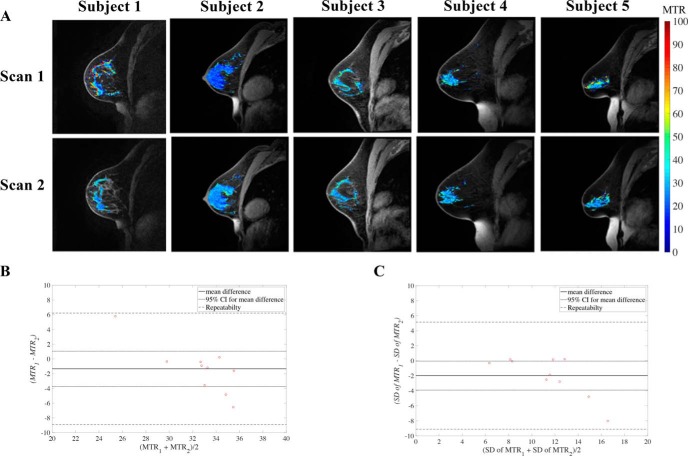
Reproducibility of MT-MRI in the breast was assessed by scanning normal breast FGT at the 3 different sites, yielding an average difference of 16.3% ± 14.4% in MTR between sites (Figure 1), with no statistical differences detected between the sites (P = .1). Repeatability was assessed by scanning the breast of the same woman twice with repositioning attempted between scans (Figure 2A). Repeatability scans of the same subject's FGT showed an average percent difference of 8.1% ± 7.9% in mean MTR measurement between the 2 scans. Repeatability of MTR in FGT was not significantly different between scans, suggesting lack of bias between the first and second scanning sessions (Figure 2B). In addition, the difference between repeated measurements was independent of the mean. The average MTR of FGT was 33% ± 5%. The difference between subject age and MTR was not significant (P = .08), but it did indicate a trend toward higher MTR values in younger subjects. The standard deviation of MTR values throughout the FGT was also assessed to determine how the voxel distribution varied across repeat scans (Figure 3B). The repeatability statistics for both mean and standard deviation of MTR are summarized in Table 1, which establish metrics for intraindividual variability of MTR in breast tissue.
Figure 1.
Multisite reproducibility of magnetization transfer ratio (MTR) in 3 normal subjects scanned at 3 sites. MTR values of fibroglandular tissue (FGT) are displayed in pseudo color and overlaid on top of an anatomical image.
Figure 2.
Repeatability of MTR maps of FGT in 5 women undergoing test–retest scanning with subject repositioning between scans (A). MTR maps of FGT are displayed in pseudo color and overlaid on top of an anatomical image. Bland–Altman plot of mean MTR repeatability in breast FGT (B). Bland–Altman plot of MTR standard deviation repeatability in breast FGT (C).
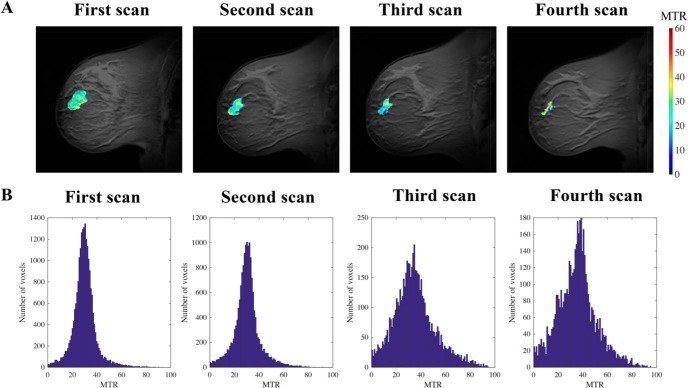
Figure 3.
Representative MTR maps pseudo-colored and overlaid on an anatomical image of a subject who experienced a partial response to neoadjuvant therapy (NAT) (A). Histograms of voxel distributions of tumor MTR from all participants at the first, second, third, and fourth magnetic resonance imaging (MRI) sessions show higher dispersion at later time points after the start of treatment (B).
Table 1.
Repeatability Statistics for Normal Breast FGT (n = 10)
| Mean MTR | Standard Deviationof MTR | |
|---|---|---|
| Kendall's tau, P (age vs mean) | 0.08 | 0.06 |
| Kendall's tau, P (difference vs mean) | 0.236 | 0.04 |
| 95% CI (percentage of mean) | 2.39, (7.30%) | 1.92, (16.90%) |
| Root mean square deviation (percentage of mean) | 3.44, (10.51%) | 3.23, (28.36%) |
| Within-subject standard deviation (percentage of mean) | 2.43, (7.43%) | 2.29, (20.06%) |
| Repeatability value (r) (percentage of mean) | 7.56, (23.13%) | 7.12, (62.43%) |
Response to Neoadjuvant Therapy
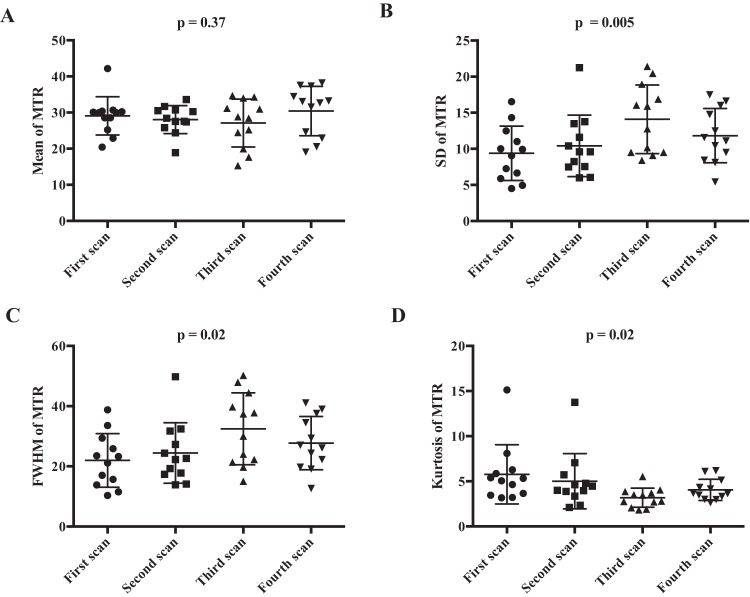
To assess changes in MTR during treatment, longitudinal MT-MRI was performed on women before the start of NAT and at 3 time points during the course of NAT. Mean MTR values of the breast tumors before the start of therapy were higher than the MTR values of FGT in healthy controls (mean tumor MTR = 29% ± 1%; mean FGT MTR = 33% ± 5%; P = .02) and did not display any correlation with subject age (P = .74). Representative images from a subject who experienced partial response to NAT are shown in Figure 3A, with MTR values of the tumor overlaid in pseudo color. The volume of the tumor decreased from the first MRI, performed before the start of therapy, through the subsequent MRIs. Across all subjects receiving NAT, in comparison with the pretreatment MRI, the average tumor volume was 26% ± 37% smaller at the second scan session, 65% ± 28% smaller at the third scan session, and 68% ± 29% smaller at the fourth scan session (P = .02). Histograms of MTR values from all tumor voxels of all subjects are displayed in Figure 3B, which show increased dispersion through the course of therapy. Parameters characterizing tumor MTR distributions for all subjects are displayed in Table 2. There was no significant change in mean tumor MTR during therapy (Figure 4A; P = .37). However, the distribution of MTR values revealed an increase in the spread and relative distribution of extreme values as therapy progressed, with increases in standard deviation (Figure 4B; P = .005) and full width at half maximum (Figure 4C; P = .02) and a decrease in kurtosis (Figure 4D; P = .02). The Levene test indicated that the distribution of voxel-level MTR values had unequal variance during NAT (P < .001). There was no significant difference in the 25th (P = .06), 75th (P = .06), or 95th percentile (P = .09) of MTR distribution (Table 2).
Table 2.
Trends in MTR Parameters During NAT
| Averageat Scan 1 | Averageat Scan 2 | Averageat Scan 3 | Averageat Scan 4 | P-Value (from subjects withtumor at all 4 scans) | |
|---|---|---|---|---|---|
| Mean | 28 ± 5 | 27 ± 4 | 29 ± 5 | 31 ± 7 | 0.37 |
| Standard deviation | 11 ± 4 | 11 ± 4 | 13 ± 4 | 12 ± 4 | 0.005 |
| FWHM | 24 ± 9 | 26 ± 9 | 31 ± 10 | 27 ± 10 | 0.02 |
| 25th percentile | 25 ± 6 | 22 ± 5 | 22 ± 9 | 27 ± 7 | 0.06 |
| 75th percentile | 37 ± 9 | 36 ± 6 | 40 ± 11 | 41 ± 7 | 0.06 |
| 95th percentile | 49 ± 11 | 48 ± 9 | 53 ± 14 | 53 ± 11 | 0.09 |
| Kurtosis | 5.59 ± 3.44 | 4.65 ± 2.88 | 3.17 ± 1.00 | 3.49 ± 1.26 | 0.02 |
The averages include all subject scans, while the P-value is from repeated-measures ANOVA, which includes only subjects with data at all 4 scans (n = 12).
Figure 4.
Mean tumoral MTR is similar across all subjects before therapy (first Scan) and at serial scans performed during the course of NAT (second, third, and fourth scans) (A). The standard deviation of tumor MTR values increases with longer duration of NAT (B). Full width half maximum (FWHM) of the distribution of tumor MTR values increases with longer duration of NAT (C). Kurtosis of the distribution of tumor MTR values decreases with longer duration of NAT (D).
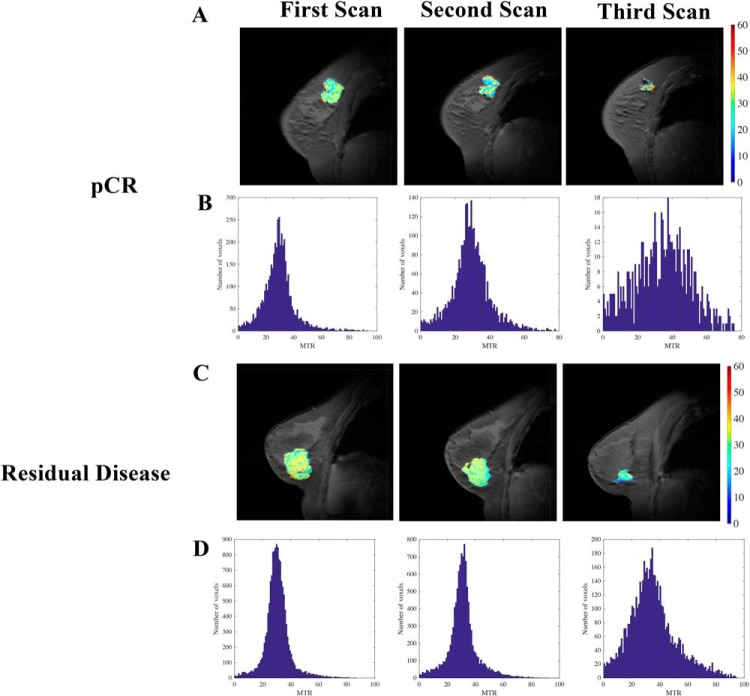
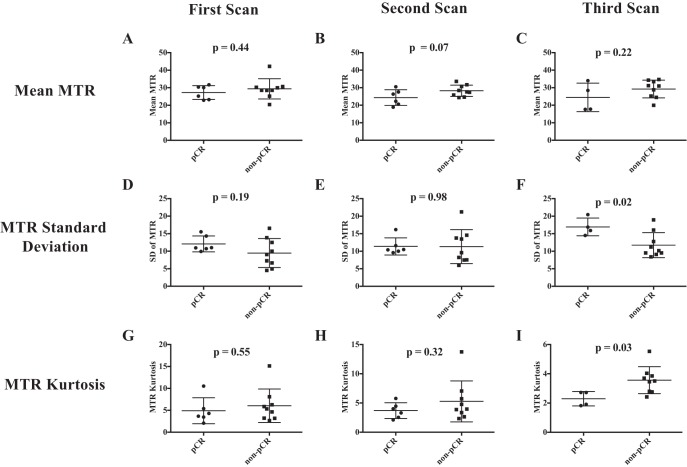
To determine whether alterations in MTR in response to therapy were related with treatment efficacy, we separated the study participants into those who achieved a pCR (n = 6) and those who had residual disease at the conclusion of NAT (non-pCR, n = 9). Note that results from the fourth MRI time point are excluded from this analysis of results stratified by pathological response, as 5 of the subjects no longer had quantifiable residual tumor at the fourth MRI scan. Figure 5 presents example data sets for a patient who achieved pCR (Figure 5A) and 1 who had residual disease (Figure 5C). Of note, while both subjects display regression in tumor size, the patient who achieved pCR had a more heterogeneous MTR distribution throughout the tumor after NAT, as quantified by histogram analysis. This heterogeneity is shown for all patients achieving pCR and residual disease in Figure 5B and 5D, respectively; observe the increased spread in tumor MTR values in the patients achieving pCR after treatment compared with the tumor MTR values in non-pCR patients. The MTR value averaged over the entire tumor was similar in subjects achieving pCR and those with residual disease at the first (Figure 6A; P = .44), second (Figure 6B; P = .07), and third scan sessions (Figure 6C; P = .22). The heterogeneity in MTR values was quantified by standard deviation, showing similar standard deviation at the first (Figure 6D; P = .19) and second scan sessions (Figure 6E; P = .98), but larger standard deviation in patients ultimately achieving pCR who had viable tumor at the third scan session (Figure 6F; P = .02). In addition, the difference in standard deviation between the pCR and non-pCR cohorts (5.19) exceeds the 95% CI found in healthy FGT (1.92), indicating that the difference in standard deviation between the pCR and non-pCR cohorts is not due to intraindividual variation. Furthermore, 2 sample F tests comparing all voxel-level MTR values from subjects achieving pCR versus those who did not achieve pCR showed significantly different variance at the first, second, and third scan sessions (P < .05, all scans). The kurtosis of the MTR distribution was similar at the first (Figure 6G; P = .55) and second scan sessions (Figure 6H; P = .32), but lower in the 4 patients who ultimately achieved pCR at the third scan session (Figure 6I; P = .03). The MTR values of the non-pCR group at the third MRI time point, when truncated to be the same number of voxels as the pCR group at the third MRI, showed a smaller standard deviation (0.09) than the pCR distribution (0.15), indicating that the increased spread in the pCR distribution is not solely due to a smaller sample size. Furthermore, the standard deviation of the truncated non-pCR distribution was similar to that of the full non-pCR distribution at the third MRI time point, suggesting that the smaller numbers of voxels in patients achieving pCR were not driving increased dispersion of MTR values.
Figure 5.
Example MTR maps from (A) a subject who achieved pathological complete response and (C) a subject who had residual disease at the conclusion of therapy at the first, second, and third scan sessions. Histograms of voxel distributions of MTR at the first, second, and third MRI scans for all patients who achieved pathological complete response (B) and all patients who had residual disease (bottom row) show increased heterogeneity in the patients who achieved pCR compared with histograms of those who had residual disease (D).
Figure 6.
Average tumoral MTR values are similar at the first (A), second (B), and third scan (C) sessions in patients who achieved pathological complete response (pCR) and those who had residual disease at the conclusion of therapy. The standard deviation of the distribution of tumor MTR values at the first (D), second (E), and third (F) scan sessions show higher standard deviation at the third scan session in patients who achieved pCR. The kurtosis of the distribution of tumor MTR values at the first (G), second (H), and third (I) scan sessions show lower kurtosis at the third scan session in patients who achieved pCR.
Discussion
To the best of our knowledge, this study is the first application of MT-MRI to assess the repeatability and reproducibility of the healthy breast tissue, as well as changes to breast tumors in response to therapy. Furthermore, this was accomplished in imaging clinics from the community setting (ie, not in the environment of an academic research center). In response to NAT, the distribution of tumor MTR values is more heterogeneous, with an increasing number of voxels exhibiting more extreme values of the MTR. Furthermore, the increased dispersion of MTR throughout the tumor is more pronounced in patients who display complete response to therapy, indicating that alterations in intratumoral MTR may reflect successful treatment response. Collectively, these findings indicate that MT-MRI may provide important information regarding tumor response to NAT and can be integrated into current standard-of-care therapeutic monitoring paradigms.
The primary finding of this study, that the tumor displays increased heterogeneity of MTR values during the course of NAT while the mean tumor MTR value is unchanged, suggests that MTR reflects a heterogeneous response throughout the tumor. The increased heterogeneity in MTR distribution found in patients achieving pCR compared with that in patients with residual disease at the end of NAT exceeds the heterogeneity found in repeatability studies of healthy breast, suggesting that the results found are not due solely to intraindividual variation. We hypothesize that areas with high MTR after therapy may reflect fibrotic areas, whereas areas with low MTR after therapy may reflect edematous areas remaining after tumor death. When performed at the conclusion of chemoradiation of rectal tumors, MTR has shown increased values in fibrotic tissue and lower values in edematous tissue (23). Breast cancer chemotherapy is also considered to induce fibrosis, owing to remodeling of the extracellular matrix by increasing expression of fibulin (24) and formation of cancer-associated fibroblasts that secrete fibronectin and collagen (25). Higher concentrations of these macromolecules would be expected to result in higher MTR values. Alternately, diffusion-weighted MRI has shown increased water diffusion in breast tumors after chemotherapy, reflecting cell necrosis (14). Correlative studies comparing results from diffusion-weighted MRI and MT-MRI on a voxel-wise basis are underway to further investigate mechanisms of altered MTR after therapy.
The MTR parameter quantified in this study is semiquantitative in nature, in contrast with quantitative magnetization transfer (qMT) techniques that model the magnetization transfer process to separate relaxation and exchange rates and ultimately derive the concentration of macromolecules relative to free water (26). In contrast, MTR depends on both frequency and power of the saturation pulse used during image acquisition, as well as the relaxation and exchange rates of the tissue (4). Thus, although the MTR values in this study can be compared across patients as they were performed on the same scanner with identical acquisition parameters, these MTR values calculated cannot be generalized across sites with different scanner hardware or protocols. MTR was used in this study owing to its fast acquisition time (<2 minutes) and the fact that this study was performed at community imaging centers, which do not typically have the capability to patch scanners with novel pulse programs necessary to perform qMT. Notably, a previous study of qMT in human FGT found repeatability metrics similar to those calculated for MTR in this experiment (27). Future studies using qMT to investigate changes in tumors in response to therapy are currently being performed to generalize these results across sites.
This study is subject to a number of limitations. The composition of breast tissue is known to change with age (28), as well as through the course of the menstrual cycle (29), which could influence the results in this study. We found a nonsignificant trend toward increasing MTR in FGT of younger patients; however, there was no relationship between MTR measurements in tumors and patient age. MTR reproducibility measurements were not made at fixed points in the menstrual cycle, which may affect the reproducibility of our measurements. However, previous studies indicated that the MTR of FGT does not vary across different phases of the menstrual cycle (30). Furthermore, measurements in the breast tumors of patients undergoing NAT are not expected to be affected by menstrual cycle fluctuations, as patients often experience amenorrhea owing to chemotherapy (31).
In summary, this study shows the potential of MT-MRI for assessing changes to breast tumors induced by chemotherapy and that these measurements are repeatable and reproducible across time and scanners. These measurements were made in community radiology clinics, showing the potential for widespread clinical dissemination.
Acknowledgments
We thank the National Cancer Institute for support through U01CA174706 and U01CA142565. We thank the Cancer Prevention and Research Institute of Texas (CPRIT) for funding through RR160005. We thank Dr. Vibhas Deshpande with Siemens Healthineers for assistance with developing the imaging protocol and helpful discussions.
Disclosure: No disclosures to report.
Conflict of Interest: The authors have no conflict of interest to declare.
Footnotes
- NAT
- Neoadjuvant therapy
- MTR
- magnetization transfer ratio
- MT-MRI
- magnetization transfer magnetic resonance imaging
- MRI
- magnetic resonance imaging
- TR
- repetition time
- TE
- echo time
- MT
- magnetization transfer
- pCR
- pathological complete response
- qMT
- quantitative magnetization transfer
References
- 1. Sled JG. Modelling and interpretation of magnetization transfer imaging in the brain. Neuroimage. 2018;182:128–135. [DOI] [PubMed] [Google Scholar]
- 2. Bonini RH, Zeotti D, Saraiva LA, Trad CS, Filho JM, Carrara HH, de Andrade JM, Santos AC, Muglia VF. Magnetization transfer ratio as a predictor of malignancy in breast lesions: preliminary results. Magn Reson Med. 2008;59:1030–1034. [DOI] [PubMed] [Google Scholar]
- 3. Wolff SD, Balaban RS. Magnetization transfer contrast (MTC) and tissue water proton relaxation in vivo. Magn Reson Med. 1989;10:135–144. [DOI] [PubMed] [Google Scholar]
- 4. Henkelman RM, Stanisz GJ, Graham SJ. Magnetization transfer in MRI: a review. NMR Biomed. 2001;14:57–64. [DOI] [PubMed] [Google Scholar]
- 5. Filippi M, Rocca MA. Magnetization transfer magnetic resonance imaging in the assessment of neurological diseases. J Neuroimaging. 2004;14:303–313. [DOI] [PubMed] [Google Scholar]
- 6. Callicott C, Thomas JM, Goode AW. The magnetization transfer characteristics of human breast tissues: an in vitro NMR study. Phys Med Biol. 1999;44:1147–1154. [DOI] [PubMed] [Google Scholar]
- 7. Santyr GE, Kelcz F, Schneider E. Pulsed magnetization transfer contrast for MR imaging with application to breast. J Magn Reson Imaging. 1996;6:203–212. [DOI] [PubMed] [Google Scholar]
- 8. Heller SL, Moy L, Lavianlivi S, Moccaldi M, Kim S. Differentiation of malignant and benign breast lesions using magnetization transfer imaging and dynamic contrast-enhanced MRI. J Magn Reson Imaging. 2013;37:138–145. [DOI] [PMC free article] [PubMed] [Google Scholar]
- 9. Hanahan D, Weinberg RA. Hallmarks of cancer: the next generation. Cell. 2011;144:646–674. [DOI] [PubMed] [Google Scholar]
- 10. Kaushik S, Pickup MW, Weaver VM. From transformation to metastasis: deconstructing the extracellular matrix in breast cancer. Cancer Metastasis Rev. 2016;35:655–667. [DOI] [PMC free article] [PubMed] [Google Scholar]
- 11. Martincich L, Montemurro F, Cirillo S, Marra V, De Rosa G, Ponzone R, Aglietta M, Regge D. Role of magnetic resonance imaging in the prediction of tumor response in patients with locally advanced breast cancer receiving neoadjuvant chemo-therapy. Radiol Med. 2003;106:51–58. [PubMed] [Google Scholar]
- 12. Prevos R, Smidt ML, Tjan-Heijnen VC, van Goethem M, Beets-Tan RG, Wildberger JE, Lobbes MB. Pre-treatment differences and early response monitoring of neoadjuvant chemotherapy in breast cancer patients using magnetic resonance imaging: a systematic review. Eur Radiol. 2012;22:2607–2616. [DOI] [PubMed] [Google Scholar]
- 13. Virostko J, Hainline A, Kang H, Arlinghaus LR, Abramson RG, Barnes SL, Blume JD, Avery S, Patt D, Goodgame B, Yankeelov TE, Sorace AG. Dynamic contrast-enhanced magnetic resonance imaging and diffusion-weighted magnetic resonance imaging for predicting the response of locally advanced breast cancer to neoadjuvant therapy: a meta-analysis. J Med Imaging (Bellingham). 2018;5:011011. [DOI] [PMC free article] [PubMed] [Google Scholar]
- 14. Pickles MD, Gibbs P, Lowry M, Turnbull LW. Diffusion changes precede size reduction in neoadjuvant treatment of breast cancer. Magn Reson Imaging. 2006;24:843–847. [DOI] [PubMed] [Google Scholar]
- 15. Delille JP, Slanetz PJ, Yeh ED, Halpern EF, Kopans DB, Garrido L. Invasive ductal breast carcinoma response to neoadjuvant chemotherapy: noninvasive monitoring with functional MR imaging pilot study. Radiology. 2003;228:63–69. [DOI] [PubMed] [Google Scholar]
- 16. Padhani AR, Hayes C, Assersohn L, Powles T, Makris A, Suckling J, Leach MO, Husband JE. Prediction of clinicopathologic response of breast cancer to primary chemotherapy at contrast-enhanced MR imaging: initial clinical results. Radiology. 2006;239:361–374. [DOI] [PubMed] [Google Scholar]
- 17. Li X, Abramson RG, Arlinghaus LR, Kang H, Chakravarthy AB, Abramson VG, Farley J, Mayer IA, Kelley MC, Meszoely IM, Means-Powell J, Grau AM, Sanders M, Yankeelov TE. Multiparametric magnetic resonance imaging for predicting pathological response after the first cycle of neoadjuvant chemotherapy in breast cancer. Invest Radiol. 2015;50:195–204. [DOI] [PMC free article] [PubMed] [Google Scholar]
- 18. Wu LA, Chang RF, Huang CS, Lu YS, Chen HH, Chen JY, Chang YC. Evaluation of the treatment response to neoadjuvant chemotherapy in locally advanced breast cancer using combined magnetic resonance vascular maps and apparent diffusion coefficient. J Magn Reson Imaging. 2015;42:1407–1420. [DOI] [PubMed] [Google Scholar]
- 19. Koenig SH, Brown RD 3rd, Ugolini R. Magnetization transfer in cross-linked bovine serum albumin solutions at 200 MHz: a model for tissue. Magn Reson Med. 1993;29:311–316. [DOI] [PubMed] [Google Scholar]
- 20. Sorace AG, Wu C, Barnes SL, Jarrett AM, Avery S, Patt D, Goodgame B, Luci JJ, Kang H, Abramson RG, Yankeelov TE, Virostko J. Repeatability, reproducibility, and accuracy of quantitative MRI of the breast in the community radiology setting. J Magn Reson Imaging. 2018. [Epub ahead of print]. [DOI] [PMC free article] [PubMed] [Google Scholar]
- 21. Chen W, Giger ML, Bick U. A fuzzy c-means (FCM)-based approach for computerized segmentation of breast lesions in dynamic contrast-enhanced MR images. Acad Radiol. 2006;13:63–72. [DOI] [PubMed] [Google Scholar]
- 22. Al-Radaideh A, Mougin OE, Lim SY, Chou IJ, Constantinescu CS, Gowland P. Histogram analysis of quantitative T1 and MT maps from ultrahigh field MRI in clinically isolated syndrome and relapsing-remitting multiple sclerosis. NMR Biomed. 2015;28:1374–1382. [DOI] [PubMed] [Google Scholar]
- 23. Martens MH, Lambregts DM, Papanikolaou N, Alefantinou S, Maas M, Manikis GC, Marias K, Riedl RG, Beets GL, Beets-Tan RG. Magnetization transfer imaging to assess tumour response after chemoradiotherapy in rectal cancer. Eur Radiol. 2016;26:390–397. [DOI] [PMC free article] [PubMed] [Google Scholar]
- 24. Pupa SM, Giuffré S, Castiglioni F, Bertola L, Cantú M, Bongarzone I, Baldassari P, Mortarini R, Argraves WS, Anichini A, Menard S, Tagliabue E. Regulation of breast cancer response to chemotherapy by fibulin-1. Cancer Res. 2007;67:4271–4277. [DOI] [PubMed] [Google Scholar]
- 25. Peiris-Pages M, Sotgia F, Lisanti MP. Chemotherapy induces the cancer-associated fibroblast phenotype, activating paracrine Hedgehog-GLI signalling in breast cancer cells. Oncotarget. 2015;6:10728–10745. [DOI] [PMC free article] [PubMed] [Google Scholar]
- 26. Sled JG, Pike GB. Quantitative imaging of magnetization transfer exchange and relaxation properties in vivo using MRI. Magn Reson Med. 2001;46:923–931. [DOI] [PubMed] [Google Scholar]
- 27. Arlinghaus LR, Dortch RD, Whisenant JG, Kang H, Abramson RG, Yankeelov TE. Quantitative magnetization transfer imaging of the breast at 3.0 T: reproducibility in healthy volunteers. Tomography. 2016;2:260–266. [DOI] [PMC free article] [PubMed] [Google Scholar]
- 28. Hart BL, Steinbock RT, Mettler FA Jr., Pathak DR, Bartow SA. Age and race related changes in mammographic parenchymal patterns. Cancer. 1989;63:2537–2539. [DOI] [PubMed] [Google Scholar]
- 29. White E, Velentgas P, Mandelson MT, Lehman CD, Elmore JG, Porter P, Yasui Y, Taplin SH. Variation in mammographic breast density by time in menstrual cycle among women aged 40-49 years. J Natl Cancer Inst. 1998;90:906–910. [DOI] [PubMed] [Google Scholar]
- 30. Clendenen TV, Kim S, Moy L, Wan L, Rusinek H, Stanczyk FZ, Pike MC, Zeleniuch-Jacquotte A. Magnetic resonance imaging (MRI) of hormone-induced breast changes in young premenopausal women. Magnetic resonance imaging. 2013;31:1–9. [DOI] [PubMed] [Google Scholar]
- 31. Rose DP, Davis TE. Ovarian function in patients receiving adjuvant chemotherapy for breast cancer. Lancet. 1977;1:1174–1176. [DOI] [PubMed] [Google Scholar]


