

Graphical abstract
Keywords: Confidence interval test, Four-gamete test, Genome-wide association study, NARAC, Rheumatoid arthritis, Solid spine of linkage disequilibrium
Highlights
-
•
Haplotype blocks methods plays a complementary role to the single-SNP approaches.
-
•
CIT, FGT, SSLD, and single-SNP methods should be applied to discover the markers.
-
•
Selection of the method used for the association has an impact on the biomarkers.
-
•
SSLD method detected more significant SNPs than CIT, FGT, and single-SNP methods.
-
•
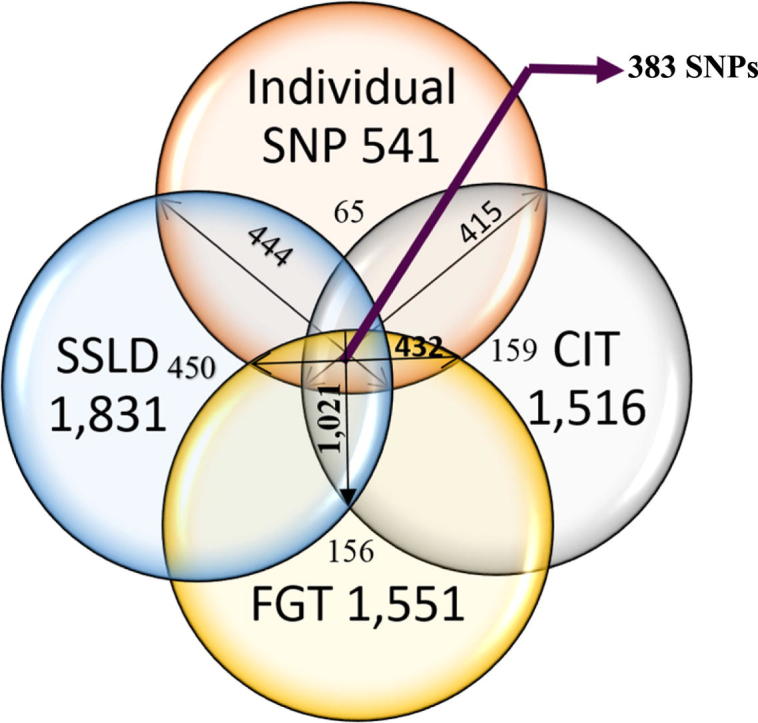
The 383 SNPs discovered by all methods are significantly associated with RA.
Abstract
The human genome, which includes thousands of genes, represents a big data challenge. Rheumatoid arthritis (RA) is a complex autoimmune disease with a genetic basis. Many single-nucleotide polymorphism (SNP) association methods partition a genome into haplotype blocks. The aim of this genome wide association study (GWAS) was to select the most appropriate haplotype block partitioning method for the North American Rheumatoid Arthritis Consortium (NARAC) dataset. The methods used for the NARAC dataset were the individual SNP approach and the following haplotype block methods: the four-gamete test (FGT), confidence interval test (CIT), and solid spine of linkage disequilibrium (SSLD). The measured parameters that reflect the strength of the association between the biomarker and RA were the P-value after Bonferroni correction and other parameters used to compare the output of each haplotype block method. This work presents a comparison among the individual SNP approach and the three haplotype block methods to select the method that can detect all the significant SNPs when applied alone. The GWAS results from the NARAC dataset obtained with the different methods are presented. The individual SNP, CIT, FGT, and SSLD methods detected 541, 1516, 1551, and 1831 RA-associated SNPs respectively, and the individual SNP, FGT, CIT, and SSLD methods detected 65, 156, 159, and 450 significant SNPs respectively, that were not detected by the other methods. Three hundred eighty-three SNPs were discovered by the haplotype block methods and the individual SNP approach, while 1021 SNPs were discovered by all three haplotype block methods. The 383 SNPs detected by all the methods are promising candidates for studying RA susceptibility. A hybrid technique involving all four methods should be applied to detect the significant SNPs associated with RA in the NARAC dataset, but the SSLD method may be preferred because of its advantages when only one method was used.
Introduction
RA, a chronic autoimmune disease that affects the body’s joints and bones, is considered to have a genetic basis. Genetic association studies are used to detect RA biomarkers, and SNPs are used as biomarkers for detecting RA. The number of these nucleotide morphisms is larger in RA patients than in healthy controls. These SNPs are in or near genes that commonly play a role in immunity. Most of these genes are linked to RA pathogenesis [1], [2], [3], [4].
The rapid progress in genotyping technologies has resulted in an ever-increasing volume of genotyped SNPs, which has led to advances in the understanding of complex diseases (such as RA) and represents a challenge for the future [5]. Single SNP methods are the main techniques used to identify RA biomarkers. Recently, the ability to obtain a high genomic density of SNPs (representing big data) has led to the application of haplotype block methods. These methods are applied to discover RA associations with a block rather than an SNP. A haplotype block consists of nearby SNPs that have high inter-relationships with one another. The parameter representing these relationships is the linkage disequilibrium (LD) [6], [7], [8].
The objective of the present work was to apply the individual SNP approach and three haplotype block methods to the NARAC dataset to identify RA biomarkers through a GWAS [9]. GWAS results represent a domain of big data with millions of SNPs tested against many phenotypes. These results have become a burden for bioinformaticians in terms of processing time and real-time visualization [10], [11].
The applied haplotype block methods were CIT, FGT, and SSLD. After stringent Bonferroni correction for multiple comparisons (less than 0.05 per the number of comparisons), P-values were calculated to measure the strength of association between the genetic variants and RA susceptibility [12]. In addition, the block size (in base pair (bp) and the included number of SNPs), number of blocks, percentage of SNPs not covered by the block method, percentage of significant blocks in the total number of blocks, number of significant haplotypes and SNPs were compared among the three haplotype block methods.
Material and methods
Study population
The NARAC dataset consisted of 2062 participants (1493 female and 569 male), grouped into 868 RA patients and 1194 healthy controls. All cases and controls were Caucasian [13]. The studied genetic variants were 545,080 SNPs included in the whole genome. Because allosomes (sex chromosomes (Chrs)) were outside of this research focus, 531,689 SNPs were retained for the study. After removing 22,276 SNPs because they met at least one of the following biomarker characteristics, 509,413 SNPs remained for further analysis:
-
(1)
Less than 75% genotype match [14],
-
(2)
Less than 0.001 Hardy-Weinberg equilibrium (HWE) P-value [15] or
-
(3)
Less than 0.001 minor allele frequency (MAF) in the total sample [16].
The NARAC dataset represents a big data challenge because of its size and complexity. A way to handle such a challenge is to place the raw GWAS data for every Chr into a separate file. Then, each file is processed using GWAS software. Finally, the results for all the Chrs are merged together. A snapshot of the NARAC (raw) dataset is shown in Fig. 1.
Fig. 1.
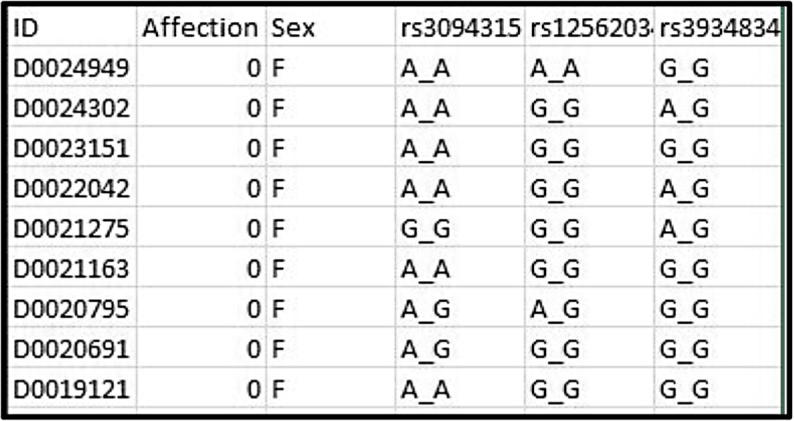
Snapshot of the NARAC dataset showing 10 samples with their corresponding 3 SNPs. The first column represents the individuals’ IDs. The second column refers to the affection status (0: case, 1: control). The third column shows the sex (F: female, M: male). The next columns correspond to the SNPs, with the first row providing the SNP ID. In each SNP cell, two identical alleles represent a homozygote, whereas two different alleles represent a heterozygote.
Material
For the NARAC dataset, each Chr data file was extracted from the NARAC data file using the programming language Perl. All Chr data files were reformatted for processing by the program PLINK in the statistical package R 3.1.0. The R language was used to extract all the Chrs map files from the NARAC map file (SNP ID, physical position, and Chr number). Each reformatted Chr data and map files were processed by PLINK 1.07 and gPLINK 2.05 in preparation for processing by the program Haploview 4.2 [17].
Haploview 4.2 was used to partition all the Chrs into successive blocks using the CIT, FGT, and SSLD methods; to calculate the corresponding P-values for each haplotype in each block; to apply the individual SNP approach; to calculate the corresponding P-value for each SNP; and to display the LD results [18]. The default parameters for the three haplotype block methods were used. The RA-associated SNPs determined by using the individual SNP approach were highlighted on a Manhattan plot generated using R [19]. The significant blocks and the associated SNPs were selected using MATLAB release 2010a. Fig. 2 shows a block diagram of the entire association analysis. The DAVID (database for annotation, visualization and integrated discovery) bioinformatics resources 6.8 was operated to perform a functional pathway analysis and a disease enrichment analysis [20], [21].
Fig. 2.

Summary of the proposed system for the NARAC dataset.
Testing for associations with RA susceptibility
Both individual SNP associations and haplotype associations were measured with the aid of P-values. Statistically significant SNPs were detected using their corresponding P-values after stringent Bonferroni correction for multiple comparisons (less than 0.05 per the number of comparisons).
Results
Four methods were applied to the NARAC dataset: the individual SNP approach and three haplotype block methods. The three block methods were FGT, CIT, and SSLD. The measured parameter was the P-value after Bonferroni correction. The three haplotype block methods were compared on the basis of the block size (in bp or number of SNPs), number of blocks, percentage of uncovered SNPs, percentage of significant blocks, percentage of significant haplotypes, and number of associated SNPs.
The test algorithms were applied on an Intel Core i7-4720HQ 2.6 GHz system with 16 GB of RAM. Table S1 lists the processing time for each program. The total working time for all Chrs was 3353 min (approximately 56 h). Table S2 shows the significance level after Bonferroni correction for multiple comparisons (0.05/total number of comparisons). The results related to the haplotype block methods are shown in Tables S3–S24. FGT partitioned the twenty-two Chrs into more blocks (99,856 blocks) than CIT (93,422 blocks) and SSLD (86,179 blocks). On average, the SSLD blocks included more SNPs per Chr (5 SNPs) than FGT (4 SNPs) and CIT (3 SNPs).
As shown in Table 1, the median block size per Chr was larger for SSLD (12,046 bp) than for FGT (8328 bp) and CIT (7368 bp), confirming the greater genomic coverage by SSLD blocks. These results were checked for significance using Kruskal–Wallis test by ranks. The Kruskal–Wallis test showed the presence of statistically significant difference in the distribution of the median block size among the three methods (P-value = 1.39 × 10−09). Using Wilcoxon rank sum test, the differences between (FGT and SSLD), (CIT and SSLD), and (CIT and FGT) were statistically significant (P-values = 1.986 × 10−07, 1.515 × 10−08, and 0.009, respectively).
Table 1.
Results of the median block size (in bp) by all three block methods for the general blocks and the significantly associated blocks with RA.
| Chr no. | CIT (General) | FGT (General) | SSLD (General) | CIT (Significant) | FGT (Significant) | SSLD (Significant) |
|---|---|---|---|---|---|---|
| 1 | 8489 | 9547 | 13,549 | 64,634 | 47,700 | 34,467 |
| 2 | 8495 | 9645 | 14,342 | 24,123 | 11,756 | 23,312 |
| 3 | 7938 | 9240 | 13,544 | 7513 | 11,854 | 13,800 |
| 4 | 9947 | 11,083 | 13,544 | 3279 | 3279 | 0 |
| 5 | 8641 | 9697 | 14,102 | 22,052 | 15,381 | 18,456 |
| 6 | 8457 | 9583 | 13,944 | 8672 | 7448 | 10,123 |
| 7 | 8235 | 9008 | 13,869 | 27,949 | 4326 | 32,616 |
| 8 | 7149 | 7971 | 12,262 | 15,280 | 14,404 | 10,115 |
| 9 | 6324 | 7166 | 10,297 | 10,662 | 15,473 | 13,315 |
| 10 | 7464 | 8392 | 12,231 | 2462 | 669 | 9719 |
| 11 | 7764 | 8634 | 12,455 | 9746 | 9504 | 0 |
| 12 | 8043 | 8898 | 13,281 | 5705 | 5705 | 10,091 |
| 13 | 8346 | 9134 | 13,410 | 9913 | 4663 | 32,705 |
| 14 | 7458 | 8443 | 12,747 | 18,225 | 12,316 | 18,225 |
| 15 | 6151 | 7336 | 10,451 | 9321 | 11,213 | 14,822 |
| 16 | 4912 | 5562 | 8984 | 24,155 | 6893 | 64,712 |
| 17 | 6263 | 7535 | 9997 | 12,690 | 57,213 | 18,594 |
| 18 | 6811 | 7962 | 11,379 | 0 | 8210 | 11,265 |
| 19 | 6760 | 7930 | 10,833 | 9571 | 10,633 | 18,621 |
| 20 | 6413 | 6933 | 10,563 | 7448 | 6133 | 21,323 |
| 21 | 6784 | 7552 | 10,871 | 13,020 | 11,817 | 4704 |
| 22 | 5272 | 5986 | 8381 | 9298 | 10,650 | 24,936 |
Although, SSLD produced the lowest number of blocks, due to its median block size and median number of SNPs within each block, 95.68% of the genotyped SNPs were localized with SSLD, compared to 87.74% with FGT and 77.88% with CIT. Accordingly, the density of the genotyped SNPs was sufficient for haplotype association mapping. The lowest number of studied SNPs needed for GWASs is 100,000 [15] which was attained by the four methods. Considerable variation in the haplotype block structure across the twenty-two Chrs was uncovered, with block sizes ranging from 2 bp (for the three methods) to 498,545 bp for FGT, 498,091 bp for SSLD, and 499,937 bp for CIT.
FGT generated more significant haplotypes (437 haplotypes) than CIT (396 haplotypes) and SSLD (383 haplotypes) for the twenty-two Chrs. As shown in Tables S3–S24, the average percentage of significant blocks in the total number of blocks per Chr was higher for FGT (0.248%) than for CIT (0.241%) and SSLD (0.226%). Fig. 3 shows the significant blocks obtained with the three haplotype block methods for the twenty-two Chrs. For each Chr, the total number of significant blocks, the total number of associated SNPs, and the total sizes of the significant blocks (in bp) are shown in Fig. 3a–c respectively.
Fig. 3.

Comparison of the RA-associated results obtained by the three haplotype block partitioning methods. (a) The total number of significant blocks for each Chr. (b) The total number of associated SNPs for each Chr. (c) The total significant blocks size in bp for each Chr.
On average, the significant SSLD blocks included more SNPs per Chr (6 SNPs) than the significant FGT (4 SNPs) and CIT (4 SNPs) blocks. The median significant block size for the twenty-two Chrs was larger for SSLD (32,550 bp) than for CIT (14,350 bp) and FGT (13,055 bp). These results were checked for significance using Kruskal–Wallis test by ranks. The difference among the three groups determined using Kruskal–Wallis was not statistically significant (P-value = 0.077).
The minimum significant block size for the twenty-two Chrs was larger for SSLD (52 bp for Chr 8) than for FGT (26 bp for Chr 6) and CIT (15 bp for Chr 11). The maximum significant block size was larger for SSLD (344,667 bp for Chr 1) than for FGT (318,113 bp for Chr 3) and CIT (209,237 bp for Chr 6). The significant SSLD blocks included more associated SNPs (1831 SNPs) than the significant FGT (1551 SNPs) and CIT (1516 SNPs) blocks. In addition, the number of associated SNPs determined by the individual SNP approach was 541, as shown in Table 2. The number of significant SNPs discovered by only the SSLD method (450 SNPs) was greater than that by the CIT (159 SNPs), FGT (156 SNPs), and individual SNP (65 SNPs) methods, as shown in Fig. 4.
Table 2.
Results of the individual SNP approach compared to all three block methods.
| Chr no. | Total no. of significant SNPs obtained by the individual SNP method | No. of significant SNPs obtained by only the individual SNP method | No. of significant SNPs obtained by all three block methods | No. of significant SNPs obtained by all four methods |
|---|---|---|---|---|
| 1 | 4 | 3 | 8 | 1 |
| 2 | 2 | 2 | 0 | 0 |
| 3 | 5 | 3 | 7 | 0 |
| 4 | 5 | 2 | 0 | 0 |
| 5 | 6 | 4 | 8 | 2 |
| 6 | 432 | 12 | 916 | 367 |
| 7 | 7 | 3 | 2 | 0 |
| 8 | 11 | 3 | 14 | 1 |
| 9 | 11 | 4 | 16 | 7 |
| 10 | 5 | 2 | 0 | 0 |
| 11 | 2 | 1 | 0 | 0 |
| 12 | 3 | 1 | 6 | 0 |
| 13 | 0 | 0 | 0 | 0 |
| 14 | 5 | 2 | 11 | 1 |
| 15 | 3 | 3 | 5 | 0 |
| 16 | 7 | 5 | 0 | 0 |
| 17 | 4 | 2 | 11 | 0 |
| 18 | 3 | 1 | 0 | 0 |
| 19 | 5 | 2 | 13 | 2 |
| 20 | 8 | 5 | 3 | 1 |
| 21 | 7 | 2 | 0 | 0 |
| 22 | 6 | 3 | 1 | 1 |
Fig. 4.

Number of RA biomarkers detected by each method – “all” biomarkers detected by the method or detected “only” by one method.
Fig. 5 shows the associations across the entire genome, illustrating the big data challenge. The alternating colours (blue and red) distinguish between the end of one Chr and the start of the next Chr. The lower horizontal line in Fig. 5 represents the threshold for suggestive associations (−log10 (10−5)), while the higher line represents the genome-wide significance threshold (−log10 (5 × 10⁻⁸)). The associated SNPs are highlighted in green. As expected, most of the associated SNPs on Chr 6 showed highly significant associations with RA susceptibility (P-values < 0.0001). In contrast, none of the SNPs on Chr 13 showed any association with RA. Chr 6 contained most of the known genetic biomarkers for RA. The top SNP (rs660895) in the human leukocyte antigen (HLA) region (32,685,358 bp), representing the HLA-DRB1/HLA-DQA1, had the lowest P-value (1.03 × 10−113), as previously reported [22], [23], [24], [25].
Fig. 5.

Manhattan plot showing the associations between the whole NARAC SNPs and RA susceptibility using the individual SNP approach. The genes with P-values lower than the genome-wide significance threshold are shown above the plot area.
Discussion
In this study, 509,413 SNPs were used to test the association with RA susceptibility in the NARAC dataset. The examined SNPs belonged to twenty-two autosomes, providing a large data domain. The surveyed SNPs of the NARAC dataset were dense enough for examination by haplotype block methods. Four methods were applied to assign the associations (CIT, FGT, SSLD, and the individual SNP approach).
The aim was to test the NARAC dataset to determine whether haplotype block methods or a single-locus approach alone can sufficiently identify the significant biomarkers associated with RA. This research failed to select the best method because each method resulted in significant findings that were not detected using any of the other methods. The individual SNP, CIT, FGT, and SSLD methods exclusively detected 65, 159, 156, and 450 SNPs respectively. Table S25 shows the SNP IDs that were uniquely identified by each method. These findings were in line with Shim et al.’s (although they did not test the SSLD method) conclusion that both the individual SNP approach and the haplotype block methods should be applied to discover valuable associations in the NARAC dataset [16].
As shown in Table 2, the 383 SNPs that were determined to be significantly associated with RA susceptibility by the individual SNP approach and the haplotype block methods represent good candidates for further investigation. In addition, 1021 RA-associated SNPs were detected by all three haplotype block methods and deserve greater attention. The SSLD method detected more significant SNPs (1831 SNPs) than the FGT (1551 SNPs), CIT (1516 SNPs), and individual SNP (541 SNPs) methods potentially because SSLD does not consider the LD between intermediate SNPs. Therefore, the SSLD method is the least conservative at including SNPs inside the haplotype blocks.
The biomarkers identified by the individual SNP approach with P-values lower than the genome-wide significance threshold (shown in Fig. 5) are given in Table 3 with their corresponding haplotype blocks. Three hundred and twenty biomarkers from Chr six passed the genome-wide significance threshold (data not shown). The SNPs from Chrs 11, 13, 15, 19, and 21 failed to pass the genome-wide significance threshold. Five of the seven biomarkers from Chr 9 were members of a block that was detected by all three block methods. This finding emphasized the association of the PHF19-TRAF1-C5 region with RA [26].
Table 3.
The highly significant SNPs (with P-values lower than the genome-wide significance threshold) discovered by the individual SNP approach with the corresponding haplotype blocks.
| SNP ID | Chr | Position (bp) | Assoc. Allelea | AAFb (Case, Control) | P-valuec | Gene/Nearest Genes | Haplotype Block (Method, P-valuec, No. of SNPs in Block) | Haplotype Block Position (bp) (Start, End, Size) | Previously Studied in |
|---|---|---|---|---|---|---|---|---|---|
| rs2493291 | 1 | 3,352,541 | G | 0.956, 0.881 | 1.56 E-14 | PRDM16 | Not detected by any method | – | [28] |
| rs2476601 | 1 | 114,089,610 | A | 0.155, 0.084 | 1.12 E-12 | PTPN22 | FGT, 8.5 E-13, 8 | 114075501, 114132504, 57,004 | [22], [24], [25], [29], [30], [31], [32], [33] |
| CIT, 1.01 E-11, 10 | 114050631, 114141503, 90,873 | ||||||||
| SSLD, 1.03 E-10, 33 | 113787838, 114132504, 344,667 | ||||||||
| rs12467084 | 2 | 37,860,221 | G | 0.994, 0.964 | 1.12 E-09 | CDC42EP3/FAM82A1 | Not detected by any method | – | – |
| rs6752643 | 2 | 198,949,233 | G | 0.989, 0.956 | 2.94 E-09 | PLCL1/SATB2 | Not detected by any method | – | – |
| rs11915402 | 3 | 58,957,115 | G | 0.995, 0.956 | 8.43 E-13 | C3orf67 | FGT, 1.51 E-07, 20 | 58754521, 59072633, 318,113 | – |
| SSLD, 2.51 E-11, 9 | 58957115, 59057595, 100,481 | ||||||||
| rs512244 | 4 | 12,775,151 | G | 0.195, 0.125 | 3.7 E-09 | HS3ST1/HSP90AB2P | Not detected by any method | – | [22], [31] |
| rs17604670 | 4 | 113,564,881 | G | 0.966, 0.923 | 3.84 E-08 | TIFA | Not detected by any method | – | – |
| rs2278600 | 5 | 71,792,426 | G | 0.930, 0.865 | 3.22 E-10 | ZNF366 | Not detected by any method | – | – |
| rs6596147 | 5 | 133,075,674 | G | 0.820, 0.738 | 1.77 E-09 | FSTL4/C5orf15 | FGT, 3.51 E-06, 9 | 133065358, 133094704, 29,347 | [32], [33], [34], [35] |
| CIT, 2.95 E-06, 9 | 133057095, 133094704, 37,610 | ||||||||
| SSLD, 2.1 E-07, 6 | 133075674, 133094129, 18,456 | ||||||||
| rs2306848 | 7 | 129,556,365 | G | 0.990, 0.948 | 5.95 E-12 | CPA4 | Not detected by any method | – | – |
| rs1830035 | 7 | 63,170,795 | A | 0.996, 0.963 | 1.47 E-11 | ZNF679 | SSLD, 3.6 E-11, 4 | 63138417, 63170795, 32,379 | – |
| rs10275421 | 7 | 100,536,496 | G | 0.991, 0.960 | 8.12 E-09 | FIS1/RABL5 | SSLD, 7.17 E-08, 2 | 100522057, 100536496, 14,440 | – |
| rs11785995 | 8 | 131,021,293 | G | 0.982, 0.938 | 2.18 E-10 | FAM49B | Not detected by any method | – | – |
| rs9785133 | 8 | 20,402,898 | G | 0.916, 0.860 | 3.9 E-08 | LZTS1/LOC286114 | FGT, 1.21 E-07, 6 | 20385189, 20404428, 19,240 | [34] |
| rs872863 | 9 | 123,233,908 | G | 0.993, 0.940 | 2.25 E-16 | DENND1A | Not detected by any method | – | [36] |
| rs7854383 | 9 | 81,666,969 | G | 0.959, 0.906 | 1.42 E-09 | TLE1/FAM75D5 | FGT, 1.69 E-08, 2 | 81666969, 81670581, 3613 | [37] |
| CIT, 1.08 E-07, 2 | 81662684, 81666969, 4286 | ||||||||
| SSLD, 1.21 E-07, 3 | 81662684, 81670581, 7898 | ||||||||
| rs2900180 | 9 | 120,785,936 | A | 0.390, 0.303 | 6.24 E-09 | TRAF1/C5 | FGT, 4.66 E-08, 14 | 120720054, 120810962, 90,909 | [26], [34], [36], [38], [39], [40], [41], [42], [43], [44] |
| CIT, 8.03 E-08, 8 | 120720054, 120807548, 87,495 | ||||||||
| SSLD, 4.5 E-08, 12 | 120720054, 120807548, 87,495 | ||||||||
| rs3761847 | 9 | 120,769,793 | G | 0.468, 0.380 | 1.24 E-08 | TRAF1 | FGT, 4.66 E-08, 14 | 120720054, 120810962, 90,909 | [26], [34], [40], [42], [43], [44], [45], [46], [47], [48], [49], [50], [51] |
| CIT, 8.03 E-08, 8 | 120720054, 120807548, 87,495 | ||||||||
| SSLD, 4.5 E-08, 12 | 120720054, 120807548, 87,495 | ||||||||
| rs881375 | 9 | 120,732,452 | A | 0.388, 0.304 | 2.27 E-08 | PHF19/TRAF1 | FGT, 4.66 E-08, 14 | 120720054, 120810962, 90,909 | [34], [36], [49], [52], [43], [53], [54] |
| CIT, 8.03 E-08, 8 | 120720054, 120807548, 87,495 | ||||||||
| SSLD, 4.5 E-08, 12 | 120720054, 120807548, 87,495 | ||||||||
| rs1953126 | 9 | 120,720,054 | A | 0.387, 0.304 | 2.76 E-08 | PHF19 | FGT, 4.66 E-08, 14 | 120720054, 120810962, 90,909 | [34], [36], [43], [44], [48], [53], [54] |
| CIT, 8.03 E-08, 8 | 120720054, 120807548, 87,495 | ||||||||
| SSLD, 4.5 E-08, 12 | 120720054, 120807548, 87,495 | ||||||||
| rs10760130 | 9 | 120,781,544 | G | 0.475, 0.389 | 3.78 E-08 | TRAF1/C5 | FGT, 4.66 E-08, 14 | 120720054, 120810962, 90,909 | [34], [36], [39], [40], [43], [44], [49], [53], [54], [55] |
| CIT, 8.03 E-08, 8 | 120720054, 120807548, 87,495 | ||||||||
| SSLD, 4.5 E-08, 12 | 120720054, 120807548, 87,495 | ||||||||
| rs4918037 | 10 | 105,403,030 | G | 0.958, 0.897 | 6.12 E-11 | SH3PXD2A | Not detected by any method | – | – |
| rs2671692 | 10 | 49,767,825 | A | 0.677, 0.592 | 2.66 E-08 | WDFY4 | SSLD, 4.84 E-08, 6 | 49767825, 49777543, 9719 | [34], [35], [51], [53] |
| rs10999147 | 10 | 71,550,864 | A | 0.976, 0.939 | 4.16 E-08 | AIFM2 | FGT, 1.91 E-06, 2 | 71550196, 71550864, 669 | – |
| rs4760609 | 12 | 46,702,024 | C | 0.907, 0.819 | 3 E-12 | COL2A1/SENP1 | FGT, 1.23 E-07, 3 | 46700325, 46703575, 3251 | – |
| rs757123 | 12 | 119,263,543 | G | 0.943, 0.888 | 1.72 E-08 | MSI1 | Not detected by any method | – | – |
| rs4264325 | 14 | 104,050,531 | G | 0.997, 0.973 | 1.94 E-08 | KIF26A/C14orf180 | FGT, 5.69 E-06, 8 | 104045894, 104062173, 16,280 | – |
| rs2292327 | 16 | 82,588,153 | G | 0.516, 0.405 | 1.16 E-09 | NECAB2 | Not detected by any method | – | – |
| rs2745106 | 16 | 1,481,462 | G | 0.954, 0.904 | 1.77 E-08 | PTX4/TELO2 | Not detected by any method | – | – |
| rs11868709 | 17 | 73,740,166 | C | 0.817, 0.714 | 7.38 E-11 | TMEM235 | Not detected by any method | – | – |
| rs8087252 | 18 | 44,295,753 | G | 0.924, 0.865 | 7.13 E-09 | ZBTB7C/CTIF | Not detected by any method | – | – |
| rs6018432 | 20 | 35,485,260 | G | 0.956, 0.888 | 3.55 E-13 | SRC/BLCAP | Not detected by any method | – | [56] |
| rs1182531 | 20 | 57,826,397 | C | 0.852, 0.779 | 6.53 E-09 | PHACTR3 | FGT, 1 E-08, 2 | 57826397, 57832814, 6418 | [22], [31], [34], [35], [57] |
| SSLD, 1 E-08, 2 | 57826397, 57832814, 6418 | ||||||||
| rs13054355 | 22 | 20,321,624 | G | 0.930, 0.854 | 6.04 E-12 | SDF2L1 | FGT, 5.08 E-08, 7 | 20264229, 20321624, 57,396 | – |
| CIT, 1.09 E-08, 3 | 20313153, 20321624, 8472 | ||||||||
| SSLD, 1.09 E-06, 3 | 20321624, 20346559, 24,936 | ||||||||
| rs1005133 | 22 | 18,112,909 | G | 0.844, 0.767 | 4.08 E-08 | SEPT5-GP1BB/TBX1 | FGT, 1.02 E-05, 2 | 18112175, 18112909, 735 | – |
| CIT, 1.02 E-05, 2 | 18112175, 18112909, 735 |
Assoc. Allele: Associated Allele.
AAF: Associated Allele Frequency.
P-values are calculated based on the chi-squared test.
In Table 3, the block sizes (in bp) – for the five biomarkers detected in the PHF19-TRAF1-C5 region – determined using the SSLD and CIT methods were the same. However, the SSLD block included more associated SNPs (12) than the CIT block (8), as depicted in Fig. 6. By further investigating this block, the four excluded SNPs by the CIT method were having MAFs less than 0.05 (a default condition in Haploview for the CIT method).
Fig. 6.

Comparison for the CIT and SSLD methods on the same significant haplotype block in the PHF19-TRAF1-C5 region. (a) LD plot showing CIT block comprising eight biomarkers. (b) LD plot for SSLD block including twelve biomarkers.
For the non-Chr 6 biomarkers shown in Table 3, these results were in line with those obtained by Eyre et al. [27] that verified the association of PTPN22 (rs2476601, P-value = 1.12 × 10⁻¹²) with RA for populations of European ancestry. Moreover, these two studies confirm the association of TRAF1 with RA, but for different SNPs. The detected biomarker in the present study was rs3761847 (P-value = 1.24 × 10−08), while rs10739580 (P-value = 1.7 × 10−06) was identified by Eyre et al. These two biomarkers are 163,211 bp apart from each other.
A deeper view had been focused on the genes of the “never been reported” biomarkers in Table 3. Table 4 had been constructed using DAVID 6.8 to relate these genes to RA pathology and to link gene-disease associations. Ten genes were detected to play a role in RA pathology.
Table 4.
Disease enrichment analysis for the genes of the “never been reported” biomarkers.
| Gene name | Region | Functional pathway related to RA | Diseases affected by the gene |
|---|---|---|---|
| CDC42EP3 | 2p21 | Induces pseudopodia formation in fibroblasts | Schizophrenia [59] |
| FAM82A1 | 2p22.2 | Lung cancer [60] | |
| PLCL1 | 2q33 | Affects the bone density and the level of osteocalcin | Osteoporosis, hip bone size variation in females [61], intracranial aneurysm [62] |
| SATB2 | 2q33 | Affects the activity of osteoblasts and the differentiation of immunocytes, plays a role in immune regulation, and elevations in the level of alkaline phosphatase | Cleft palate [63], [64], microdeletion syndrome [65], head and neck squamous cell carcinoma [66], colorectal carcinoma [67], laryngeal carcinoma [68], osteosarcoma [69], pancreatic cancer [70], esophageal carcinoma [71], hepatocellular carcinoma [72], HIV/AIDS infection [73], renal cell carcinoma [74], neuroendocrine tumors [75] |
| C3orf67 | 3p14.2 | ||
| TIFA | 4q25 | Plays a role in the activation of IL-1, TRAF6, and IKK, affects the activation of NF-kappa-B | |
| ZNF366 | 5q13.2 | Plays a role in regulating the expression of genes in response to estrogen, affects the differentiation of dendritic cells and the production of IL-4, IL-10, IL-12, and NF-kappa-B | Osteoporosis [76], breast cancer [77], prostate cancer [78] |
| CPA4 | 7q32 | Benign hypertrophic prostate, prostate cancer [79] | |
| ZNF679 | 7q11.21 | ||
| FIS1 | 7q22.1 | Alzheimer's disease [80], leukemia [81], thyroid tumors [82] | |
| RABL5 | 7q22.1 | ||
| FAM49B | 8q24.21 | Endometriosis [83] | |
| SH3PXD2A | 10q24.33 | Affects the activity of osteoclast | Breast cancer, melanoma [84], glioma [85], pre-eclampsia [86], lung adenocarcinoma [87], prostate cancer [88], colon cancer [89] |
| AIFM2 | 10q22.1 | Ovarian cancer, retinoblastoma [90] | |
| COL2A1 | 12q13.11 | Plays a role in the activation of IL-6, Osteoarthritis, chondrodysplasia, epiphyseal dysplasia, joint deformity, spondyloepiphyseal dysplasia | Stickler and Wagner syndromes [91], chondrosarcomas [92], osteonecrosis of the femoral head [93], pathological myopia [94], congenital toxoplasmosis [95], Czech dysplasia [96], Legg-Calvé-Perthes [97] |
| SENP1 | 12q13.1 | Plays a role in the activation of IL-6 | Prostate cancer [98], leukemia, hepatoma [99] |
| MSI1 | 12q24.1-q24.31 | Liver cancer, hepatoma, glioma and melanoma [100], neurodegenerative disorders [101], Helicobacter pylori infection [102], cervical carcinoma [103], endometriosis and endometrial carcinoma [104], medulloblastoma [105] | |
| KIF26A | 14q32.33 | ||
| C14orf180 | 14q32.33 | ||
| NECAB2 | 16q23.3 | ||
| PTX4 | 16p13.3 | ||
| TELO2 | 16p13.3 | Glioma [106], intellectual disability [107], You-Hoover-Fong syndrome [108] | |
| TMEM235 | 17q25.3 | Cataract [109] | |
| ZBTB7C | 18q21.1 | Sepsis [110], kidney cancer [111], cerebral ischemia [112] | |
| CTIF | 18q21.1 | Hearing function [113] | |
| SDF2L1 | 22q11.21 | Insulinoma [114] | |
| SEPT5 | 22q11.21 | Involved in cytokinesis | Juvenile parkinsonism [115], pancreatic neoplasm [116], vitreoretinopathy [117], Parkinson's disease [118] |
| GP1BB | 22q11.21-q11.23 | Bernard-Soulier syndrome [119], Velocardiofacial syndrome [120], developmental delay, cardiac defects, dysmorphic facial features, palatal anomalies, hypocalcemia, and immune deficiency [121] | |
| TBX1 | 22q11.21 | expands T lymphocytes activity, affects the activity of fibroblastic growth factor | DiGeorge syndrome, pharyngeal and aortic arch defects [122], Velocardiofacial syndrome [123], psychiatric disorders [124], lung tumor [125], Tetralogy of Fallot [126], Conotruncal heart defects [127], ventricular septal defect [128], renal malformations [129], adenoid cystic carcinoma [130], cleft palate [131], indirect inguinal hernia [132], prostate cancer [133] |
As shown in Table 4, TBX1 played a role in RA pathology through its immunological function. A study by Meziani et al. confirmed the association of TBX1 (rs4819522, P-value = 0.0014) with RA in both Japanese and Europeans using a meta-analysis [58]. The identified SNP in the present study (rs1005133, P-value = 4.08 × 10−08) was in a close proximity with the SNP obtained by Meziani et al. (28,427 bp). As shown in Table 3, rs1005133 was in a block with another SNP (rs5993820) detected by CIT and FGT methods. An LD plot was performed for the region that contained these two SNPs for unravelling other associations in that region from Chr 22. As depicted in Fig. 7, rs4819522 was neither in strong LD with rs1005133 (D′ = 0.2, r2 = 0.035) nor with rs5993820 (D′ = 0.411, r2 = 0.021).
Fig. 7.

LD plot for the TBX1 region showing a biomarker in this study (rs1005133) and a previously detected biomarker (rs4819522).
The block similarity for the three applied methods of haplotype block partitioning are shown in Table 5. The similarity measure represents the SNPs detected by both methods in question divided by the total SNPs detected by the two methods. The highest block similarity was between CIT and FGT (mean ± SD = 0.464 ± 0.286). The block similarity between FGT and SSLD (mean ± SD = 0.21 ± 0.216) was nearly equal to that between CIT and SSLD (mean ± SD = 0.205 ± 0.193). The significance of these similarities was checked using one-way ANOVA with a post hoc t-test. The significance level for the three methods after Bonferroni correction was 0.0167 (0.05/3). The difference between (FGT and SSLD) and (CIT and SSLD) was not statistically significant (P-value = 0.936). The differences between (CIT and FGT) and (CIT and SSLD) and between (FGT and SSLD) and (FGT and CIT) were statistically significant (P-values = 0.001 and 0.002, respectively).
Table 5.
Block similarity among the haplotype block methods for the twenty-two Chrs.
| Chr no. | CIT vs FGT | FGT vs SSLD | SSLD vs CIT |
|---|---|---|---|
| 1 | 88% | 21% | 23% |
| 2 | 39% | 0% | 0% |
| 3 | 34% | 45% | 20% |
| 4 | 100% | 0% | 0% |
| 5 | 40% | 21% | 30% |
| 6 | 76% | 74% | 71% |
| 7 | 9% | 32% | 6% |
| 8 | 39% | 30% | 34% |
| 9 | 49% | 29% | 25% |
| 10 | 0% | 0% | 0% |
| 11 | 53% | 0% | 0% |
| 12 | 74% | 18% | 21% |
| 13 | 71% | 0% | 0% |
| 14 | 17% | 36% | 24% |
| 15 | 39% | 33% | 23% |
| 16 | 0% | 0% | 54% |
| 17 | 52% | 51% | 35% |
| 18 | 0% | 0% | 0% |
| 19 | 64% | 52% | 43% |
| 20 | 50% | 18% | 27% |
| 21 | 75% | 0% | 11% |
| 22 | 53% | 2% | 4% |
As shown in Table 6, the SSLD method provided the best coverage of the hits obtained with the individual SNP approach, with 444 SNPs from 541 SNPs. The FGT method detected 432 SNPs, and the CIT method detected 415 SNPs. However, after excluding the hits on Chr 6, the FGT method was the best, detecting 45 out of 109 SNPs, and the CIT method (34 SNPs) performed better than the SSLD method (29 SNPs). The significance of the coverage by the three block methods of the hits obtained with the individual SNP approach was checked using one-way ANOVA with a post hoc t-test. The mean ± SD of the number of hits for CIT, FGT, and SSLD methods were 18.864 ± 80.909, 19.636 ± 82.071, and 20.182 ± 88.199, respectively. The significance level for the three methods after Bonferroni correction was 0.0167 (0.05/3). The difference among the three groups determined using ANOVA was not statistically significant (P-value = 0.999).
Table 6.
The ability of each haplotype block method to capture the significant SNPs the determined with individual SNP approach.
| Chr no. | Individual SNP | CIT | FGT | SSLD |
|---|---|---|---|---|
| 1 | 4 | 1 | 1 | 1 |
| 2 | 2 | 0 | 0 | 0 |
| 3 | 5 | 1 | 2 | 1 |
| 4 | 5 | 3 | 3 | 0 |
| 5 | 6 | 2 | 2 | 2 |
| 6 | 432 | 381 | 387 | 415 |
| 7 | 7 | 0 | 2 | 3 |
| 8 | 11 | 6 | 6 | 2 |
| 9 | 11 | 7 | 7 | 7 |
| 10 | 5 | 0 | 1 | 2 |
| 11 | 2 | 1 | 1 | 0 |
| 12 | 3 | 0 | 1 | 1 |
| 13 | 0 | 0 | 0 | 0 |
| 14 | 5 | 2 | 2 | 1 |
| 15 | 3 | 0 | 0 | 0 |
| 16 | 7 | 0 | 1 | 1 |
| 17 | 4 | 1 | 2 | 1 |
| 18 | 3 | 0 | 2 | 0 |
| 19 | 5 | 2 | 2 | 3 |
| 20 | 8 | 1 | 3 | 3 |
| 21 | 7 | 5 | 4 | 0 |
| 22 | 6 | 2 | 3 | 1 |
Most of the haplotype blocks that showed a high relationship with RA were in or near (+3 Mb) the major histocompatibility complex (MHC) region. Most of the 1021 SNPs detected by the three block methods were in the MHC region. These outcomes confirmed the firm association between the MHC region and RA susceptibility.
Some associated SNPs were determined using all the methods, but others were observed by only one method. These differences could be due to several reasons. For the associations observed using only the individual SNP approach, it may be that only one SNP represents strong LD with the causal SNP. Therefore, studying haplotypes could decrease the power of association because they consist of several SNPs.
For the associations observed using only the haplotype block methods, the individual SNP approach required approximately 81.71% more tests than the block methods. Consequently, the Bonferroni correction was more severe for the individual SNP approach.
The block methods were able to detect the interactions among many causal SNPs. In addition, haplotypes could capture rare alleles that may not be reflected by individual SNPs. The reason for this difference could be that the power to observe associations is maximized when the frequencies of the studied biomarker and the causal SNP are similar. Some associations were observed using one but not the other haplotype block methods because each method differs greatly in its scope of the definition of a haplotype block.
The limitations of this study are as follows: (a) the effects of population stratification were not accounted for; (b) a replication study in other datasets was not performed; and (c) other haplotype block methods, such as those based on hidden Markov models [134], [135], dynamic programming-based algorithms [136], [137], [138], [139], [140], wavelet decomposition [141], greedy algorithms [142], the minimum description length principle [143], [144], spatial correlation of SNPs [145], sequence kernel association tests [146], and block entropy [147], were not included.
Conclusions
Applying the individual SNP approach and the three block methods to the NARAC dataset will in turn maximize the system’s ability to discover crucial associations. In terms of selecting a method, SSLD would be the most appropriate for the NARAC dataset. The SSLD method has valuable advantages such as the highest genomic coverage; the largest minimum, median, and maximum significant block sizes; the highest number of significant SNPs included in blocks; and the highest number of associated SNPs discovered exclusively by a single method.
In total, 355 SNPs showed a P-value lower than the genome-wide significance threshold. Among them (after excluding Chr 6 results – 320 SNPs), 20 SNPs corresponding to 29 genes were not detected before for the RA susceptibility. Reviewing the literature, 10 genes from these 29 genes, namely, CDC42EP3, PLCL1, SATB2, TIFA, ZNF366, SH3PXD2A, COL2A1, SENP1, SEPT5, and TBX1, played a role in RA pathogenesis. As a future perspective, a replication study should be conducted to confirm the GWAS findings.
Conflict of interest
The authors have declared no conflict of interest.
Compliance with Ethics Requirements
This article does not contain any studies with human or animal subjects.
Acknowledgements
The authors would like to acknowledge the Genetic Analysis Workshop grant (R01 GM031575) for providing the NARAC dataset. This work is based on data gathered with the support of grants from the National Institutes of Health (NO1-AR-2-2263, RO1-AR-44422) and the National Arthritis Foundation.
Footnotes
Peer review under responsibility of Cairo University.
Supplementary data to this article can be found online at https://doi.org/10.1016/j.jare.2019.01.006.
Appendix A. Supplementary material
The following are the Supplementary data to this article:
References
- 1.Saad M.N., Mabrouk M.S., Eldeib A.M., Shaker O.G. Identification of rheumatoid arthritis biomarkers based on single nucleotide polymorphisms and haplotype blocks: a systematic review and meta-analysis. J Adv Res. 2016;7(1):1–16. doi: 10.1016/j.jare.2015.01.008. [DOI] [PMC free article] [PubMed] [Google Scholar]
- 2.Saad M.N., Mabrouk M.S., Eldeib A.M., Shaker O.G. 7th Cairo international biomedical engineering conference. IEEE; Cairo, Egypt: 2014. Vitamin D receptor gene polymorphisms in rheumatoid arthritis patients associating osteoporosis; pp. 75–78. [Google Scholar]
- 3.Saad M.N., Mabrouk M.S., Eldeib A.M., Shaker O.G. Effect of MTHFR, TGFβ1, and TNFB polymorphisms on osteoporosis in rheumatoid arthritis patients. Gene. 2015;568(2):124–128. doi: 10.1016/j.gene.2015.05.037. [DOI] [PubMed] [Google Scholar]
- 4.Saad M.N., Mabrouk M.S., Eldeib A.M., Shaker O.G. Genetic case-control study for eight polymorphisms associated with rheumatoid arthritis. PLoS One. 2015;10(7):e0131960. doi: 10.1371/journal.pone.0131960. [DOI] [PMC free article] [PubMed] [Google Scholar]
- 5.Alonso N., Lucas G., Hysi P. Big data challenges in bone research: genome-wide association studies and next-generation sequencing. BoneKEy Rep. 2015;4:635. doi: 10.1038/bonekey.2015.2. [DOI] [PMC free article] [PubMed] [Google Scholar]
- 6.Clark A.G. The role of haplotypes in candidate gene studies. Genet Epidemiol. 2004;27(4):321–333. doi: 10.1002/gepi.20025. [DOI] [PubMed] [Google Scholar]
- 7.Su S.C., Kuo C.C., Chen T. Single nucleotide polymorphism data analysis – state-of-the-art review on this emerging field from a signal processing viewpoint. IEEE Signal Process Mag. 2007;24(1):75–82. [Google Scholar]
- 8.Kim S.A., Yoo Y.J. Effects of single nucleotide polymorphism marker density on haplotype block partition. Genomics Inform. 2016;14(4):196–204. doi: 10.5808/GI.2016.14.4.196. [DOI] [PMC free article] [PubMed] [Google Scholar]
- 9.Ruyssen-Witrand A., Constantin A., Cambon-Thomsen A., Thomsen M. New insights into the genetics of immune responses in rheumatoid arthritis. Tissue Antigens. 2012;80(2):105–118. doi: 10.1111/j.1399-0039.2012.01939.x. [DOI] [PubMed] [Google Scholar]
- 10.Lauzon D., Kanzki B., Dupuy V., April A., Phillips M.S., Tremblay J. In: 2016 IEEE 1st international conference on connected health: applications, systems and engineering technologies (CHASE) IEEE; 2016. Addressing provenance issues in big data genome wide association studies (GWAS) [Google Scholar]
- 11.Peise E., Fabregat-Traver D., Bientinesi P. High performance solutions for big-data GWAS. Parallel Comput. 2015;42:75–87. [Google Scholar]
- 12.Balding D.J. A tutorial on statistical methods for population association studies. Nat Rev Genet. 2006;7(10):781–791. doi: 10.1038/nrg1916. [DOI] [PubMed] [Google Scholar]
- 13.Amos C.I., Chen W.V., Seldin M.F., Remmers E.F., Taylor K.E., Criswell L.A. Data for Genetic Analysis Workshop 16 Problem 1, association analysis of rheumatoid arthritis data. BMC Proc. 2009;3(Suppl 7):S2. doi: 10.1186/1753-6561-3-s7-s2. [DOI] [PMC free article] [PubMed] [Google Scholar]
- 14.Yuan T.-A., Yourk V., Farhat A., Ziogas A., Meyskens F.L., Anton-Culver H. A case-control study of the genetic variability in reactive oxygen species—metabolizing enzymes in melanoma risk. Int J Mol Sci. 2018;19(1):242–260. doi: 10.3390/ijms19010242. [DOI] [PMC free article] [PubMed] [Google Scholar]
- 15.Ballard D.H., Cho J., Zhao H. Comparisons of multi-marker association methods to detect association between a candidate region and disease. Genetic Epidemiol: Official Publ Int Genet Epidemiol Soc. 2010;34(3):201–212. doi: 10.1002/gepi.20448. [DOI] [PMC free article] [PubMed] [Google Scholar]
- 16.Shim H., Chun H., Engelman C.D., Payseur B.A. Genome-wide association studies using single-nucleotide polymorphisms versus haplotypes: an empirical comparison with data from the North American Rheumatoid Arthritis Consortium. BMC Proc. 2009;3(Suppl 7):S35. doi: 10.1186/1753-6561-3-s7-s35. [DOI] [PMC free article] [PubMed] [Google Scholar]
- 17.Purcell S., Neale B., Todd-Brown K., Thomas L., Ferreira M.A., Bender D. PLINK: a tool set for whole-genome association and population-based linkage analyses. Am J Hum Genet. 2007;81(3):559–575. doi: 10.1086/519795. [DOI] [PMC free article] [PubMed] [Google Scholar]
- 18.Barrett J.C., Fry B., Maller J., Daly M.J. Haploview: analysis and visualization of LD and haplotype maps. Bioinformatics. 2005;21(2):263–265. doi: 10.1093/bioinformatics/bth457. [DOI] [PubMed] [Google Scholar]
- 19.Turner SD. qqman: an R package for visualizing GWAS results using QQ and manhattan plots. bioRxiv; 2014.
- 20.Huang da W., Sherman B.T., Lempicki R.A. Systematic and integrative analysis of large gene lists using DAVID bioinformatics resources. Nat Protoc. 2009;4(1):44–57. doi: 10.1038/nprot.2008.211. [DOI] [PubMed] [Google Scholar]
- 21.Huang da W., Sherman B.T., Lempicki R.A. Bioinformatics enrichment tools: paths toward the comprehensive functional analysis of large gene lists. Nucl Acids Res. 2009;37(1):1–13. doi: 10.1093/nar/gkn923. [DOI] [PMC free article] [PubMed] [Google Scholar]
- 22.Arya R., Hare E., del Rincon I., Jenkinson C.P., Duggirala R., Almasy L. Effects of covariates and interactions on a genome-wide association analysis of rheumatoid arthritis. BMC Proc. 2009;3(Suppl 7):S84. doi: 10.1186/1753-6561-3-s7-s84. [DOI] [PMC free article] [PubMed] [Google Scholar]
- 23.Ding B., Padyukov L., Lundstrom E., Seielstad M., Plenge R.M., Oksenberg J.R. Different patterns of associations with anti-citrullinated protein antibody-positive and anti-citrullinated protein antibody-negative rheumatoid arthritis in the extended major histocompatibility complex region. Arthritis Rheum. 2009;60(1):30–38. doi: 10.1002/art.24135. [DOI] [PMC free article] [PubMed] [Google Scholar]
- 24.Park J., Namkung J., Jhun M., Park T. Genome-wide analysis of haplotype interaction for the data from the North American Rheumatoid Arthritis Consortium. BMC Proc. 2009;3(Suppl 7):S34. doi: 10.1186/1753-6561-3-s7-s34. [DOI] [PMC free article] [PubMed] [Google Scholar]
- 25.Xie G., Lu Y., Sun Y., Zhang S.S., Keystone E.C., Gregersen P.K. Identification of the NF-kappaB activating protein-like locus as a risk locus for rheumatoid arthritis. Ann Rheum Dis. 2013;72(7):1249–1254. doi: 10.1136/annrheumdis-2012-202076. [DOI] [PMC free article] [PubMed] [Google Scholar]
- 26.Plenge R.M., Seielstad M., Padyukov L., Lee A.T., Remmers E.F., Ding B. TRAF1-C5 as a risk locus for rheumatoid arthritis – a genomewide study. N Engl J Med. 2007;357(12):1199–1209. doi: 10.1056/NEJMoa073491. [DOI] [PMC free article] [PubMed] [Google Scholar]
- 27.Eyre S., Bowes J., Diogo D., Lee A., Barton A., Martin P. High-density genetic mapping identifies new susceptibility loci for rheumatoid arthritis. Nat Genet. 2012;44(12):1336–1340. doi: 10.1038/ng.2462. [DOI] [PMC free article] [PubMed] [Google Scholar]
- 28.Zheng G., Wu C.O., Kwak M., Jiang W., Joo J., Lima J.A.C. Joint analysis of binary and quantitative traits with data sharing and outcome-dependent sampling. Genet Epidemiol. 2012;36(3):263–273. doi: 10.1002/gepi.21619. [DOI] [PubMed] [Google Scholar]
- 29.Julia A., Ballina J., Canete J.D., Balsa A., Tornero-Molina J., Naranjo A. Genome-wide association study of rheumatoid arthritis in the Spanish population: KLF12 as a risk locus for rheumatoid arthritis susceptibility. Arthritis Rheum. 2008;58(8):2275–2286. doi: 10.1002/art.23623. [DOI] [PubMed] [Google Scholar]
- 30.Plenge R.M., Padyukov L., Remmers E.F., Purcell S., Lee A.T., Karlson E.W. Replication of putative candidate-gene associations with rheumatoid arthritis in >4000 samples from North America and Sweden: association of susceptibility with PTPN22, CTLA4, and PADI4. Am J Hum Genet. 2005;77(6):1044–1060. doi: 10.1086/498651. [DOI] [PMC free article] [PubMed] [Google Scholar]
- 31.Liu J., Wang K., Ma S., Huang J. Accounting for linkage disequilibrium in genome-wide association studies: a penalized regression method. Stat Interf. 2013;6(1):99–115. doi: 10.4310/SII.2013.v6.n1.a10. [DOI] [PMC free article] [PubMed] [Google Scholar]
- 32.Sarasua S.M., Collins J.S., Williamson D.M., Satten G.A., Allen A.S. Effect of population stratification on the identification of significant single-nucleotide polymorphisms in genome-wide association studies. BMC Proc. 2009;3(7):S13. doi: 10.1186/1753-6561-3-s7-s13. [DOI] [PMC free article] [PubMed] [Google Scholar]
- 33.Arshadi N., Chang B., Kustra R. Predictive modeling in case-control single-nucleotide polymorphism studies in the presence of population stratification: a case study using Genetic Analysis Workshop 16 Problem 1 dataset. BMC Proc. 2009;3(7):S60. doi: 10.1186/1753-6561-3-s7-s60. [DOI] [PMC free article] [PubMed] [Google Scholar]
- 34.Chen L., Zhong M., Chen W.V., Amos C.I., Fan R. A genome-wide association scan for rheumatoid arthritis data by Hotelling's T2tests. BMC Proc. 2009;3(7):S6. doi: 10.1186/1753-6561-3-s7-s6. [DOI] [PMC free article] [PubMed] [Google Scholar]
- 35.Yoo Y.J., Pinnaduwage D., Waggott D., Bull S.B., Sun L. Genome-wide association analyses of North American Rheumatoid Arthritis Consortium and Framingham Heart Study data utilizing genome-wide linkage results. BMC Proc. 2009;3(7):S103. doi: 10.1186/1753-6561-3-s7-s103. [DOI] [PMC free article] [PubMed] [Google Scholar]
- 36.Fang Y., Wang Y., Sha N. Armitage's trend test for genome-wide association analysis: one-sided or two-sided? BMC Proc. 2009;3(7):S37. doi: 10.1186/1753-6561-3-s7-s37. [DOI] [PMC free article] [PubMed] [Google Scholar]
- 37.Taliun D., Gamper J., Pattaro C. Efficient haplotype block recognition of very long and dense genetic sequences. BMC Bioinf. 2014;15(10) doi: 10.1186/1471-2105-15-10. [DOI] [PMC free article] [PubMed] [Google Scholar]
- 38.Palomino-Morales R.J., Rojas-Villarraga A., González C.I., Ramírez G., Anaya J.M., Martín J. STAT4 but not TRAF1/C5 variants influence the risk of developing rheumatoid arthritis and systemic lupus erythematosus in Colombians. Genes Immun. 2008;9(4):379–382. doi: 10.1038/gene.2008.30. [DOI] [PubMed] [Google Scholar]
- 39.Plant D., Flynn E., Mbarek H., Dieudé P., Cornelis F., Ärlestig L. Investigation of potential non-HLA rheumatoid arthritis susceptibility loci in a European cohort increases the evidence for nine markers. Ann Rheum Dis. 2010;69(8):1548–1553. doi: 10.1136/ard.2009.121020. [DOI] [PMC free article] [PubMed] [Google Scholar]
- 40.Barton A., Thomson W., Ke X., Eyre S., Hinks A., Bowes J. Re-evaluation of putative rheumatoid arthritis susceptibility genes in the post-genome wide association study era and hypothesis of a key pathway underlying susceptibility. Hum Mol Genet. 2008;17(15):2274–2279. doi: 10.1093/hmg/ddn128. [DOI] [PMC free article] [PubMed] [Google Scholar]
- 41.Plant D., Thomson W., Lunt M., Flynn E., Martin P., Eyre S. The role of rheumatoid arthritis genetic susceptibility markers in the prediction of erosive disease in patients with early inflammatory polyarthritis: results from the Norfolk Arthritis Register. Rheumatology. 2011;50(1):78–84. doi: 10.1093/rheumatology/keq032. [DOI] [PMC free article] [PubMed] [Google Scholar]
- 42.Hinks A., Eyre S., Ke X., Barton A., Martin P., Flynn E. Overlap of disease susceptibility loci for rheumatoid arthritis and juvenile idiopathic arthritis. Ann Rheum Dis. 2009;69(6):1049–1053. doi: 10.1136/ard.2009.110650. [DOI] [PMC free article] [PubMed] [Google Scholar]
- 43.Han T.-U., Bang S.-Y., Kang C., Bae S.-C. TRAF1 polymorphisms associated with rheumatoid arthritis susceptibility in Asians and in Caucasians. Arthritis Rheum. 2009;60(9):2577–2584. doi: 10.1002/art.24759. [DOI] [PubMed] [Google Scholar]
- 44.Chang M., Rowland C.M., Garcia V.E., Schrodi S.J., Catanese J.J., van der Helm-van Mil A.H.M. A large-scale rheumatoid arthritis genetic study identifies association at chromosome 9q33.2. PLoS Genet. 2008;4(6):e1000107. doi: 10.1371/journal.pgen.1000107. [DOI] [PMC free article] [PubMed] [Google Scholar]
- 45.Stahl E.A., Raychaudhuri S., Remmers E.F., Xie G., Eyre S., Thomson B.P. Genome-wide association study meta-analysis identifies seven new rheumatoid arthritis risk loci. Nat Genet. 2010;42(6):508–514. doi: 10.1038/ng.582. [DOI] [PMC free article] [PubMed] [Google Scholar]
- 46.Raychaudhuri S., Thomson B.P., Remmers E.F., Eyre S., Hinks A., Guiducci C. Genetic variants at CD28, PRDM1 and CD2/CD58 are associated with rheumatoid arthritis risk. Nat Genet. 2009;41(12):1313–1318. doi: 10.1038/ng.479. [DOI] [PMC free article] [PubMed] [Google Scholar]
- 47.Okada Y., Terao C., Ikari K., Kochi Y., Ohmura K., Suzuki A. Meta-analysis identifies nine new loci associated with rheumatoid arthritis in the Japanese population. Nat Genet. 2012;44(5):511–516. doi: 10.1038/ng.2231. [DOI] [PubMed] [Google Scholar]
- 48.Jiang R., Dong J., Dai Y. Genome-wide association study of rheumatoid arthritis by a score test based on wavelet transformation. BMC Proc. 2009;3(7):S8. doi: 10.1186/1753-6561-3-s7-s8. [DOI] [PMC free article] [PubMed] [Google Scholar]
- 49.Jung J., Song J.J., Kwon D. Allelic based gene-gene interactions in rheumatoid arthritis. BMC Proc. 2009;3(7):S76. doi: 10.1186/1753-6561-3-S7-S76. [DOI] [PMC free article] [PubMed] [Google Scholar]
- 50.Tang R., Sinnwell J.P., Li J., Rider D.N., de Andrade M., Biernacka J.M. Identification of genes and haplotypes that predict rheumatoid arthritis using random forests. BMC Proc. 2009;3(7):S68. doi: 10.1186/1753-6561-3-s7-s68. [DOI] [PMC free article] [PubMed] [Google Scholar]
- 51.Zhang M., Lin Y., Wang L., Pungpapong V., Fleet J.C., Zhang D. Case-control genome-wide association study of rheumatoid arthritis from Genetic Analysis Workshop 16 using penalized orthogonal-components regression-linear discriminant analysis. BMC Proc. 2009;3(7):S17. doi: 10.1186/1753-6561-3-s7-s17. [DOI] [PMC free article] [PubMed] [Google Scholar]
- 52.Gregersen P.K., Amos C.I., Lee A.T., Lu Y., Remmers E.F., Kastner D.L. REL, encoding a member of the NF-kappaB family of transcription factors, is a newly defined risk locus for rheumatoid arthritis. Nat Genet. 2009;41(7):820–823. doi: 10.1038/ng.395. [DOI] [PMC free article] [PubMed] [Google Scholar]
- 53.Matthews A.G., Li J., He C., Ott J., Andrade Md. Adjusting for HLA-DRβ1 in a genome-wide association analysis of rheumatoid arthritis and related biomarkers. BMC Proc. 2009;3(7):S12. doi: 10.1186/1753-6561-3-s7-s12. [DOI] [PMC free article] [PubMed] [Google Scholar]
- 54.Lantieri F., Jhun M.A., Park J., Park T., Devoto M. Comparative analysis of different approaches for dealing with candidate regions in the context of a genome-wide association study. BMC Proc. 2009;3(7):S93. doi: 10.1186/1753-6561-3-s7-s93. [DOI] [PMC free article] [PubMed] [Google Scholar]
- 55.Viatte S., Flynn E., Lunt M., Barnes J., Singwe-Ngandeu M., Bas S. Investigation of Caucasian rheumatoid arthritis susceptibility loci in African patients with the same disease. Arthritis Res Ther. 2012;14(6):R239. doi: 10.1186/ar4082. [DOI] [PMC free article] [PubMed] [Google Scholar]
- 56.Wu C.-C., Shete S., Jo E.-J., Xu Y., Lu E.Y., Chen W.V. Whole-genome detection of disease-associated deletions or excess homozygosity in a case–control study of rheumatoid arthritis. Hum Mol Genet. 2013;22(6):1249–1261. doi: 10.1093/hmg/dds512. [DOI] [PMC free article] [PubMed] [Google Scholar]
- 57.Zhuang J.J., Morris A.P. Assessment of sex-specific effects in a genome-wide association study of rheumatoid arthritis. BMC Proc. 2009;3(7):S90. doi: 10.1186/1753-6561-3-s7-s90. [DOI] [PMC free article] [PubMed] [Google Scholar]
- 58.Meziani R., Yamada R., Takahashi M., Ohigashi K., Morinobu A., Terao C. A trans-ethnic genetic study of rheumatoid arthritis identified FCGR2A as a candidate common risk factor in Japanese and European populations. Mod Rheumatol. 2012;22(1):52–58. doi: 10.1007/s10165-011-0467-y. [DOI] [PubMed] [Google Scholar]
- 59.Ide M., Lewis D.A. Altered cortical CDC42 signaling pathways in schizophrenia: implications for dendritic spine deficits. Biol Psychiatry. 2010;68(1):25–32. doi: 10.1016/j.biopsych.2010.02.016. [DOI] [PMC free article] [PubMed] [Google Scholar]
- 60.Hosgood H.D., 3rd, Menashe I., Shen M., Yeager M., Yuenger J., Rajaraman P. Pathway-based evaluation of 380 candidate genes and lung cancer susceptibility suggests the importance of the cell cycle pathway. Carcinogenesis. 2008;29(10):1938–1943. doi: 10.1093/carcin/bgn178. [DOI] [PMC free article] [PubMed] [Google Scholar]
- 61.Liu Y.Z., Wilson S.G., Wang L., Liu X.G., Guo Y.F., Li J. Identification of PLCL1 gene for hip bone size variation in females in a genome-wide association study. PLoS One. 2008;3(9):e3160. doi: 10.1371/journal.pone.0003160. [DOI] [PMC free article] [PubMed] [Google Scholar]
- 62.Bilguvar K., Yasuno K., Niemela M., Ruigrok Y.M., von Und Zu Fraunberg M., van Duijn C.M. Susceptibility loci for intracranial aneurysm in European and Japanese populations. Nat Genet. 2008;40(12):1472–1477. doi: 10.1038/ng.240. [DOI] [PMC free article] [PubMed] [Google Scholar]
- 63.FitzPatrick D.R., Carr I.M., McLaren L., Leek J.P., Wightman P., Williamson K. Identification of SATB2 as the cleft palate gene on 2q32-q33. Hum Mol Genet. 2003;12(19):2491–2501. doi: 10.1093/hmg/ddg248. [DOI] [PubMed] [Google Scholar]
- 64.Beaty T.H., Hetmanski J.B., Fallin M.D., Park J.W., Sull J.W., McIntosh I. Analysis of candidate genes on chromosome 2 in oral cleft case-parent trios from three populations. Hum Genet. 2006;120(4):501–518. doi: 10.1007/s00439-006-0235-9. [DOI] [PubMed] [Google Scholar]
- 65.Rosenfeld J.A., Ballif B.C., Lucas A., Spence E.J., Powell C., Aylsworth A.S. Small deletions of SATB2 cause some of the clinical features of the 2q33.1 microdeletion syndrome. PLoS One. 2009;4(8):e6568. doi: 10.1371/journal.pone.0006568. [DOI] [PMC free article] [PubMed] [Google Scholar]
- 66.Chung J., Lau J., Cheng L.S., Grant R.I., Robinson F., Ketela T. SATB2 augments DeltaNp63alpha in head and neck squamous cell carcinoma. EMBO Rep. 2010;11(10):777–783. doi: 10.1038/embor.2010.125. [DOI] [PMC free article] [PubMed] [Google Scholar]
- 67.Magnusson K., de Wit M., Brennan D.J., Johnson L.B., McGee S.F., Lundberg E. SATB2 in combination with cytokeratin 20 identifies over 95% of all colorectal carcinomas. Am J Surg Pathol. 2011;35(7):937–948. doi: 10.1097/PAS.0b013e31821c3dae. [DOI] [PubMed] [Google Scholar]
- 68.Liu T.R., Xu L.H., Yang A.K., Zhong Q., Song M., Li M.Z. Decreased expression of SATB2: a novel independent prognostic marker of worse outcome in laryngeal carcinoma patients. PLoS One. 2012;7(7):e40704. doi: 10.1371/journal.pone.0040704. [DOI] [PMC free article] [PubMed] [Google Scholar]
- 69.Seong B.K., Lau J., Adderley T., Kee L., Chaukos D., Pienkowska M. SATB2 enhances migration and invasion in osteosarcoma by regulating genes involved in cytoskeletal organization. Oncogene. 2015;34(27):3582–3592. doi: 10.1038/onc.2014.289. [DOI] [PubMed] [Google Scholar]
- 70.Elebro J., Heby M., Gaber A., Nodin B., Jonsson L., Fristedt R. Prognostic and treatment predictive significance of SATB1 and SATB2 expression in pancreatic and periampullary adenocarcinoma. J Transl Med. 2014;12(1):289. doi: 10.1186/s12967-014-0289-8. [DOI] [PMC free article] [PubMed] [Google Scholar]
- 71.Geng G.J., Li N., Mi Y.J., Yu X.Y., Luo X.Y., Gao J. Prognostic value of SATB2 expression in patients with esophageal squamous cell carcinoma. Int J Clin Exp Pathol. 2015;8(1):423–431. [PMC free article] [PubMed] [Google Scholar]
- 72.Jiang G., Cui Y., Yu X., Wu Z., Ding G., Cao L. miR-211 suppresses hepatocellular carcinoma by downregulating SATB2. Oncotargetics. 2015;6(11):9457–9466. doi: 10.18632/oncotarget.3265. [DOI] [PMC free article] [PubMed] [Google Scholar]
- 73.Zhang Y., Li S.K., Yi Yang K., Liu M., Lee N., Tang X. Whole genome methylation array reveals the down-regulation of IGFBP6 and SATB2 by HIV-1. Sci Rep. 2015;5:10806. doi: 10.1038/srep10806. [DOI] [PMC free article] [PubMed] [Google Scholar]
- 74.Guo C., Xiong D., Yao X., Gu W., Zhang H., Yang B. Decreased SATB2 expression is associated with metastasis and poor prognosis in human clear cell renal cell carcinoma. Int J Clin Exp Pathol. 2015;8(4):3710–3718. [PMC free article] [PubMed] [Google Scholar]
- 75.Li Z., Yuan J., Wei L., Zhou L., Mei K., Yue J. SATB2 is a sensitive marker for lower gastrointestinal well-differentiated neuroendocrine tumors. Int J Clin Exp Pathol. 2015;8(6):7072–7082. [PMC free article] [PubMed] [Google Scholar]
- 76.Kiel D.P., Demissie S., Dupuis J., Lunetta K.L., Murabito J.M., Karasik D. Genome-wide association with bone mass and geometry in the Framingham Heart Study. BMC Med Genet. 2007;8(Suppl 1):S14. doi: 10.1186/1471-2350-8-S1-S14. [DOI] [PMC free article] [PubMed] [Google Scholar]
- 77.Sieuwerts A.M., Ansems M., Look M.P., Span P.N., de Weerd V., van Galen A. Clinical significance of the nuclear receptor co-regulator DC-SCRIPT in breast cancer: an independent retrospective validation study. Breast Cancer Res. 2010;12(6):R103. doi: 10.1186/bcr2786. [DOI] [PMC free article] [PubMed] [Google Scholar]
- 78.Ansems M., Karthaus N., Hontelez S., Aalders T., Looman M.W., Verhaegh G.W. DC-SCRIPT: AR and VDR regulator lost upon transformation of prostate epithelial cells. Prostate. 2012;72(16):1708–1717. doi: 10.1002/pros.22522. [DOI] [PubMed] [Google Scholar]
- 79.Kayashima T., Yamasaki K., Yamada T., Sakai H., Miwa N., Ohta T. The novel imprinted carboxypeptidase A4 gene (CPA4) in the 7q32 imprinting domain. Hum Genet. 2003;112(3):220–226. doi: 10.1007/s00439-002-0891-3. [DOI] [PubMed] [Google Scholar]
- 80.Wang S., Song J., Tan M., Albers K.M., Jia J. Mitochondrial fission proteins in peripheral blood lymphocytes are potential biomarkers for Alzheimer's disease. Eur J Neurol. 2012;19(7):1015–1022. doi: 10.1111/j.1468-1331.2012.03670.x. [DOI] [PubMed] [Google Scholar]
- 81.Tian Y., Huang Z., Wang Z., Yin C., Zhou L., Zhang L. Identification of novel molecular markers for prognosis estimation of acute myeloid leukemia: over-expression of PDCD7, FIS1 and Ang2 may indicate poor prognosis in pretreatment patients with acute myeloid leukemia. PLoS One. 2014;9(1):e84150. doi: 10.1371/journal.pone.0084150. [DOI] [PMC free article] [PubMed] [Google Scholar]
- 82.Ferreira-da-Silva A., Valacca C., Rios E., Populo H., Soares P., Sobrinho-Simoes M. Mitochondrial dynamics protein Drp1 is overexpressed in oncocytic thyroid tumors and regulates cancer cell migration. PLoS One. 2015;10(3):e0122308. doi: 10.1371/journal.pone.0122308. [DOI] [PMC free article] [PubMed] [Google Scholar]
- 83.Williams K.E., Miroshnychenko O., Johansen E.B., Niles R.K., Sundaram R., Kannan K. Urine, peritoneal fluid and omental fat proteomes of reproductive age women: endometriosis-related changes and associations with endocrine disrupting chemicals. J Proteomics. 2015;113:194–205. doi: 10.1016/j.jprot.2014.09.015. [DOI] [PMC free article] [PubMed] [Google Scholar]
- 84.Seals D.F., Azucena E.F., Jr., Pass I., Tesfay L., Gordon R., Woodrow M. The adaptor protein Tks5/Fish is required for podosome formation and function, and for the protease-driven invasion of cancer cells. Cancer Cell. 2005;7(2):155–165. doi: 10.1016/j.ccr.2005.01.006. [DOI] [PubMed] [Google Scholar]
- 85.Stylli S.S., Stacey T.T., Kaye A.H., Lock P. Prognostic significance of Tks5 expression in gliomas. J Clin Neurosci. 2012;19(3):436–442. doi: 10.1016/j.jocn.2011.11.013. [DOI] [PubMed] [Google Scholar]
- 86.Xiang Y., Cheng Y., Li X., Li Q., Xu J., Zhang J. Up-regulated expression and aberrant DNA methylation of LEP and SH3PXD2A in pre-eclampsia. PLoS One. 2013;8(3):e59753. doi: 10.1371/journal.pone.0059753. [DOI] [PMC free article] [PubMed] [Google Scholar]
- 87.Li C.M., Chen G., Dayton T.L., Kim-Kiselak C., Hoersch S., Whittaker C.A. Differential Tks5 isoform expression contributes to metastatic invasion of lung adenocarcinoma. Genes Dev. 2013;27(14):1557–1567. doi: 10.1101/gad.222745.113. [DOI] [PMC free article] [PubMed] [Google Scholar]
- 88.Burger K.L., Learman B.S., Boucherle A.K., Sirintrapun S.J., Isom S., Diaz B. Src-dependent Tks5 phosphorylation regulates invadopodia-associated invasion in prostate cancer cells. Prostate. 2014;74(2):134–148. doi: 10.1002/pros.22735. [DOI] [PMC free article] [PubMed] [Google Scholar]
- 89.Stylli S.S., Luwor R.B., Kaye A.H., Hovens C.M., Lock P. Expression of the adaptor protein Tks5 in human cancer: prognostic potential. Oncol Rep. 2014;32(3):989–1002. doi: 10.3892/or.2014.3310. [DOI] [PubMed] [Google Scholar]
- 90.Quaye L., Dafou D., Ramus S.J., Song H., Gentry-Maharaj A., Notaridou M. Functional complementation studies identify candidate genes and common genetic variants associated with ovarian cancer survival. Hum Mol Genet. 2009;18(10):1869–1878. doi: 10.1093/hmg/ddp107. [DOI] [PubMed] [Google Scholar]
- 91.Richards A.J., Martin S., Yates J.R., Scott J.D., Baguley D.M., Pope F.M. COL2A1 exon 2 mutations: relevance to the Stickler and Wagner syndromes. Br J Ophthalmol. 2000;84(4):364–371. doi: 10.1136/bjo.84.4.364. [DOI] [PMC free article] [PubMed] [Google Scholar]
- 92.Muller S., Soder S., Oliveira A.M., Inwards C.Y., Aigner T. Type II collagen as specific marker for mesenchymal chondrosarcomas compared to other small cell sarcomas of the skeleton. Mod Pathol. 2005;18(8):1088–1094. doi: 10.1038/modpathol.3800391. [DOI] [PubMed] [Google Scholar]
- 93.Liu Y.F., Chen W.M., Lin Y.F., Yang R.C., Lin M.W., Li L.H. Type II collagen gene variants and inherited osteonecrosis of the femoral head. N Engl J Med. 2005;352(22):2294–2301. doi: 10.1056/NEJMoa042480. [DOI] [PubMed] [Google Scholar]
- 94.Mutti D.O., Cooper M.E., O'Brien S., Jones L.A., Marazita M.L., Murray J.C. Candidate gene and locus analysis of myopia. Mol Vis. 2007;13:1012–1019. [PMC free article] [PubMed] [Google Scholar]
- 95.Jamieson S.E., de Roubaix L.A., Cortina-Borja M., Tan H.K., Mui E.J., Cordell H.J. Genetic and epigenetic factors at COL2A1 and ABCA4 influence clinical outcome in congenital toxoplasmosis. PLoS One. 2008;3(6):e2285. doi: 10.1371/journal.pone.0002285. [DOI] [PMC free article] [PubMed] [Google Scholar]
- 96.Tzschach A., Tinschert S., Kaminsky E., Lusga E., Mundlos S., Graul-Neumann L.M. Czech dysplasia: report of a large family and further delineation of the phenotype. Am J Med Genet A. 2008;146a(14):1859–1864. doi: 10.1002/ajmg.a.32389. [DOI] [PubMed] [Google Scholar]
- 97.Su P., Li R., Liu S., Zhou Y., Wang X., Patil N. Age at onset-dependent presentations of premature hip osteoarthritis, avascular necrosis of the femoral head, or Legg-Calve-Perthes disease in a single family, consequent upon a p.Gly1170Ser mutation of COL2A1. Arthritis Rheum. 2008;58(6):1701–1706. doi: 10.1002/art.23491. [DOI] [PubMed] [Google Scholar]
- 98.Cheng J., Bawa T., Lee P., Gong L., Yeh E.T. Role of desumoylation in the development of prostate cancer. Neoplasia. 2006;8(8):667–676. doi: 10.1593/neo.06445. [DOI] [PMC free article] [PubMed] [Google Scholar]
- 99.Ohbayashi N., Kawakami S., Muromoto R., Togi S., Ikeda O., Kamitani S. The IL-6 family of cytokines modulates STAT3 activation by desumoylation of PML through SENP1 induction. Biochem Biophys Res Commun. 2008;371(4):823–828. doi: 10.1016/j.bbrc.2008.04.179. [DOI] [PubMed] [Google Scholar]
- 100.Shu H.J., Saito T., Watanabe H., Ito J.I., Takeda H., Okano H. Expression of the Musashi1 gene encoding the RNA-binding protein in human hepatoma cell lines. Biochem Biophys Res Commun. 2002;293(1):150–154. doi: 10.1016/S0006-291X(02)00175-4. [DOI] [PubMed] [Google Scholar]
- 101.Lovell M.A., Markesbery W.R. Ectopic expression of Musashi-1 in Alzheimer disease and Pick disease. J Neuropathol Exp Neurol. 2005;64(8):675–680. doi: 10.1097/01.jnen.0000173891.17176.5b. [DOI] [PubMed] [Google Scholar]
- 102.Murata H., Tsuji S., Tsujii M., Nakamura T., Fu H.Y., Eguchi H. Helicobacter pylori infection induces candidate stem cell marker Musashi-1 in the human gastric epithelium. Dig Dis Sci. 2008;53(2):363–369. doi: 10.1007/s10620-007-9858-5. [DOI] [PubMed] [Google Scholar]
- 103.Ye F., Zhou C., Cheng Q., Shen J., Chen H. Stem-cell-abundant proteins Nanog, Nucleostemin and Musashi1 are highly expressed in malignant cervical epithelial cells. BMC Cancer. 2008;8:108. doi: 10.1186/1471-2407-8-108. [DOI] [PMC free article] [PubMed] [Google Scholar]
- 104.Gotte M., Wolf M., Staebler A., Buchweitz O., Kelsch R., Schuring A.N. Increased expression of the adult stem cell marker Musashi-1 in endometriosis and endometrial carcinoma. J Pathol. 2008;215(3):317–329. doi: 10.1002/path.2364. [DOI] [PubMed] [Google Scholar]
- 105.Sanchez-Diaz P.C., Burton T.L., Burns S.C., Hung J.Y., Penalva L.O. Musashi1 modulates cell proliferation genes in the medulloblastoma cell line Daoy. BMC Cancer. 2008;8:280. doi: 10.1186/1471-2407-8-280. [DOI] [PMC free article] [PubMed] [Google Scholar]
- 106.Feng S.W., Chen Y., Tsai W.C., Chiou H.C., Wu S.T., Huang L.C. Overexpression of TELO2 decreases survival in human high-grade gliomas. Oncotargetics. 2016;7(29):46056–46066. doi: 10.18632/oncotarget.10021. [DOI] [PMC free article] [PubMed] [Google Scholar]
- 107.You J., Sobreira N.L., Gable D.L., Jurgens J., Grange D.K., Belnap N. A syndromic intellectual disability disorder caused by variants in TELO2, a gene encoding a component of the TTT complex. Am J Hum Genet. 2016;98(5):909–918. doi: 10.1016/j.ajhg.2016.03.014. [DOI] [PMC free article] [PubMed] [Google Scholar]
- 108.Moosa S., Altmuller J., Lyngbye T., Christensen R., Li Y., Nurnberg P. Novel compound heterozygous mutations in TELO2 in a patient with severe expression of You-Hoover-Fong syndrome. Mol Genet Genomic Med. 2017;5(5):580–584. doi: 10.1002/mgg3.287. [DOI] [PMC free article] [PubMed] [Google Scholar]
- 109.Maher G.J., Hilton E.N., Urquhart J.E., Davidson A.E., Spencer H.L., Black G.C. The cataract-associated protein TMEM114, and TMEM235, are glycosylated transmembrane proteins that are distinct from claudin family members. FEBS Lett. 2011;585(14):2187–2192. doi: 10.1016/j.febslet.2011.05.060. [DOI] [PubMed] [Google Scholar]
- 110.Zhou M., Maitra S.R., Wang P. Adrenomedullin and adrenomedullin binding protein-1 protect endothelium-dependent vascular relaxation in sepsis. Mol Med. 2007;13(9–10):488–494. doi: 10.2119/2007-00113.Zhou. [DOI] [PMC free article] [PubMed] [Google Scholar]
- 111.Jeon B.N., Kim M.K., Choi W.I., Koh D.I., Hong S.Y., Kim K.S. KR-POK interacts with p53 and represses its ability to activate transcription of p21WAF1/CDKN1A. Cancer Res. 2012;72(5):1137–1148. doi: 10.1158/0008-5472.CAN-11-2433. [DOI] [PubMed] [Google Scholar]
- 112.Du R., Zhou J., Lorenzano S., Liu W., Charoenvimolphan N., Qian B. Integrative mouse and human studies implicate ANGPT1 and ZBTB7C as susceptibility genes to ischemic injury. Stroke. 2015;46(12):3514–3522. doi: 10.1161/STROKEAHA.115.010767. [DOI] [PMC free article] [PubMed] [Google Scholar]
- 113.Harrison S., Lewis S.J., Hall A.J., Vuckovic D., Girotto G., Martin R.M. Association of SNPs in LCP1 and CTIF with hearing in 11 year old children: findings from the Avon Longitudinal Study of Parents and Children (ALSPAC) birth cohort and the G-EAR consortium. BMC Med Genom. 2015;8:48. doi: 10.1186/s12920-015-0112-2. [DOI] [PMC free article] [PubMed] [Google Scholar]
- 114.Tiwari A., Schuiki I., Zhang L., Allister E.M., Wheeler M.B., Volchuk A. SDF2L1 interacts with the ER-associated degradation machinery and retards the degradation of mutant proinsulin in pancreatic beta-cells. J Cell Sci. 2013;126(9):1962–1968. doi: 10.1242/jcs.117374. [DOI] [PubMed] [Google Scholar]
- 115.Dong Z., Ferger B., Paterna J.C., Vogel D., Furler S., Osinde M. Dopamine-dependent neurodegeneration in rats induced by viral vector-mediated overexpression of the parkin target protein, CDCrel-1. Proc Natl Acad Sci USA. 2003;100(21):12438–12443. doi: 10.1073/pnas.2132992100. [DOI] [PMC free article] [PubMed] [Google Scholar]
- 116.Capurso G., Crnogorac-Jurcevic T., Milione M., Panzuto F., Campanini N., Dowen S.E. Peanut-like 1 (septin 5) gene expression in normal and neoplastic human endocrine pancreas. Neuroendocrinology. 2005;81(5):311–321. doi: 10.1159/000088449. [DOI] [PubMed] [Google Scholar]
- 117.Xin X., Pache M., Zieger B., Bartsch I., Prunte C., Flammer J. Septin expression in proliferative retinal membranes. J Histochem Cytochem. 2007;55(11):1089–1094. doi: 10.1369/jhc.7A7188.2007. [DOI] [PMC free article] [PubMed] [Google Scholar]
- 118.Jung A.E., Fitzsimons H.L., Bland R.J., During M.J., Young D. HSP70 and constitutively active HSF1 mediate protection against CDCrel-1-mediated toxicity. Mol Ther. 2008;16(6):1048–1055. doi: 10.1038/mt.2008.68. [DOI] [PMC free article] [PubMed] [Google Scholar]
- 119.Kurokawa Y., Ishida F., Kamijo T., Kunishima S., Kenny D., Kitano K. A missense mutation (Tyr88 to Cys) in the platelet membrane glycoprotein Ibbeta gene affects GPIb/IX complex expression–Bernard-Soulier syndrome in the homozygous form and giant platelets in the heterozygous form. Thromb Haemost. 2001;86(5):1249–1256. [PubMed] [Google Scholar]
- 120.Liang H.P., Morel-Kopp M.C., Curtin J., Wilson M., Hewson J., Chen W. Heterozygous loss of platelet glycoprotein (GP) Ib-V-IX variably affects platelet function in velocardiofacial syndrome (VCFS) patients. Thromb Haemost. 2007;98(6):1298–1308. [PubMed] [Google Scholar]
- 121.Kunishima S., Imai T., Kobayashi R., Kato M., Ogawa S., Saito H. Bernard-Soulier syndrome caused by a hemizygous GPIbbeta mutation and 22q11.2 deletion. Pediatr Int. 2013;55(4):434–437. doi: 10.1111/ped.12105. [DOI] [PubMed] [Google Scholar]
- 122.Yamagishi H., Maeda J., Hu T., McAnally J., Conway S.J., Kume T. Tbx1 is regulated by tissue-specific forkhead proteins through a common Sonic hedgehog-responsive enhancer. Genes Dev. 2003;17(2):269–281. doi: 10.1101/gad.1048903. [DOI] [PMC free article] [PubMed] [Google Scholar]
- 123.Zoupa M., Seppala M., Mitsiadis T., Cobourne M.T. Tbx1 is expressed at multiple sites of epithelial-mesenchymal interaction during early development of the facial complex. Int J Dev Biol. 2006;50(5):504–510. doi: 10.1387/ijdb.052116mz. [DOI] [PubMed] [Google Scholar]
- 124.Paylor R., Glaser B., Mupo A., Ataliotis P., Spencer C., Sobotka A. Tbx1 haploinsufficiency is linked to behavioral disorders in mice and humans: implications for 22q11 deletion syndrome. Proc Natl Acad Sci USA. 2006;103(20):7729–7734. doi: 10.1073/pnas.0600206103. [DOI] [PMC free article] [PubMed] [Google Scholar]
- 125.Fernando R.I., Litzinger M., Trono P., Hamilton D.H., Schlom J., Palena C. The T-box transcription factor Brachyury promotes epithelial-mesenchymal transition in human tumor cells. J Clin Invest. 2010;120(2):533–544. doi: 10.1172/JCI38379. [DOI] [PMC free article] [PubMed] [Google Scholar]
- 126.Griffin H.R., Topf A., Glen E., Zweier C., Stuart A.G., Parsons J. Systematic survey of variants in TBX1 in non-syndromic tetralogy of Fallot identifies a novel 57 base pair deletion that reduces transcriptional activity but finds no evidence for association with common variants. Heart. 2010;96(20):1651–1655. doi: 10.1136/hrt.2010.200121. [DOI] [PMC free article] [PubMed] [Google Scholar]
- 127.Xu Y.J., Wang J., Xu R., Zhao P.J., Wang X.K., Sun H.J. Detecting 22q11.2 deletion in Chinese children with conotruncal heart defects and single nucleotide polymorphisms in the haploid TBX1 locus. BMC Med Genet. 2011;12:169. doi: 10.1186/1471-2350-12-169. [DOI] [PMC free article] [PubMed] [Google Scholar]
- 128.Wang H., Chen D., Ma L., Meng H., Liu Y., Xie W. Genetic analysis of the TBX1 gene promoter in ventricular septal defects. Mol Cell Biochem. 2012;370(1–2):53–58. doi: 10.1007/s11010-012-1397-5. [DOI] [PubMed] [Google Scholar]
- 129.Fu Y., Li F., Zhao D.Y., Zhang J.S., Lv Y., Li-Ling J. Interaction between Tbx1 and Hoxd10 and connection with TGFbeta-BMP signal pathway during kidney development. Gene. 2014;536(1):197–202. doi: 10.1016/j.gene.2012.06.069. [DOI] [PubMed] [Google Scholar]
- 130.Shimoda M., Sugiura T., Imajyo I., Ishii K., Chigita S., Seki K. The T-box transcription factor Brachyury regulates epithelial-mesenchymal transition in association with cancer stem-like cells in adenoid cystic carcinoma cells. BMC Cancer. 2012;12:377. doi: 10.1186/1471-2407-12-377. [DOI] [PMC free article] [PubMed] [Google Scholar]
- 131.Herman S.B., Guo T., McGinn D.M., Blonska A., Shanske A.L., Bassett A.S. Overt cleft palate phenotype and TBX1 genotype correlations in velo-cardio-facial/DiGeorge/22q11.2 deletion syndrome patients. Am J Med Genet. 2012;158A(11):2781–2787. doi: 10.1002/ajmg.a.35512. [DOI] [PMC free article] [PubMed] [Google Scholar]
- 132.Zhang Y., Han Q., Li C., Li W., Fan H., Xing Q. Genetic analysis of the TBX1 gene promoter in indirect inguinal hernia. Gene. 2014;535(2):290–293. doi: 10.1016/j.gene.2013.11.012. [DOI] [PubMed] [Google Scholar]
- 133.Ge Y.Z., Xu Z., Xu L.W., Yu P., Zhao Y., Xin H. Pathway analysis of genome-wide association study on serum prostate-specific antigen levels. Gene. 2014;551(1):86–91. doi: 10.1016/j.gene.2014.08.044. [DOI] [PubMed] [Google Scholar]
- 134.Daly M.J., Rioux J.D., Schaffner S.F., Hudson T.J., Lander E.S. High-resolution haplotype structure in the human genome. Nat Genet. 2001;29(2):229–232. doi: 10.1038/ng1001-229. [DOI] [PubMed] [Google Scholar]
- 135.Kimmel G., Shamir R. A block-free hidden Markov model for genotypes and its application to disease association. J Comput Biol. 2005;12(10):1243–1260. doi: 10.1089/cmb.2005.12.1243. [DOI] [PubMed] [Google Scholar]
- 136.Zhang K., Deng M., Chen T., Waterman M.S., Sun F. A dynamic programming algorithm for haplotype block partitioning. Proc Natl Acad Sci USA. 2002;99(11):7335–7339. doi: 10.1073/pnas.102186799. [DOI] [PMC free article] [PubMed] [Google Scholar]
- 137.Zhang K., Qin Z.S., Liu J.S., Chen T., Waterman M.S., Sun F. Haplotype block partitioning and tag SNP selection using genotype data and their applications to association studies. Genome Res. 2004;14(5):908–916. doi: 10.1101/gr.1837404. [DOI] [PMC free article] [PubMed] [Google Scholar]
- 138.Katanforoush A., Sadeghi M., Pezeshk H., Elahi E. Global haplotype partitioning for maximal associated SNP pairs. BMC Bioinf. 2009;10:269. doi: 10.1186/1471-2105-10-269. [DOI] [PMC free article] [PubMed] [Google Scholar]
- 139.Zahiri J., Mahdevar G., Nowzari-Dalini A., Ahrabian H., Sadeghi M. A novel efficient dynamic programming algorithm for haplotype block partitioning. J Theor Biol. 2010;267(2):164–170. doi: 10.1016/j.jtbi.2010.08.019. [DOI] [PubMed] [Google Scholar]
- 140.Chen W.-P., Hung C.-L., Lin Y.-L. Efficient haplotype block partitioning and tag SNP selection algorithms under various constraints. Biomed Res Int. 2013;2013:984014. doi: 10.1155/2013/984014. [DOI] [PMC free article] [PubMed] [Google Scholar]
- 141.Pugach I., Matveyev R., Wollstein A., Kayser M., Stoneking M. Dating the age of admixture via wavelet transform analysis of genome-wide data. Genome Biol. 2011;12(2):R19. doi: 10.1186/gb-2011-12-2-r19. [DOI] [PMC free article] [PubMed] [Google Scholar]
- 142.Patil N., Berno A.J., Hinds D.A., Barrett W.A., Doshi J.M., Hacker C.R. Blocks of limited haplotype diversity revealed by high-resolution scanning of human chromosome 21. Science. 2001;294(5547):1719–1723. doi: 10.1126/science.1065573. [DOI] [PubMed] [Google Scholar]
- 143.Anderson E.C., Novembre J. Finding haplotype block boundaries by using the minimum-description-length principle. Am J Hum Genet. 2003;73(2):336–354. doi: 10.1086/377106. [DOI] [PMC free article] [PubMed] [Google Scholar]
- 144.Koivisto M., Perola M., Varilo T., Hennah W., Ekelund J., Lukk M. An MDL method for finding haplotype blocks and for estimating the strength of haplotype block boundaries. Pac Symp Biocomput. 2003;8:502–513. doi: 10.1142/9789812776303_0047. [DOI] [PubMed] [Google Scholar]
- 145.Pattaro C., Ruczinski I., Fallin D.M., Parmigiani G. Haplotype block partitioning as a tool for dimensionality reduction in SNP association studies. BMC Genom. 2008;9:405. doi: 10.1186/1471-2164-9-405. [DOI] [PMC free article] [PubMed] [Google Scholar]
- 146.Ionita-Laza I., Lee S., Makarov V., Buxbaum J.D., Lin X. Sequence kernel association tests for the combined effect of rare and common variants. Am J Hum Genet. 2013;92(6):841–853. doi: 10.1016/j.ajhg.2013.04.015. [DOI] [PMC free article] [PubMed] [Google Scholar]
- 147.Su S.C., Kuo C.C., Chen T. Inference of missing SNPs and information quantity measurements for haplotype blocks. Bioinformatics. 2005;21(9):2001–2007. doi: 10.1093/bioinformatics/bti261. [DOI] [PubMed] [Google Scholar]
Associated Data
This section collects any data citations, data availability statements, or supplementary materials included in this article.