

Previous studies have found that introduced plants commonly experience more favorable microbial interactions in their non-native range, suggesting that changes to the microbiome could be an important contributor to invasion success. Little is known about microbiome variation across native and invading populations, however, and the potential sources of more favorable interactions are undescribed. Here, we report one of the first microbiome comparisons of plants from multiple native and invading populations, in the noxious weed yellow starthistle. We identify clear differences in composition and diversity of microbiome bacteria. Our findings raise new questions about the sources of these differences, and we outline the next generation of research that will be required to connect microbiome variation to its potential role in plant invasions.
KEYWORDS: bacterial communities, invasive species, phyllosphere, plant microbiomes, rhizosphere, species introductions
ABSTRACT
Invasive species could benefit from being introduced to locations with more favorable species interactions, including the loss of enemies, the gain of mutualists, or the simplification of complex interaction networks. Microbiomes are an important source of species interactions with strong fitness effects on multicellular organisms, and these interactions are known to vary across regions. The highly invasive plant yellow starthistle (Centaurea solstitialis) has been shown to experience more favorable microbial interactions in its invasions of the Americas, but the microbiome that must contribute to this variation in interactions is unknown. We sequenced amplicons of 16S rRNA genes to characterize bacterial community compositions in the phyllosphere, ectorhizosphere, and endorhizosphere of yellow starthistle plants from seven invading populations in California, USA, and eight native populations in Europe. We tested for the differentiation of microbiomes by geography, plant compartment, and plant genotype. Bacterial communities differed significantly between native and invading plants within plant compartments, with consistently lower diversity in the microbiome of invading plants. The diversity of bacteria in roots was positively correlated with plant genotype diversity within both ranges, but this relationship did not explain microbiome differences between ranges. Our results reveal that these invading plants are experiencing either a simplified microbial environment or simplified microbial interactions as a result of the dominance of a few taxa within their microbiome. Our findings highlight several alternative hypotheses for the sources of variation that we observe in invader microbiomes and the potential for altered bacterial interactions to facilitate invasion success.
IMPORTANCE Previous studies have found that introduced plants commonly experience more favorable microbial interactions in their non-native range, suggesting that changes to the microbiome could be an important contributor to invasion success. Little is known about microbiome variation across native and invading populations, however, and the potential sources of more favorable interactions are undescribed. Here, we report one of the first microbiome comparisons of plants from multiple native and invading populations, in the noxious weed yellow starthistle. We identify clear differences in composition and diversity of microbiome bacteria. Our findings raise new questions about the sources of these differences, and we outline the next generation of research that will be required to connect microbiome variation to its potential role in plant invasions.
INTRODUCTION
Humans continue to transport plant species around the globe, and increasing numbers of these translocations result in the invasive expansion of non-native species into recipient communities (1–4). While there are undoubtedly many reasons that species introductions lead to invasions, there is growing evidence that novel species interactions may facilitate the invasive spread of populations (5, 6). Initially, hypotheses about the contribution of species interactions to invasions focused on the potential for non-native species to escape from aboveground herbivores, which are easily observed (7), though it is not clear that herbivore escape is a frequent mechanism of invasion (8–11). More recently, there has been increasing recognition that microbial taxa above- and belowground can have large effects on plant fitness, both positive and negative, and could thus determine whether invasive plants benefit from novel species interactions (5, 10, 12–17). Plant-associated microbial communities have been historically difficult to observe, however, and studies that leverage newly available tools to identify differences in these interactions across native and invading populations are needed to evaluate alternative hypotheses for invasion success (18).
Microbial communities have emerged as particularly likely candidates for facilitating invasions. Although many interactions between plants and microbes can be beneficial, soil microbial communities often appear to have negative net effects on plant fitness which may become more negative over time, e.g., via plant-soil feedbacks (15, 19–21). These interactions between plants and their microbiomes can vary over space and environment (22–25), creating opportunities for introduced plants to escape negative interactions that might characterize their native ranges. Moreover, reductions in microbial diversity can occur in response to environmental change and human disturbances, and lowered microbial diversity could reduce the resistance of ecosystems to invasion (16, 18, 26, 27).
Invasive plant species have provided some of the best evidence to date that microbial interactions can be locally evolved and can vary considerably over geographic regions (28). Introduced plants have been shown to vary in their response to soil communities from their native and invaded ranges, and there are now many examples of more favorable interactions between plants and soil from their invaded range, consistent with escape from enemies or a gain of mutualists during invasion (5, 12, 15, 16, 29–31). Plant-microbe interactions which provide relative benefits to invasive species can be explained by reduced negative effects of key microbial pathogens, increased direct beneficial effects of mutualistic taxa, or increased indirect benefits from taxa that affect competitors more negatively than the invader (18). It is also possible that invaders could benefit from a reduced diversity of enemy interactions, as a result of an associated reduction in ecological costs that derive from simultaneously deploying different defense responses against many different enemies (32–34). These hypotheses all require that there are differences in the microbial communities associated with invading versus native plants; however, the composition of microbial communities associated with different populations of invasive plants remains largely unknown (18).
Here, we conducted one of the first comparisons of plant microbiomes between invading populations and populations in the native source region. We surveyed plant-associated microbial communities in the highly invasive forb yellow starthistle (Centaurea solstitialis). Yellow starthistle is native to a wide region of Eurasia and was introduced from Western Europe to South America in the 1600s and North America in the 1800s as a contaminant of alfalfa seed (35, 36). This herbaceous annual is a colonizer of grassland ecosystems and is often cited as one of the “10 worst weeds of the West” in North America (37). Its extensive invasion of California in the USA (>14 million acres [38]) is particularly well studied, and invading genotypes in this region have evolved to grow larger and produce more flowers than plants in the native range, suggesting a shift in resource allocation that has favored invasiveness (39–41). Previous research has demonstrated that yellow starthistle throughout all of its native and invaded ranges experiences net fitness reductions when grown with its local soil microbial communities (42–44). These studies have also indicated that this negative interaction is weaker (more favorable) in California, raising the possibility that changes in the microbial community have promoted an aggressive invasion.
We sampled microbial communities associated with leaves (phyllosphere and endosphere) and roots (ectorhizosphere and endorhizosphere) of yellow starthistle plants in both the California invasion and native regions in Europe. Previous experiments with fungicide treatments have shown that plant-soil interactions between yellow starthistle and fungi in California are more negative (less favorable) than those in the native range, inconsistent with a role for fungi in beneficial species interactions in this invasion (45). Here, we focus on documenting the variation in bacterial communities, using high-throughput sequencing of ribosomal 16S amplicon sequences to quantify taxonomic composition and diversity of bacteria in yellow starthistle microbiomes. Microbial communities are known to differ among plant compartments (46) and to be influenced by individual plant genotypes (47–49), and so we explicitly tested for differences in the microbiomes of native and invaded range plants relative to the influence of both plant compartment and plant genotype. Our results reveal clear differences in the microbiomes of native and invading plants, including a lower diversity of bacteria associating with the leaves and roots of invaders. We identified several alternative hypotheses for these differences, and we outlined new research directions required to test for their effects on invader success.
RESULTS
Sampling and microbiome sequencing.
We sampled fifteen populations of yellow starthistle for their microbiomes: seven sampling sites across the invasion of California, six sites in Western Europe (native source region), and two in Eastern Europe (Fig. 1; see also Table S1 in the supplemental material). Tissue was collected from 25 plants per site at 1-m intervals along linear transects. DNA was extracted from surface and endophyte fractions of leaves and roots each pooled by sampling site (15 total populations) and as individual plant samples from 8 plants from each of 10 populations (80 total plants).
FIG 1.

The distribution (gray) of yellow starthistle and sampling sites (circles) for this study. Maps detail the native range in Eurasia (a) and the invasion of western North America (b). Previous work has indicated that Western Europe is the source for the severe invasion in CA, USA (both in dark shading; Barker et al. [36]). Sampling included seven locations in California (b, filled circles), six locations in Western Europe, and an additional two locations in Eastern Europe (a, open circles).
Collecting information for populations sampled in this study, including designation codes, localities, coordinates, sampling dates, and specimen accession numbers of plant collections at ARIZ. Download Table S1, DOCX file, 0.1 MB (134.9KB, docx) .
Copyright © 2019 Lu-Irving et al.
This content is distributed under the terms of the Creative Commons Attribution 4.0 International license.
To survey bacterial communities, we amplified the V4 region of the 16S rRNA locus. Library preparation utilized peptide nucleic acid clamps (PNAs) to block amplification of plant chloroplast and mitochondrial 16S (50), including a custom chloroplast PNA that we developed to account for sequence divergence in Asteraceae (51). Library preparation followed a dual-index approach (52), and samples were sequenced using 2 × 300-bp paired-end reads on an Illumina MiSeq.
Sequencing yielded 9,672,898 read pairs, of which 6,217,852 remained after merging and quality control; these were 253 bp in length after removing adapter and primer sequences. The numbers of raw read counts per sample ranged from 16 to 306,200 with a median of 21,964. Analysis of the merged and processed reads resulted in 4,014 operational taxonomic units (OTUs), of which 60 were identified as plastid or mitochondrial and 428 were unidentifiable (11%). Of the remaining 3,526, 206 were identified to species (6%), 1,084 to genus (27%), and 2,229 to family (56%) levels. A total of 103 OTUs (3%) were identified as members of the 49 genera with known plant pathogens in the FAPROTAX v.1.1 database (53).
Sequence reads representing yellow starthistle chloroplast and mitochondrial 16S accounted for 40% and 1% of all reads, respectively. Amplification of host chloroplast in samples using the Asteraceae-specific plastid PNA was reduced by up to 51% compared with the Lundberg et al. (50) PNA (see Table S2). Despite PNA blocking activity, 83% of the total reads from leaf endosphere samples were yellow starthistle chloroplast sequences. After the removal of chloroplast and mitochondrial reads, the remaining read counts for most leaf endosphere samples were low relative to the controls (see Fig. S1), and so no further analysis of leaf endosphere bacterial communities was performed.
Frequency distributions of unrarefied read counts for samples from all four plant compartments (native and invading population samples combined), as well as control (blank) samples. Vertical red lines indicate thresholds for rarefaction where relevant. Download FIG S1, EPS file, 1.3 MB (1.3MB, eps) .
Copyright © 2019 Lu-Irving et al.
This content is distributed under the terms of the Creative Commons Attribution 4.0 International license.
Comparison of host chloroplast blocking levels achieved by different PNA clamps in pooled endorhizosphere samples from two populations. Download Table S2, DOCX file, 0.05 MB (54.5KB, docx) .
Copyright © 2019 Lu-Irving et al.
This content is distributed under the terms of the Creative Commons Attribution 4.0 International license.
Rarefaction levels (chosen to reflect the minimum number of reads per sample by compartment, not including outliers) were 18,000 reads per sample for phyllosphere, 17,000 for ectorhizosphere, and 5,000 for endorhizosphere samples (Fig. S1). These levels were also higher than nearly all control samples. Rarefaction cutoffs resulted in the exclusion of five non-control samples which were outliers for low read count: one phyllosphere (code DIA), one ectorhizosphere (code SAZ), and three individual endorhizosphere samples (two from SAZ, one from SIE). A nonmetric multidimensional scaling (NMDS) ordination of all unrarefied samples showed that the controls clustered together and were clearly differentiated from all samples in all plant compartments other than the leaf endosphere (see Fig. S2).
NMDS plot of bacterial OTU composition in unrarefied control, phyllosphere, leaf endosphere, ectorhizosphere, and endorhizosphere samples (stress, 0.10). Download FIG S2, EPS file, 0.8 MB (772.5KB, eps) .
Copyright © 2019 Lu-Irving et al.
This content is distributed under the terms of the Creative Commons Attribution 4.0 International license.
Microbiome analyses.
Results from NMDS ordination indicated that bacterial communities differed overall among the phyllosphere, ectorhizosphere, and endorhizosphere compartments (stress, 0.14; P = 0.001) (Fig. 2a). Within compartments, NMDS further revealed significant differences between native and invaded range endorhizosphere samples (stress, 0.16; P = 0.001) (Fig. 2b) and ectorhizosphere samples (P = 0.001). Native and invaded range phyllosphere samples differed with marginal significance (P = 0.05). Clustering analyses within the phyllosphere and ectorhizosphere compartments consistently grouped invaded range samples together, as well as samples from the source region in Western Europe (see Fig. S3). Native range samples from Eastern Europe (HU01 and HU29) clustered together in these compartments but were variable in their relationship to the other regions. Endorhizosphere samples pooled by location showed less consistent clustering by range.
FIG 2.

NMDS plots of bacterial OTU composition in phyllosphere (green), ectorhizosphere (light blue), and endorhizosphere (dark blue) samples from native (open symbols) and invaded (closed symbols) ranges. Plotted are pooled samples for each sampling location, showing overall separation by range within compartment (stress, 0.14) (a), and individual plant endorhizosphere samples within native and invading populations (stress, 0.16) (b). Ellipses indicate 95% confidence intervals for samples grouped by range (native range, dashed lines; invaded range, solid lines).
Yellow starthistle populations clustered according to Bray-Curtis dissimilarity between rarefied, square root-transformed pooled samples from three plant compartments. Download FIG S3, EPS file, 0.7 MB (716.2KB, eps) .
Copyright © 2019 Lu-Irving et al.
This content is distributed under the terms of the Creative Commons Attribution 4.0 International license.
The dominant phyla among all bacterial communities in both ranges were Proteobacteria, Actinobacteria, Bacteroidetes, and Firmicutes (Fig. 3). Principal-component analyses suggested that the strongest contributions to variation in bacterial community composition among populations (within compartments) were made by shifts in the representation of Bacillus (Firmicutes), Chryseobacterium (Bacteroidetes), and the Proteobacteria taxa Erwinia, Pseudomonas, and Xanthomonadaceae (see Table S3 and Fig. S4). All of these taxa other than Chryseobacterium include known plant pathogens in the FAPROTAX v.1.1 database (53).
FIG 3.
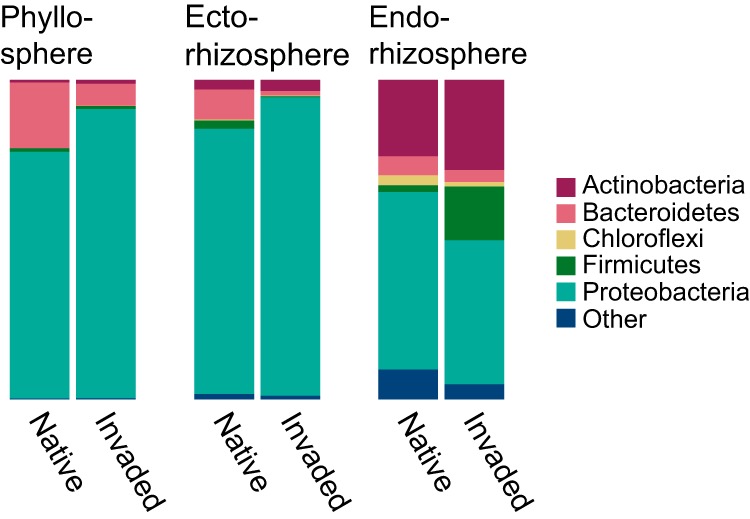
Relative abundances of (proportions of reads mapping to) phyla in yellow starthistle phyllosphere, ectorhizosphere, and endorhizosphere samples from native and invaded ranges.
Heatmaps showing the fraction of reads mapping to each of the top 25 OTUs in rarefied bulk samples from three plant compartments. The top five OTUs contributing to the first principal component separating native and invaded samples in each compartment are indicated with an asterisk. Taxonomic assignments for each OTU are given to the lowest taxonomic rank identified. Download FIG S4, EPS file, 0.6 MB (590.4KB, eps) .
Copyright © 2019 Lu-Irving et al.
This content is distributed under the terms of the Creative Commons Attribution 4.0 International license.
Loading by top 10 individual OTUs along first principal component axis from analysis of Hellinger-transformed data matrices for three plant compartments. Download Table S3, DOCX file, 0.08 MB (78.2KB, docx) .
Copyright © 2019 Lu-Irving et al.
This content is distributed under the terms of the Creative Commons Attribution 4.0 International license.
In general, bacterial OTUs showed a pattern of lower median richness (R), evenness (J), and diversity (eH′) for plants from invaded range sites in all compartments, with the exception of richness in the phyllosphere (Fig. 4 and 5). Within the phyllosphere, invaders were not significantly different in richness ( = 1.67, P = 0.20) but were significantly lower in evenness ( = 8.07, P = 0.005) and were marginally lower in Hill diversity ( = 3.75, P = 0.05) than native range plants. Similarly, the ectorhizosphere of invaders was not significantly different in richness ( = 0.69, P = 0.41) but was significantly lower in both evenness ( = 5.0, P = 0.03) and diversity ( = 6.21, P = 0.01). In contrast, endorhizosphere samples pooled by site did not differ significantly in evenness ( = 2.26, P = 0.13) but were marginally significantly lower in richness ( = 3.43, P = 0.06) and diversity ( = 3.01, P = 0.08). Nested analysis of variance (ANOVA) of individual endorhizosphere samples indicated strongly significant reductions in richness, evenness, and diversity in invading plants (fixed effect of region, all P < 0.001) (Fig. 5). For individual endorhizosphere samples, populations did not differ significantly in any metrics within native/invaded regions, with the exception of significantly higher evenness in plants at site SIE relative to site TRI in the invaded range.
FIG 4.

Distributions of OTU richness (a), evenness (b), and diversity (eH′) (c and d) among samples (pooled plants) from each location in the native and invaded ranges for phyllosphere, ectorhizosphere, and endorhizosphere compartments. Panels a to c show values for all OTUs and panel d shows values based on OTUs from known pathogen-containing genera.
FIG 5.

Distributions of endorhizosphere OTU richness (a), evenness (b), and diversity (eH′) (c and d) among individual plants at each location in the native and invaded ranges. Panels a to c show values for all OTUs and panel d shows values based on OTUs from known pathogen-containing genera.
To explore the potential for these patterns to capture plant-pathogen interaction in particular, we filtered the rarefied data sets for genera containing known plant pathogens in the FAPROTAX database, which resulted in 49 phyllosphere OTUs, 69 ectorhizosphere OTUs, and 88 endorhizosphere OTUs. While pathogen-containing genera are likely to include both pathogenic and nonpathogenic strains (54), we expected that our pathogen-containing OTU data set would be enriched for potential plant pathogens, relative to the full data set. Pseudomonas and Erwinia were among the most common pathogen-containing genera encountered in each plant compartment in both ranges. The phyllosphere also included a high frequency of Janthinobacterium, with a relative increase in Serratia in the invaded range. In the ectorhizosphere, Serratia was common in both ranges, but invading plants showed a large relative decline in Erwinia and increase in Pseudomonas. In the endorhizosphere, invading plants harbored less Pseudomonas and more Bacillus and Streptomyces than native plants (see Fig. S5). The diversity of these OTUs showed similar trends to the total diversity, with lower median values in invaded range root compartments. No differences between regions were statistically significant for the phyllosphere ( = 0.60, P = 0.44) or ectorhizosphere ( = 0.49, P = 0.48). For the endorhizosphere samples pooled by site, significantly lower diversity was indicated in the invaded range ( = 4.34, P = 0.04). For individual endorhizosphere samples, nested ANOVA also indicated significantly lower diversity in the invaded range (P < 0.0001), and no significant differences among populations within regions.
Proportion of rarefied read counts assigned to pathogen-containing genera in all samples according to plant compartment and range. Download FIG S5, EPS file, 1.2 MB (1.2MB, eps) .
Copyright © 2019 Lu-Irving et al.
This content is distributed under the terms of the Creative Commons Attribution 4.0 International license.
Finally, we examined the influence of plant genotype on microbial composition. Our geographic regions correspond to genetically differentiated subpopulations, and within these regions, our study sites are also known to vary in plant genetic diversity (36). Using estimates of the average proportion of pairwise nucleotide differences between alleles (π) for plants at each site from (36), we predicted microbial diversity estimates (eH′) for each plant compartment using linear models with fixed effects of plant genetic diversity, region (native versus invaded), and the interaction between these two effects. The model was significant for endorhizosphere samples pooled by site [F(2,12) = 5.89; P = 0.02; = 0.41) (Fig. 6), with significant main effects of both plant genetic diversity (P = 0.03) and region (native versus invaded, P = 0.006). The interaction between these two effects was not significant (P = 0.71) and was removed from the final model. This same pattern was marginally significant when using only OTUs from pathogen-containing genera in the endorhizosphere samples (effect of plant genetic diversity, P = 0.08). Similar linear models did not identify significant effects of plant genetic diversity when predicting the median diversity of individual plant endorhizosphere samples (P = 0.74) or diversity in the phyllosphere (P = 0.35). There was a marginally significant positive effect of plant genetic diversity on diversity in the ectorhizosphere (P = 0.08) in addition to the effect of region (P = 0.002).
FIG 6.
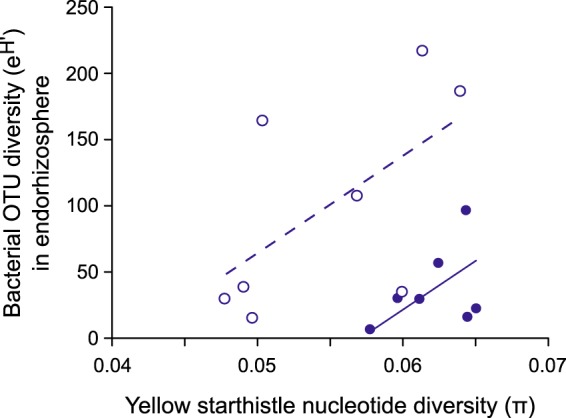
Bacterial diversity (eH′) in endorhizosphere samples pooled by sampling location, as a function of the genetic diversity among plants at the same sites (calculated as the average proportion of pairwise nucleotide differences between alleles [π] at variable positions in the genome; from Barker et al. [36]). Lines show significant positive relationships (linear model, P = 0.02) between microbial and plant diversity at sampling locations in both the native range (open symbols, dashed line) and the invaded range (closed symbols, solid line).
DISCUSSION
Introduced plants will encounter a variety of novel species interactions as they establish across biogeographic regions. For many plants, severe invasions are associated with more favorable interactions with soil microbial communities (18, 44). We found that bacterial microbiomes of invading yellow starthistle were unique in composition and lower in diversity relative to the bacterial microbiomes of plants from the native range, differences that persisted within plant compartments and across variation in plant genetic diversity.
As observed in other species, bacterial communities differed most among plant compartments (46, 55). The numbers and diversity of taxa within each compartment were similar in magnitude to those reported in other studies of prokaryotic 16S sequences, e.g., from Agavaceae (56), Brassicaceae (57), Cactaceae (58), and other Asteraceae (59). The dominant phyla were Proteobacteria, Actinobacteria, Bacteroidetes, and Firmicutes, which are also characteristic of plant-associated bacterial communities surveyed to date (46). The exception was the leaf endosphere, where a paucity of sequences relative to controls suggests that persistent chloroplast contamination obscured low frequency endophytes, despite our development of an Asteraceae-specific PNA (51). A targeted survey is needed to better characterize this compartment (e.g., quantitative PCR [60]).
Notably, diversity was approximately twice as high in the endorhizosphere as in the ectorhizosphere. Current reviews have concluded that root endosphere communities are typically less diverse than those in the ectorhizosphere (46, 55). Our root collections were washed but not surface sterilized and may represent some of the rhizoplane/rhizosphere in addition to the endosphere, elevating our estimates of diversity. It is also possible that yellow starthistle deviates from initially reported patterns, which have also been challenged by other recent studies (58, 59).
Within compartments, the community composition was consistently different between samples from native and invaded ranges and included shifts in taxa across all major groups. Our native range samples represented a larger geographic area and spanned distinct genetic subpopulations of yellow starthistle, but native range sites clustered together in overall community composition and there was little evidence of individual site differences within ranges. Between ranges, the diversity of OTUs was lower in the invaded range, a pattern that was dominated by lower evenness of OTUs in both the phyllosphere and ectorhizosphere and by lower richness of OTUs in the endorhizosphere. Thus, invading plants were more strongly dominated by a few taxa at high relative abundance on root and leaf surfaces and harbored fewer bacterial taxa in their root endophytic communities.
We observed a significant positive association between root microbial diversity and genotypic diversity among plants at the population scale. This association was strongest in the endorhizosphere, the only endophytic compartment in our analysis, consistent with plant genotype having the largest influence on microbial taxa colonizing within the plant itself (49, 61, 62). Within-species plant genotype effects have been observed previously and may interact with the effect of environment to shape microbial communities (24, 47). Interactions between plant and microbial diversity could be particularly important for invasive species, where genetic bottlenecks during establishment and range expansion can reduce genetic diversity among plants (63–65). Nevertheless, it appears that genotype effects are often minor relative to site effects (47–49, 66), and we found that genotypic effects were evident only within regions and did not explain microbial diversity differences between regions.
We propose three potential explanations for the regional differences in microbiome diversity that we have observed, which are not mutually exclusive. First, the regional microbial environment might be less diverse in western North America in general, such that plant microbiomes simply reflect the diversity present in their external environment. Second, yellow starthistle invasions might cause reductions in bacterial diversity in the environment. Third, invading yellow starthistle might be experiencing an outbreak of microbial infection, resulting in high abundance of a few taxa and reduced overall diversity in our samples. We discuss each of these hypotheses in turn below.
Microbial environments outside plants (e.g., in the soil and air) are known to vary at continental scales (47, 57, 67). A variety of factors may explain this geographic variation, particularly abiotic differences (22, 46, 55, 68). Soil type appears to have a particularly strong influence on microbial communities (e.g., see references 49 and 61), and is known to differ broadly across yellow starthistle’s range (45). In addition, populations in California are at the warm and dry extreme of yellow starthistle’s climatic niche (41), and our sampling was conducted at the end of a period of severe drought (69, 70), which could have amplified any microbial differences related to climate (71). Interestingly, a recent study of grassland plants found that microbial diversity increased under drought, whereas we found reduced diversity in the drought-affected range (72). A critical comparison of yellow starthistle’s external microbial environment in each range should include broad spatial and temporal sampling of soil and atmospheric microbial communities from which its microbiomes are assembling (73–75). A major challenge will be disentangling any regional differences in such samples from the effects of yellow starthistle itself, as we detail below.
Importantly, yellow starthistle’s invasion might also cause changes to its microbial environment. Species invasions have been shown to alter microbial composition over short timescales (76–78), though long-term effects are less clear (79, 80). Yellow starthistle invasions are denser than populations in the native range by an order of magnitude or more (42, 81) and include a lower diversity of plant species overall (82–84). Low plant diversity can sometimes depress the diversity of microbes in the environment and within plants (26, 56, 85). This means that invasions could be a cause rather than a result of observed weaker plant-soil interactions for invasive species in their introduced ranges (15, 18). Ideally, microbial communities would be compared among regions using samples outside patches of invasive plants, in a suitable habitat that has not yet been affected by an invasion, though identifying suitable but uninvaded habitat for these comparisons is not trivial. More practically, observing the development of soil microbial communities during plant-soil feedback experiments should be informative regarding the influence of invaders on microbial environments (18).
Finally, our invading plant populations might be experiencing disease outbreaks, resulting in a high abundance of a few strains and lower diversity of the microbiota as a whole. We think this is less likely, however. Disease outbreaks in plants tend to be local in scale, with microbial communities varying over the spatial scale of meters (86). Our invading populations are widely separated (e.g., they span >5° latitude), such that broadly shared disease patterns would imply that outbreaks are more common in the invading populations overall. Yet, it has been argued that invaders are successful precisely because they experience lower levels of attack from pathogens and other enemies (13, 15, 16), and yellow starthistle specifically has been shown to have more favorable interactions with its invaded range soil community (44). Again, broad spatial and temporal microbial sampling would be informative here for identifying outbreak dynamics, and plant-microbe interaction experiments in culture or field plantings would help to resolve the fitness effects of dominant strains.
To date, few studies have compared microbial community composition between the native and introduced ranges of invasive plants. McGinn and colleagues (87) reported no differences in the diversity of mutualistic fungal taxa associated with the roots of multiple species of European Trifolium introduced to New Zealand, despite more favorable soil interactions in the invasions (88; but see reference 89). Johansen and colleagues (90) found increased diversity of fungal communities on the roots of European Ammophila arenaria invading Australia and New Zealand, though there appear to be no differences in interactions with soil microbial communities in its invasions (in North America [91]). Gundale and colleagues explored the potential contribution of fungal endophyte communities to more favorable (negative) soil interactions observed in introduced plantations of lodgepole pine (Pinus contorta) from North America (92, 93). For lodgepole pine, microbial communities differed among several global regions examined, but there was no consistent pattern of loss of potential fungal pathogens or gain of mutualists in the introductions, and it remains unclear what part of the soil community is responsible for the observed differences in interactions across ranges (92). Reinhart and colleagues (94) focused specifically on Pythium fungal pathogens and quantified their virulence on North American Prunus serotina introduced to Europe. They found that the most virulent strains occurred only in the native range, consistent with benefits to invading plants escaping this specific pathogenic group. In the only microbiome comparison that included bacterial taxa, Finkel and colleagues (95, 96) explored the phyllosphere community of multiple species of Tamarix in native and introduced parts of their ranges, finding that microbial communities were in general most strongly structured by geographic region.
Our study is the first to find consistent differences in the microbiomes of native and invading plants which coincide with documented fitness differences in plant interactions with soil communities (44). Among the few invader microbiome studies to date, ours is unusual in focusing on the bacterial community. Fungi have historically received more attention for their fitness effects on plants, but bacteria can also play a critical role both as pathogens and mutualists (55, 97, 98). For yellow starthistle, previous experiments have demonstrated that fungal communities are not responsible for more favorable conditions in the invaded range (45), and our findings indicate that bacterial communities warrant further investigation as the potential source of these differences. The fitness effects of our specific OTUs are unknown, however, and identifying the bacterial OTUs that accumulate during interactions with plants would help to elucidate important pathogenic or mutualistic taxa and allow field surveys to explicitly test hypotheses that these strains are lost or gained in the invaded environment.
We have previously argued that yellow starthistle has benefitted from the historical loss of plant competitors in California (41). Disturbance is critical for yellow starthistle establishment, and functionally similar native species compete well against it in experiments; however, key competitors have been lost from the ecosystem due to perturbations prior to yellow starthistle invasion (45, 83, 99–101). Any benefits of altered bacterial communities could be independent of competition with native plant species, but these factors might also interact. Increased density due to a lack of competition could have reduced plant-associated microbial diversity, as described above. Yellow starthistle experiences negative plant-soil feedbacks across generations (42), however, and the build-up of high plant densities is therefore unlikely to generate more favorable soil interactions. Alternatively, the historical loss of native species diversity in California (84) could have resulted in the loss of associated microbial diversity (26, 56, 85), generating particularly strong opportunities for invasion into a system with both reduced plant competition and reduced pathogen diversity. Microbial surveys of remnant native communities, as well as across densities of yellow starthistle, would facilitate tests of alternative hypotheses for interacting effects of plant and microbial diversity, and it may be informative to explore microbial communities preserved on native plant specimens predating the extensive invasion of yellow starthistle in this region.
In conclusion, we found consistent differences between native and invading yellow starthistle plants in their bacterial microbiomes. These differences were robust to additional variation associated with plant compartment and the diversity of plant genotypes. Invaded range microbiomes differed in composition across major taxonomic groups and harbored a lower diversity of bacteria, including reduced evenness on the surfaces of leaves and roots and reduced richness of root endophytes. We suggest that bacteria could be the source of more favorable microbial interactions that have been previously observed in this invasion. Our findings also raise questions about (i) whether lower bacterial diversity is a feature of the invaded environment or whether it is caused by the invasion itself, and (ii) how specific differences in the microbial community affect plant fitness. These questions highlight the need for additional studies that compare microbial communities (including bacteria) associated with native and invading populations, that couple microbial community identification with plant-soil feedback and fitness experiments, and that examine the interaction of environment, plant diversity, and plant density on microbial communities and their fitness effects on plants.
MATERIALS AND METHODS
Study species.
Yellow starthistle (Centaurea solstitialis L., Asteraceae) is an obligately outcrossing annual plant, diploid throughout its range (102). Plants form a taproot and grow as a rosette through mild winter and/or spring conditions, bolting and producing flowering heads (capitula) throughout the summer. The species is native to Eurasia, where distinct genetic subpopulations have been identified in Mediterranean Western Europe, central-eastern Europe, Asia (including the Middle East), and the Balkan-Apennine peninsulas (36). The invasion in California, as well as invasions in South America, appears to be derived almost entirely from Western European genotypes (Fig. 1) (36).
Sample collection.
At each location in June-July 2015, plants were sampled every meter (or to the nearest meter mark) along a 25-m transect, to yield microbial samples from 25 individual plants per population. Individuals in rosette or early bolting stages were preferentially selected. In one population (HU29), low plant density yielded 20 individuals along the 25-m transect. Using sterile technique, plants were manually pulled and each individual sampled using modified versions of protocols by Lundberg et al. (49) and Lebeis et al. (62) as described below. Plants were pressed and dried after sampling and submitted to the University of Arizona Herbarium (ARIZ) (see Table S1 in the supplemental material).
(i) Phyllosphere and ectorhizosphere.
One to three basal nonsenescent leaves were collected from each plant, as well as the upper 2 to 5 cm of the taproot, together with accompanying lateral roots (excess soil was brushed or shaken off). Leaf and root samples were placed in individual 50-ml tubes containing 25 ml of sterile wash solution (45.9 mM NaH2PO4, 61.6 mM Na2HPO4, 0.1% Tween 20). Tubes were shaken by hand for 1 min (timed). Leaf and root samples were then removed and stored on ice in separate tubes (leaves in empty tubes, roots in tubes containing 10 ml of wash solution) until further processing. Wash samples were stored on ice during transport and then refrigerated at 4°C. Phyllosphere and ectorhizosphere washes were pooled across all (20 or 25) plants at a location and then centrifuged at 2,200 × g at 4°C for 15 min. Supernatants were discarded, and pellets were air-dried and stored at −20°C until DNA extraction.
(ii) Leaf endosphere.
Leaves were surface sterilized by submerging in bleach solution (10% commercial bleach, 0.1% Tween 20) for 2 min. Leaves were then rinsed in distilled water, patted dry using a Kimwipe, and sealed in individual sterile surgical envelopes (Fisherbrand 01-812-50). Envelopes were kept in silica gel desiccant until leaf tissue was completely dry and then stored at room temperature until DNA extraction.
(iii) Endorhizosphere.
Roots were further washed by shaking in 10 ml of wash solution until visible residual soil was removed. Washed roots were stored and dried as described above for leaves.
(iv) Controls.
At each collection site, a tube of sterile wash solution was left uncapped while sampling plants. Disinfected tools were periodically agitated in the blank wash tube before sterilization and use for the next sample collection. For each population, rinse water and wipes used to process tissue samples were represented in controls by rinsing and wiping flame-sterilized forceps and then agitating the forceps in the blank wash tube. Controls were stored and processed in the same manner as for phyllosphere and ectorhizosphere samples.
DNA extraction.
Extractions were carried out using sterile technique in a laminar flow hood. For pooled tissue extractions, equal sections of leaf tissue (50 mm2) and root tissue (12.5 mm3 plus 10 mm of lateral roots) were collected from each individual sample per location and pooled prior to extraction. Control (blank) samples were collected for each batch of extractions by swabbing tools and surfaces and then extracting DNA from the swab head.
All DNA samples were extracted using the Mo Bio PowerSoil kit (Mo Bio Laboratories, Inc.). Phyllosphere and ectorhizosphere DNA was extracted from up to 0.25 g of wash pellets according to the standard kit protocol. Leaf and root tissues were ground to powder or sawdust consistency in liquid nitrogen using sterile mortars and pestles. Leaf and root DNA was extracted from 20 mg (leaf) or 100 mg (root) of ground tissue with the following modification to the standard protocol: tissue was incubated at 65°C for 10 min in extraction buffer and then vortexed for 1 min, followed by a second 10-min incubation (as described under “alternative lysis methods” in the kit protocol). Control DNA was extracted by placing whole swab heads directly into extraction tubes. Extracted DNA was eluted in PCR-grade water and stored at −20°C pending library preparation.
Library preparation and sequencing.
To remove secondary compounds inhibiting PCR, DNA extracted from root and leaf tissue (together with corresponding blanks) was purified using a ZR-96 genomic DNA cleanup kit (Zymo Research). All DNA concentrations were quantified using a Qubit fluorometer high-sensitivity assay for double-stranded DNA (Invitrogen) and standardized to equimolar amounts.
Library preparation followed a dual-index approach (52) using a two-step PCR protocol as follows. In the first step (target-specific PCR), the V4 region of the 16S rRNA gene was amplified using target-specific primers (515F and 806R; 103) appended with common sequence (CS) tags through a linker sequence which varied from two to five nucleotides in length. Target-specific PCR was carried out using Phusion Flash master mix (Thermo Scientific) in a 25-μl reaction mixture volume in a Mastercycler Pro thermocycler (Eppendorf) under the following conditions: 25 cycles of 1 s at 98°C, 5 s at 78°C, 5 s at 57°C, and 15 s at 72°C. Products were visualized on an agarose gel and diluted up to 1:15 (depending on yield); 1 μl of diluted product was then used as the template in the second step (barcode-adapter attachment PCR). Using reagents and equipment as described above, barcoded primer pairs incorporating Illumina P5 and P7 adapters were used to amplify products from target-specific PCR in 25-μl reaction mixture volumes under the following conditions: 10 cycles of 1 s at 98°C, 5 s at 78°C, 5 s at 51°C, and 15 s at 72°C. Barcoded amplicons were quantified by fluorometry, pooled in equimolar amounts, cleaned, and submitted to the University of Idaho’s IBEST Genomic Resources Core for quality control (QC) and sequencing. Amplicons were multiplexed to use half the capacity of one 2 × 300-bp run on an Illumina MiSeq platform.
Peptide nucleic acid clamps (PNAs) were included in both PCR steps of library preparation to block amplification of plant chloroplast and mitochondrial 16S as recommended by Lundberg et al. (50). Clamp sequences published by Lundberg et al. (50) were compared with chloroplast and mitochondrial 16S sequences from yellow starthistle and three other species of Asteraceae with published organellar genomes (Centaurea diffusa, Helianthus annuus, and Lactuca sativa). We found a single nucleotide mismatch between the Asteraceae chloroplast 16S and the plastid PNA sequences, and designed an alternative plastid PNA specific to the Asteraceae sequence (5′-GGCTCAACTCTGGACAG-3′) (51). All samples for this study were amplified using the plastid PNA of our design, together with the mitochondrial PNA published by Lundberg et al. (50). To gauge the effectiveness of our alternative PNA, two duplicate samples were processed using both PNAs published by Lundberg et al. (50).
Identification of operational taxa and potential plant pathogens.
Demultiplexed paired reads were merged and quality filtered using tools from the USEARCH package version 9.0.2132 (104). Merged reads were truncated to uniform lengths, and primer sequences were removed using a combination of the seqtk toolkit version 1.2 (https://github.com/lh3/seqtk) and a custom script. The UPARSE pipeline (105) implemented in the USEARCH package was used for further data processing and analysis: unique sequences were identified, and those represented only once or twice in the processed read set were discarded as likely PCR or sequencing errors. Remaining sequences were clustered into operational taxonomic units (OTUs) at a 97% threshold, chimeras were filtered out, and per-sample OTU read counts were tabulated using the UPARSE-OTU algorithm. Assignment of OTUs to nearest taxonomic match in the Greengenes database (106) was carried out using the UCLUST algorithm implemented in QIIME version 1.9.1 (107, 108). Data were further processed using tools from the QIIME package: reads mapping to chloroplast and mitochondrial OTUs were removed, and samples were rarefied by plant compartment. Rarefaction levels were chosen to reflect the distribution of read counts per sample within plant compartments, subsampling to the minimum number of reads necessary to include all samples except those that were outliers for low read count.
Taxa known to contain plant pathogens were identified using the FAPROTAX database (version 1.1 (53). A list of all genera included under the “plant pathogen” functional category was used to filter our OTU tables by taxonomic assignment.
Microbial community analyses.
All statistical analyses were performed in R (109). We evaluated differences in bacterial community composition between plant compartments and between native and invaded ranges within plant compartments by performing nonmetric multidimensional scaling (NMDS) using the R packages vegan (110) and MASS (111). Individual plant samples or samples pooled within sampling site provided replicates in these comparisons. Ordinations were based on Bray-Curtis distances and were performed using a two-dimensional configuration to minimize stress, using Wisconsin double-standardized and square root-transformed data, with expanded weighted averages of species scores added to the final NMDS solution. Significant differences among plant compartments and between native and invaded samples were assessed using the envfit function in vegan. Ellipses were drawn on NMDS plots using the vegan function ordiellipse, representing 95% confidence limits of the standard error of the weighted average of scores.
We further explored the underlying correlates of bacterial community variation using principal-component analysis (PCA; using R function prcomp) for samples from native and invaded ranges within each plant compartment. Prior to performing the PCA, we performed Hellinger’s transformation to minimize the influence of OTUs with low counts or many zeros (112–114). We then identified the OTUs with the highest loading on the dominant PC axis of variation by examining the matrix of variable loadings produced by prcomp. The OTU composition of samples pooled by sampling site (phyllosphere, ectorhizosphere, and endorhizosphere samples [“pooled samples”]) was visualized using a heatmap generated in ggplot2 (115), and samples were hierarchically clustered by Bray-Curtis dissimilarity (hclust function in R) using McQuitty’s method (116).
We compared the diversity of OTUs between the native and invaded range for each plant compartment using richness (R), evenness (Pielou’s J [117]), and their combined effects via the Hill series exponent eH′ (118) of the Shannon diversity index (H′ [119]). Again, individual plant samples or samples pooled by sampling site provided replicates in these comparisons. Diversity values were calculated using the packages vegan and iNEXT (120) and compared between native and invaded ranges using a nonparametric Kruskal-Wallis rank sum test on rarefied read counts. For plant tissue samples that included multiple individuals per site, we compared diversity between regions using a nested ANOVA with fixed effects of region and population nested within region, and among sites using a post hoc Kruskal-Wallis test within regions. We conducted these comparisons on a data set including all OTUs and a reduced data set including only OTUs assigned to genera with known plant pathogens according to the FAPROTAX database, as described above.
Accession numbers.
Sequence data are available under NCBI SRA accession number PRJNA494717. Sampling locations and herbarium accession numbers of plant specimens are given in Table S1.
ACKNOWLEDGMENTS
We thank D. Lundberg and S. Lebeis for helpful discussions regarding sampling design; G. Reardon and C. Chandeyson for assistance with field collections; E. Arnold, J. Aspinwall, J. Braasch, E. Carlson, K. Hockett, P. Humphries, T. O’Connor, M. Schneider, J. U’Ren, and N. Zimmerman for 16S library preparation assistance and discussion; A. Gerritsen, D. New, and staff at IBEST for assistance with sequencing; K. Andonian, J. Hierro, and reviewers for helpful feedback on the manuscript. We also thank C. E. Morris for hosting the European sample processing at INRA Station de Pathologie Végétale, Montfavet, France.
Data collection and analyses performed by the IBEST Genomics Resources Core at the University of Idaho were supported in part by NIH COBRE grant P30GM103324. This study was supported by USDA grant 2015-67013-23000 to K.M.D., D.A.B., and S.M.S.
P.L.-I., D.A.B., and K.M.D. designed the study. P.L.-I. and J.H. collected the samples with assistance from H.S., S.M.S., and S.R.W. P.L.-I. conducted the microbial sequencing and bioinformatics. P.L.-I., S.R.W., and K.M.D. analyzed the data. P.L.-I. and K.M.D. wrote the manuscript, which was edited by all authors.
REFERENCES
- 1.Lonsdale WM. 1999. Global patterns of plant invasions and the concept of invasibility. Ecology 80:1522–1536. doi: 10.1890/0012-9658(1999)080[1522:GPOPIA]2.0.CO;2. [DOI] [Google Scholar]
- 2.Butchart SHM, Walpole M, Collen B, van Strien A, Scharlemann JPW, Almond REA, Baillie JEM, Bomhard B, Brown C, Bruno J, Carpenter KE, Carr GM, Chanson J, Chenery AM, Csirke J, Davidson NC, Dentener F, Foster M, Galli A, Galloway JN, Genovesi P, Gregory RD, Hockings M, Kapos V, Lamarque J-F, Leverington F, Loh J, McGeoch MA, McRae L, Minasyan A, Morcillo MH, Oldfield TEE, Pauly D, Quader S, Revenga C, Sauer JR, Skolnik B, Spear D, Stanwell-Smith D, Stuart SN, Symes A, Tierney M, Tyrrell TD, Vie J-C, Watson R. 2010. Global biodiversity: indicators of recent declines. Science 328:1164–1168. doi: 10.1126/science.1187512. [DOI] [PubMed] [Google Scholar]
- 3.Essl F, Dullinger S, Rabitsch W, Hulme PE, Hülber K, Jarošík V, Kleinbauer I, Krausmann F, Kühn I, Nentwig W, Vilà M, Genovesi P, Gherardi F, Desprez-Loustau M-L, Roques A, Pyšek P. 2011. Socioeconomic legacy yields an invasion debt. Proc Natl Acad Sci U S A 108:203–207. doi: 10.1073/pnas.1011728108. [DOI] [PMC free article] [PubMed] [Google Scholar]
- 4.Ellis EC, Antill EC, Kreft H. 2012. All is not loss: plant biodiversity in the Anthropocene. PLoS One 7:e30535. doi: 10.1371/journal.pone.0030535. [DOI] [PMC free article] [PubMed] [Google Scholar]
- 5.Mitchell CE, Agrawal AA, Bever JD, Gilbert GS, Hufbauer RA, Klironomos JN, Maron JL, Morris WF, Parker IM, Power AG, Seabloom EW, Torchin ME, Vázquez DP. 2006. Biotic interactions and plant invasions. Ecol Lett 9:726–740. doi: 10.1111/j.1461-0248.2006.00908.x. [DOI] [PubMed] [Google Scholar]
- 6.Pearson DE, Ortega YK, Eren Ö, Hierro JL. 2018. Community assembly theory as a framework for biological invasions. Trends Ecol Evol 33:313–325. doi: 10.1016/j.tree.2018.03.002. [DOI] [PubMed] [Google Scholar]
- 7.Keane R, Crawley MJ. 2002. Exotic plant invasions and the enemy release hypothesis. Trends Ecol Evol 17:164–170. doi: 10.1016/S0169-5347(02)02499-0. [DOI] [Google Scholar]
- 8.Felker-Quinn E, Schweitzer JA, Bailey JK. 2013. Meta-analysis reveals evolution in invasive plant species but little support for evolution of increased competitive ability (EICA). Ecol Evol 3:739–751. doi: 10.1002/ece3.488. [DOI] [PMC free article] [PubMed] [Google Scholar]
- 9.Levine JM, Adler PB, Yelenik SG. 2004. A meta-analysis of biotic resistance to exotic plant invasions. Ecol Lett 7:975–989. doi: 10.1111/j.1461-0248.2004.00657.x. [DOI] [Google Scholar]
- 10.Agrawal AA, Kotanen PM, Mitchell CE, Power AG, Godsoe W, Klironomos J. 2005. Enemy release? An experiment with congeneric plant pairs and diverse above- and belowground enemies. Ecology 86:2979–2989. doi: 10.1890/05-0219. [DOI] [Google Scholar]
- 11.Maron JL, Vila M. 2001. When do herbivores affect plant invasion? Evidence for the natural enemies and biotic resistance hypotheses. Oikos 95:361–373. doi: 10.1034/j.1600-0706.2001.950301.x. [DOI] [Google Scholar]
- 12.Callaway RM, Thelen GC, Rodriguez A, Holben WE. 2004. Soil biota and exotic plant invasion. Nature 427:731–733. doi: 10.1038/nature02322. [DOI] [PubMed] [Google Scholar]
- 13.Colautti RI, Ricciardi A, Grigorovich IA, MacIsaac HJ. 2004. Is invasion success explained by the enemy release hypothesis? Ecol Lett 7:721–733. doi: 10.1111/j.1461-0248.2004.00616.x. [DOI] [Google Scholar]
- 14.Torchin ME, Mitchell CE. 2004. Parasites, pathogens, and invasions by plants and animals. Front Ecol Environ 2:183–190. doi: 10.1890/1540-9295(2004)002[0183:PPAIBP]2.0.CO;2. [DOI] [Google Scholar]
- 15.Kulmatiski A, Beard KH, Stevens JR, Cobbold SM. 2008. Plant-soil feedbacks: a meta-analytical review. Ecol Lett 11:980–992. doi: 10.1111/j.1461-0248.2008.01209.x. [DOI] [PubMed] [Google Scholar]
- 16.van der Putten WH, Bradford MA, Pernilla Brinkman E, van de Voorde TFJ, Veen GF. 2016. Where, when and how plant-soil feedback matters in a changing world. Funct Ecol 30:1109–1121. doi: 10.1111/1365-2435.12657. [DOI] [Google Scholar]
- 17.Faillace CA, Lorusso NS, Duffy S. 2017. Overlooking the smallest matter: viruses impact biological invasions. Ecol Lett 20:524–538. doi: 10.1111/ele.12742. [DOI] [PubMed] [Google Scholar]
- 18.Dawson W, Schrama M. 2016. Identifying the role of soil microbes in plant invasions. J Ecol 104:1211–1218. doi: 10.1111/1365-2745.12619. [DOI] [Google Scholar]
- 19.Bever JD. 2003. Soil community feedback and the coexistence of competitors: conceptual frameworks and empirical tests. New Phytol 157:465–473. doi: 10.1046/j.1469-8137.2003.00714.x. [DOI] [PubMed] [Google Scholar]
- 20.Reinhart KO, Callaway RM. 2006. Soil biota and invasive plants. New Phytol 170:445–457. doi: 10.1111/j.1469-8137.2006.01715.x. [DOI] [PubMed] [Google Scholar]
- 21.Petermann JS, Fergus AJF, Turnbull LA, Schmid B. 2008. Janzen-Connell effects are widespread and strong enough to maintain diversity in grasslands. Ecology 89:2399–2406. doi: 10.1890/07-2056.1. [DOI] [PubMed] [Google Scholar]
- 22.Nemergut DR, Schmidt SK, Fukami T, O'Neill SP, Bilinski TM, Stanish LF, Knelman JE, Darcy JL, Lynch RC, Wickey P, Ferrenberg S. 2013. Patterns and processes of microbial community assembly. Microbiol Mol Biol Rev 77:342–356. doi: 10.1128/MMBR.00051-12. [DOI] [PMC free article] [PubMed] [Google Scholar]
- 23.van der Putten WH, Bardgett RD, Bever JD, Bezemer TM, Casper BB, Fukami T, Kardol P, Klironomos JN, Kulmatiski A, Schweitzer JA, Suding KN, Van de Voorde TFJ, Wardle DA. 2013. Plant-soil feedbacks: the past, the present and future challenges. J Ecol 101:265–276. doi: 10.1111/1365-2745.12054. [DOI] [Google Scholar]
- 24.terHorst CP, Zee PC. 2016. Eco-evolutionary dynamics in plant-soil feedbacks. Funct Ecol 30:1062–1072. doi: 10.1111/1365-2435.12671. [DOI] [Google Scholar]
- 25.Lankau RA, Keymer DP. 2018. Simultaneous adaptation and maladaptation of tree populations to local rhizosphere microbial communities at different taxonomic scales. New Phytol 217:1267–1278. doi: 10.1111/nph.14911. [DOI] [PubMed] [Google Scholar]
- 26.Schnitzer SA, Klironomos JN, Hillerislambers J, Kinkel LL, Reich PB, Xiao K, Rillig MC, Sikes BA, Callaway RM, Mangan SA, van Nes EH, Scheffer M. 2011. Soil microbes drive the classic plant diversity-productivity pattern. Ecology 92:296–303. doi: 10.1890/10-0773.1. [DOI] [PubMed] [Google Scholar]
- 27.Wagg C, Bender SF, Widmer F, van der Heijden MGA. 2014. Soil biodiversity and soil community composition determine ecosystem multifunctionality. Proc Natl Acad Sci U S A 111:5266–5270. doi: 10.1073/pnas.1320054111. [DOI] [PMC free article] [PubMed] [Google Scholar]
- 28.Rout ME, Callaway RM. 2012. Interactions between exotic invasive plants and soil microbes in the rhizosphere suggest that “everything is not everywhere”. Ann Bot 110:213–222. doi: 10.1093/aob/mcs061. [DOI] [PMC free article] [PubMed] [Google Scholar]
- 29.Reinhart KO, Packer A, van der Putten WH, Clay K. 2003. Plant-soil biota interactions and spatial distribution of black cherry in its native and invasive ranges. Ecol Lett 6:1046–1050. doi: 10.1046/j.1461-0248.2003.00539.x. [DOI] [Google Scholar]
- 30.Engelkes T, Morriën E, Verhoeven KJF, Bezemer TM, Biere A, Harvey JA, McIntyre LM, Tamis WLM, van der Putten WH. 2008. Successful range-expanding plants experience less above-ground and below-ground enemy impact. Nature 456:946–948. doi: 10.1038/nature07474. [DOI] [PubMed] [Google Scholar]
- 31.Maron JL, Klironomos J, Waller L, Callaway RM. 2014. Invasive plants escape from suppressive soil biota at regional scales. J Ecol 102:19–27. doi: 10.1111/1365-2745.12172. [DOI] [Google Scholar]
- 32.Agrawal AA. 2007. Macroevolution of plant defense strategies. Trends Ecol Evol 22:103–109. doi: 10.1016/j.tree.2006.10.012. [DOI] [PubMed] [Google Scholar]
- 33.Colautti RI, Lau JA. 2015. Contemporary evolution during invasion: evidence for differentiation, natural selection, and local adaptation. Mol Ecol 24:1999–2017. doi: 10.1111/mec.13162. [DOI] [PubMed] [Google Scholar]
- 34.Smakowska E, Kong J, Busch W, Belkhadir Y. 2016. Organ-specific regulation of growth-defense tradeoffs by plants. Curr Opin Plant Biol 29:129–137. doi: 10.1016/j.pbi.2015.12.005. [DOI] [PubMed] [Google Scholar]
- 35.Gerlach JD. 1997. How the West was lost: reconstructing the invasion dynamics of yellow starthistle and other plant invaders of western rangelands and natural areas, 3:67–72. California Exotic Pest Plant Council Symposium Proceedings, Concord, CA. [Google Scholar]
- 36.Barker BS, Andonian K, Swope SM, Luster DG, Dlugosch KM. 2017. Population genomic analyses reveal a history of range expansion and trait evolution across the native and invaded range of yellow starthistle (Centaurea solstitialis). Mol Ecol 26:1131–1147. doi: 10.1111/mec.13998. [DOI] [PMC free article] [PubMed] [Google Scholar]
- 37.DiTomaso JM, Healy EA. 2007. Weeds of California and other western states. University of California Department of Agriculture and Natural Resources, Oakland, CA. [Google Scholar]
- 38.Pitcairn M, Schoenig S, Yacoub R, Gendron J. 2006. Yellow starthistle continues its spread in California. Calif Agric (Berkeley) 60:83–90. doi: 10.3733/ca.v060n02p83. [DOI] [Google Scholar]
- 39.Widmer TL, Guermache F, Dolgovskaia MY, Reznik SY. 2007. Enhanced growth and seed properties in introduced vs. native populations of yellow starthistle (Centaurea solstitialis). Weed Sci 55:465–473. doi: 10.1614/WS-06-211R.1. [DOI] [Google Scholar]
- 40.Eriksen RL, Desronvil T, Hierro JL, Kesseli R. 2012. Morphological differentiation in a common garden experiment among native and non-native specimens of the invasive weed yellow starthistle (Centaurea solstitialis). Biol Invasions 14:1459–1467. doi: 10.1007/s10530-012-0172-6. [DOI] [Google Scholar]
- 41.Dlugosch KM, Cang FA, Barker BS, Andonian K, Swope SM, Rieseberg LH. 2015. Evolution of invasiveness through increased resource use in a vacant niche. Nat Plants 1:15066. doi: 10.1038/nplants.2015.66. [DOI] [PMC free article] [PubMed] [Google Scholar]
- 42.Andonian K, Hierro JL, Khetsuriani L, Becerra P, Janoyan G, Villarreal D, Cavieres L, Fox LR, Callaway RM. 2011. Range-expanding populations of a globally introduced weed experience negative plant-soil feedbacks. PLoS One 6:e20117. doi: 10.1371/journal.pone.0020117. [DOI] [PMC free article] [PubMed] [Google Scholar]
- 43.Andonian K, Hierro JL, Khetsuriani L, Becerra PI, Janoyan G, Villareal D, Cavieres LA, Fox LR, Callaway RM. 2012. Geographic mosaics of plant-soil microbe interactions in a global plant invasion. J Biogeogr 39:600–608. doi: 10.1111/j.1365-2699.2011.02629.x. [DOI] [Google Scholar]
- 44.Andonian K, Hierro JL. 2011. Species interactions contribute to the success of a global plant invader. Biol Invasions 13:2957–2965. doi: 10.1007/s10530-011-9978-x. [DOI] [Google Scholar]
- 45.Hierro JL, Khetsuriani L, Andonian K, Eren Ö, Villarreal D, Janoian G, Reinhart KO, Callaway RM. 2017. The importance of factors controlling species abundance and distribution varies in native and non-native ranges. Ecography 40:991–1002. doi: 10.1111/ecog.02633. [DOI] [Google Scholar]
- 46.Bulgarelli D, Schlaeppi K, Spaepen S, Ver Loren van Themaat E, Schulze-Lefert P. 2013. Structure and functions of the bacterial microbiota of plants. Annu Rev Plant Biol 64:807–838. doi: 10.1146/annurev-arplant-050312-120106. [DOI] [PubMed] [Google Scholar]
- 47.Peiffer JA, Spor A, Koren O, Jin Z, Tringe SG, Dangl JL, Buckler ES, Ley RE. 2013. Diversity and heritability of the maize rhizosphere microbiome under field conditions. Proc Natl Acad Sci U S A 110:6548–6553. doi: 10.1073/pnas.1302837110. [DOI] [PMC free article] [PubMed] [Google Scholar]
- 48.Bodenhausen N, Bortfeld-Miller M, Ackermann M, Vorholt JA. 2014. A synthetic community approach reveals plant genotypes affecting the phyllosphere microbiota. PLoS Genet 10:e1004283. doi: 10.1371/journal.pgen.1004283. [DOI] [PMC free article] [PubMed] [Google Scholar]
- 49.Lundberg DS, Lebeis SL, Paredes SH, Yourstone S, Gehring J, Malfatti S, Tremblay J, Engelbrektson A, Kunin V, del Rio TG, Edgar RC, Eickhorst T, Ley RE, Hugenholtz P, Tringe SG, Dangl JL. 2012. Defining the core Arabidopsis thaliana root microbiome. Nature 488:86–90. doi: 10.1038/nature11237. [DOI] [PMC free article] [PubMed] [Google Scholar]
- 50.Lundberg DS, Yourstone S, Mieczkowski P, Jones CD, Dangl JL. 2013. Practical innovations for high-throughput amplicon sequencing. Nat Methods 10:999–1002. doi: 10.1038/nmeth.2634. [DOI] [PubMed] [Google Scholar]
- 51.Fitzpatrick CR, Lu-Irving P, Copeland J, Guttman DS, Wang PW, Baltrus DA, Dlugosch KM, Johnson MTJ. 2018. Chloroplast sequence variation and the efficacy of peptide nucleic acids for blocking host amplification in plant microbiome studies. Microbiome 6:144. doi: 10.1186/s40168-018-0534-0. [DOI] [PMC free article] [PubMed] [Google Scholar]
- 52.Kozich JJ, Westcott SL, Baxter NT, Highlander SK, Schloss PD. 2013. Development of a dual-index sequencing strategy and curation pipeline for analyzing amplicon sequence data on the MiSeq Illumina sequencing platform. Appl Environ Microbiol 79:5112–5120. doi: 10.1128/AEM.01043-13. [DOI] [PMC free article] [PubMed] [Google Scholar]
- 53.Louca S, Jacques SMS, Pires APF, Leal JS, Srivastava DS, Parfrey LW, Farjalla VF, Doebeli M. 2016. High taxonomic variability despite stable functional structure across microbial communities. Nat Ecol Evol 1:15. doi: 10.1038/s41559-016-0015. [DOI] [PubMed] [Google Scholar]
- 54.Newton AC, Fitt BDL, Atkins SD, Walters DR, Daniell TJ. 2010. Pathogenesis, parasitism and mutualism in the trophic space of microbe-plant interactions. Trends Microbiol 18:365–373. doi: 10.1016/j.tim.2010.06.002. [DOI] [PubMed] [Google Scholar]
- 55.Vandenkoornhuyse P, Quaiser A, Duhamel M, Le Van A, Dufresne A. 2015. The importance of the microbiome of the plant holobiont. New Phytol 206:1196–1206. doi: 10.1111/nph.13312. [DOI] [PubMed] [Google Scholar]
- 56.Coleman-Derr D, Desgarennes D, Fonseca-Garcia C, Gross S, Clingenpeel S, Woyke T, North G, Visel A, Partida-Martinez LP, Tringe SG. 2016. Plant compartment and biogeography affect microbiome composition in cultivated and native Agave species. New Phytol 209:798–811. doi: 10.1111/nph.13697. [DOI] [PMC free article] [PubMed] [Google Scholar]
- 57.Bodenhausen N, Horton MW, Bergelson J. 2013. Bacterial communities associated with the leaves and the roots of Arabidopsis thaliana. PLoS One 8:e56329. doi: 10.1371/journal.pone.0056329. [DOI] [PMC free article] [PubMed] [Google Scholar]
- 58.Fonseca-García C, Coleman-Derr D, Garrido E, Visel A, Tringe SG, Partida-Martínez LP. 2016. The cacti microbiome: interplay between habitat-filtering and host-specificity. Front Microbiol 7:150. doi: 10.3389/fmicb.2016.00150. [DOI] [PMC free article] [PubMed] [Google Scholar]
- 59.Leff JW, Lynch RC, Kane NC, Fierer N. 2017. Plant domestication and the assembly of bacterial and fungal communities associated with strains of the common sunflower, Helianthus annuus. New Phytol 214:412–423. doi: 10.1111/nph.14323. [DOI] [PubMed] [Google Scholar]
- 60.Fierer N, Jackson JA, Vilgalys R, Jackson RB. 2005. Assessment of soil microbial community structure by use of taxon-specific quantitative PCR assays. Appl Environ Microbiol 71:4117–4120. doi: 10.1128/AEM.71.7.4117-4120.2005. [DOI] [PMC free article] [PubMed] [Google Scholar]
- 61.Bulgarelli D, Rott M, Schlaeppi K, Ver Loren van Themaat E, Ahmadinejad N, Assenza F, Rauf P, Huettel B, Reinhardt R, Schmelzer E, Peplies J, Gloeckner FO, Amann R, Eickhorst T, Schulze-Lefert P. 2012. Revealing structure and assembly cues for Arabidopsis root-inhabiting bacterial microbiota. Nature 488:91–95. doi: 10.1038/nature11336. [DOI] [PubMed] [Google Scholar]
- 62.Lebeis SL, Paredes SH, Lundberg DS, Breakfield N, Gehring J, McDonald M, Malfatti S, Glavina del Rio T, Jones CD, Tringe SG, Dangl JL. 2015. Salicylic acid modulates colonization of the root microbiome by specific bacterial taxa. Science 349:860–864. doi: 10.1126/science.aaa8764. [DOI] [PubMed] [Google Scholar]
- 63.Dlugosch KM, Parker IM. 2008. Founding events in species invasions: genetic variation, adaptive evolution, and the role of multiple introductions. Mol Ecol 17:431–449. doi: 10.1111/j.1365-294X.2007.03538.x. [DOI] [PubMed] [Google Scholar]
- 64.Excoffier L, Foll M, Petit RJ. 2009. Genetic consequences of range expansions. Annu Rev Ecol Evol Syst 40:481–501. doi: 10.1146/annurev.ecolsys.39.110707.173414. [DOI] [Google Scholar]
- 65.Uller T, Leimu R. 2011. Founder events predict changes in genetic diversity during human-mediated range expansions. Glob Chang Biol 17:3478–3485. doi: 10.1111/j.1365-2486.2011.02509.x. [DOI] [Google Scholar]
- 66.Bulgarelli D, Garrido-Oter R, Münch PC, Weiman A, Dröge J, Pan Y, McHardy AC, Schulze-Lefert P. 2015. Structure and function of the bacterial root microbiota in wild and domesticated barley. Cell Host Microbe 17:392–403. doi: 10.1016/j.chom.2015.01.011. [DOI] [PMC free article] [PubMed] [Google Scholar]
- 67.Durán P, Thiergart T, Garrido-Oter R, Agler M, Kemen E, Schulze-Lefert P, Hacquard S. 2018. Microbial interkingdom interactions in roots promote Arabidopsis survival. Cell 175:973–983.e14. doi: 10.1016/j.cell.2018.10.020. [DOI] [PMC free article] [PubMed] [Google Scholar]
- 68.Fierer N, Jackson RB. 2006. The diversity and biogeography of soil bacterial communities. Proc Natl Acad Sci U S A 103:626–631. doi: 10.1073/pnas.0507535103. [DOI] [PMC free article] [PubMed] [Google Scholar]
- 69.Griffin D, Anchukaitis KJ. 2014. How unusual is the 2012–2014 California drought? Geophys Res Lett 41:9017–9023. doi: 10.1002/2014GL062433. [DOI] [Google Scholar]
- 70.Diffenbaugh NS, Swain DL, Touma D. 2015. Anthropogenic warming has increased drought risk in California. Proc Natl Acad Sci U S A 112:3931–3936. doi: 10.1073/pnas.1422385112. [DOI] [PMC free article] [PubMed] [Google Scholar]
- 71.Schrama M, Bardgett RD. 2016. Grassland invasibility varies with drought effects on soil functioning. J Ecol 104:1250–1258. doi: 10.1111/1365-2745.12606. [DOI] [Google Scholar]
- 72.terHorst CP, Lennon JT, Lau JA. 2014. The relative importance of rapid evolution for plant-microbe interactions depends on ecological context. Proc Biol Sci 281:20140028. doi: 10.1098/rspb.2014.0028. [DOI] [PMC free article] [PubMed] [Google Scholar]
- 73.Whipps JM, Hand P, Pink D, Bending GD. 2008. Phyllosphere microbiology with special reference to diversity and plant genotype. J Appl Microbiol 105:1744–1755. doi: 10.1111/j.1365-2672.2008.03906.x. [DOI] [PubMed] [Google Scholar]
- 74.Kamutando CN, Vikram S, Kamgan-Nkuekam G, Makhalanyane TP, Greve M, Roux JJL, Richardson DM, Cowan D, Valverde A. 2017. Soil nutritional status and biogeography influence rhizosphere microbial communities associated with the invasive tree Acacia dealbata. Sci Rep 7:6472. doi: 10.1038/s41598-017-07018-w. [DOI] [PMC free article] [PubMed] [Google Scholar]
- 75.Edwards J, Johnson C, Santos-Medellín C, Lurie E, Podishetty NK, Bhatnagar S, Eisen JA, Sundaresan V. 2015. Structure, variation, and assembly of the root-associated microbiomes of rice. Proc Natl Acad Sci U S A 112:E911–E920. doi: 10.1073/pnas.1414592112. [DOI] [PMC free article] [PubMed] [Google Scholar]
- 76.Lekberg Y, Gibbons SM, Rosendahl S, Ramsey PW. 2013. Severe plant invasions can increase mycorrhizal fungal abundance and diversity. ISME J 7:1424–1433. doi: 10.1038/ismej.2013.41. [DOI] [PMC free article] [PubMed] [Google Scholar]
- 77.Collins CG, Carey CJ, Aronson EL, Kopp CW, Diez JM. 2016. Direct and indirect effects of native range expansion on soil microbial community structure and function. J Ecol 104:1271–1283. doi: 10.1111/1365-2745.12616. [DOI] [Google Scholar]
- 78.Gibbons SM, Lekberg Y, Mummey DL, Sangwan N, Ramsey PW, Gilbert JA, Shade A. 2017. Invasive plants rapidly reshape soil properties in a grassland ecosystem. mSystems 2:e00178-16. doi: 10.1128/mSystems.00178-16. [DOI] [PMC free article] [PubMed] [Google Scholar]
- 79.Lankau RA. 2011. Resistance and recovery of soil microbial communities in the face of Alliaria petiolata invasions. New Phytol 189:536–548. doi: 10.1111/j.1469-8137.2010.03481.x. [DOI] [PubMed] [Google Scholar]
- 80.Day NJ, Dunfield KE, Antunes PM. 2015. Temporal dynamics of plant-soil feedback and root-associated fungal communities over 100 years of invasion by a non-native plant. J Ecol 103:1557–1569. doi: 10.1111/1365-2745.12459. [DOI] [Google Scholar]
- 81.Uygur S, Smith L, Uygur FN, Cristofaro M, Balciunas J. 2004. Population densities of yellow starthistle (Centaurea solstitialis) in Turkey. Weed Sci 52:746–753. doi: 10.1614/WS-03-150R1. [DOI] [Google Scholar]
- 82.Seabloom EW, Harpole WS, Reichman OJ, Tilman D. 2003. Invasion, competitive dominance, and resource use by exotic and native California grassland species. Proc Natl Acad Sci U S A 100:13384–13389. doi: 10.1073/pnas.1835728100. [DOI] [PMC free article] [PubMed] [Google Scholar]
- 83.Zavaleta ES, Hulvey KB. 2004. Realistic species losses disproportionately reduce grassland resistance to biological invaders. Science 306:1175–1177. doi: 10.1126/science.1102643. [DOI] [PubMed] [Google Scholar]
- 84.D’Antonio CM, Malmstrom C, Reynolds SA, Gerlach J. 2007. Ecology of invasive non-native species in California grassland, p. 67–83. In Stromberg MR, Corbin JD, D’Antonio CM (ed), California grasslands: ecology and management. University of California Press, Berkeley, CA. [Google Scholar]
- 85.Garbeva P, van Veen JA, van Elsas JD. 2004. Microbial diversity in soil: selection microbial populations by plant and soil type and implications for disease suppressiveness. Annu Rev Phytopathol 42:243–270. doi: 10.1146/annurev.phyto.42.012604.135455. [DOI] [PubMed] [Google Scholar]
- 86.Gilbert GS. 2002. Evolutionary ecology of plant diseases in natural ecosystems. Annu Rev Phytopathol 40:13–43. doi: 10.1146/annurev.phyto.40.021202.110417. [DOI] [PubMed] [Google Scholar]
- 87.McGinn KJ, van der Putten WH, Duncan RP, Shelby N, Weser C, Hulme PE. 2016. Trifolium species associate with a similar richness of soil-borne mutualists in their introduced and native ranges. J Biogeogr 43:944–954. doi: 10.1111/jbi.12690. [DOI] [Google Scholar]
- 88.McGinn KJ, van der Putten WH, Hulme PE, Shelby N, Weser C, Duncan RP. 2018. The influence of residence time and geographic extent on the strength of plant-soil feedbacks for naturalised Trifolium. J Ecol 106:207–217. doi: 10.1111/1365-2745.12864. [DOI] [Google Scholar]
- 89.Parker IM, Gilbert GS. 2007. When there is no escape: the effects of natural enemies on native, invasive, and noninvasive plants. Ecology 88:1210–1224. doi: 10.1890/06-1377. [DOI] [PubMed] [Google Scholar]
- 90.Johansen RB, Johnston P, Mieczkowski P, Perry GLW, Robeson MS, Vilgalys R, Burns BR. 2017. Scattered far and wide: a broadly distributed temperate dune grass finds familiar fungal root associates in its invasive range. Soil Biol Biochem 112:177–190. doi: 10.1016/j.soilbio.2017.05.007. [DOI] [Google Scholar]
- 91.Beckstead J, Parker IM. 2003. Invasiveness of Ammophila arenaria: release from soil-borne pathogens? Ecology 84:2824–2831. doi: 10.1890/02-0517. [DOI] [Google Scholar]
- 92.Gundale MJ, Almeida JP, Wallander H, Wardle DA, Kardol P, Nilsson M-C, Fajardo A, Pauchard A, Peltzer DA, Ruotsalainen S, Mason B, Rosenstock N. 2016. Differences in endophyte communities of introduced trees depend on the phylogenetic relatedness of the receiving forest. J Ecol 104:1219–1232. doi: 10.1111/1365-2745.12595. [DOI] [Google Scholar]
- 93.Gundale MJ, Kardol P, Nilsson M-C, Nilsson U, Lucas RW, Wardle DA. 2014. Interactions with soil biota shift from negative to positive when a tree species is moved outside its native range. New Phytol 202:415–421. doi: 10.1111/nph.12699. [DOI] [PubMed] [Google Scholar]
- 94.Reinhart KO, Tytgat T, van der Putten WH, Clay K. 2010. Virulence of soil-borne pathogens and invasion by Prunus serotina. New Phytol 186:484–495. doi: 10.1111/j.1469-8137.2009.03159.x. [DOI] [PubMed] [Google Scholar]
- 95.Finkel OM, Burch AY, Lindow SE, Post AF, Belkin S. 2011. Geographical location determines the population structure in phyllosphere microbial communities of a salt-excreting desert tree. Appl Environ Microbiol 77:7647–7655. doi: 10.1128/AEM.05565-11. [DOI] [PMC free article] [PubMed] [Google Scholar]
- 96.Finkel OM, Delmont TO, Post AF, Belkin S. 2016. Metagenomic signatures of bacterial adaptation to life in the phyllosphere of a salt-secreting desert tree. Appl Environ Microbiol 82:2854–2861. doi: 10.1128/AEM.00483-16. [DOI] [PMC free article] [PubMed] [Google Scholar]
- 97.Herrera Paredes S, Lebeis SL. 2016. Giving back to the community: microbial mechanisms of plant-soil interactions. Funct Ecol 30:1043–1052. doi: 10.1111/1365-2435.12684. [DOI] [Google Scholar]
- 98.Haney CH, Samuel BS, Bush J, Ausubel FM. 2015. Associations with rhizosphere bacteria can confer an adaptive advantage to plants. Nat Plants 1:15051. doi: 10.1038/nplants.2015.51. [DOI] [PMC free article] [PubMed] [Google Scholar]
- 99.Hooper DU, Dukes JS. 2010. Functional composition controls invasion success in a California serpentine grassland. J Ecol 98:764–777. doi: 10.1111/j.1365-2745.2010.01673.x. [DOI] [Google Scholar]
- 100.Hierro JL, Lortie CJ, Villarreal D, Estanga-Mollica ME, Callaway RM. 2011. Resistance to Centaurea solstitialis invasion from annual and perennial grasses in California and Argentina. Biol Invasions 13:2249–2259. doi: 10.1007/s10530-011-0037-4. [DOI] [Google Scholar]
- 101.Hulvey KB, Zavaleta ES. 2012. Abundance declines of a native forb have nonlinear impacts on grassland invasion resistance. Ecology 93:378–388. doi: 10.1890/11-0091.1. [DOI] [PubMed] [Google Scholar]
- 102.Irimia R-E, Montesinos D, Eren Ö, Lortie CJ, French K, Cavieres LA, Sotes GJ, Hierro JL, Jorge A, Loureiro J. 2017. Extensive analysis of native and non-native Centaurea solstitialis L. populations across the world shows no traces of polyploidization. PeerJ 5:e3531. doi: 10.7717/peerj.3531. [DOI] [PMC free article] [PubMed] [Google Scholar]
- 103.Caporaso JG, Lauber CL, Walters WA, Berg-Lyons D, Lozupone CA, Turnbaugh PJ, Fierer N, Knight R. 2011. Global patterns of 16S rRNA diversity at a depth of millions of sequences per sample. Proc Natl Acad Sci U S A 108 Suppl 1:4516–4522. doi: 10.1073/pnas.1000080107. [DOI] [PMC free article] [PubMed] [Google Scholar]
- 104.Edgar RC, Flyvbjerg H. 2015. Error filtering, pair assembly and error correction for next-generation sequencing reads. Bioinformatics 31:3476–3482. doi: 10.1093/bioinformatics/btv401. [DOI] [PubMed] [Google Scholar]
- 105.Edgar RC. 2013. UPARSE: highly accurate OTU sequences from microbial amplicon reads. Nat Methods 10:996–998. doi: 10.1038/nmeth.2604. [DOI] [PubMed] [Google Scholar]
- 106.McDonald D, Price MN, Goodrich J, Nawrocki EP, DeSantis TZ, Probst A, Andersen GL, Knight R, Hugenholtz P. 2012. An improved Greengenes taxonomy with explicit ranks for ecological and evolutionary analyses of bacteria and archaea. ISME J 6:610–618. doi: 10.1038/ismej.2011.139. [DOI] [PMC free article] [PubMed] [Google Scholar]
- 107.Caporaso JG, Kuczynski J, Stombaugh J, Bittinger K, Bushman FD, Costello EK, Fierer N, Peña AG, Goodrich JK, Gordon JI, Huttley GA, Kelley ST, Knights D, Koenig JE, Ley RE, Lozupone CA, McDonald D, Muegge BD, Pirrung M, Reeder J, Sevinsky JR, Turnbaugh PJ, Walters WA, Widmann J, Yatsunenko T, Zaneveld J, Knight R. 2010. QIIME allows analysis of high-throughput community sequencing data. Nat Methods 7:335–336. doi: 10.1038/nmeth.f.303. [DOI] [PMC free article] [PubMed] [Google Scholar]
- 108.Edgar RC. 2010. Search and clustering orders of magnitude faster than BLAST. Bioinformatics 26:2460–2461. doi: 10.1093/bioinformatics/btq461. [DOI] [PubMed] [Google Scholar]
- 109.R Core Team 2015. R: a language and environment for statistical computing. R Foundation for Statistical Computing, Vienna, Austria. [Google Scholar]
- 110.Oksanen J, Blanchet FG, Friendly M, Kindt R, Legendre P, McGlinn D, Minchin PR, O’Hara RB, Simpson GL, Solymos P, Stevens MHH, Szoecs E, Wagner H. 2016. vegan: community ecology package. R Foundation for Statistical Computing, Vienna, Austria. [Google Scholar]
- 111.Venables WN, Ripley BD. 2002. Random and mixed effects, p. 271–300. In Venables WN, Ripley BD (ed), Modern Applied Statistics with S. Springer New York, New York, NY. [Google Scholar]
- 112.Legendre P, Legendre L. 1998. Numerical ecology. Elsevier Science, Amsterdam. [Google Scholar]
- 113.Legendre P, Gallagher ED. 2001. Ecologically meaningful transformations for ordination of species data. Oecologia 129:271–280. doi: 10.1007/s004420100716. [DOI] [PubMed] [Google Scholar]
- 114.Ramette A. 2007. Multivariate analyses in microbial ecology. FEMS Microbiol Ecol 62:142–160. doi: 10.1111/j.1574-6941.2007.00375.x. [DOI] [PMC free article] [PubMed] [Google Scholar]
- 115.Wickham H. 2009. ggplot2: elegant graphics for data analysis. Springer-Verlag, New York, NY. [Google Scholar]
- 116.McQuitty LL. 1966. Similarity analysis by reciprocal pairs for discrete and continuous data. Educ Psychol Meas 26:825–831. doi: 10.1177/001316446602600402. [DOI] [Google Scholar]
- 117.Pielou EC. 1966. The measurement of diversity in different types of biological collections. J Theor Biol 13:131–144. doi: 10.1016/0022-5193(66)90013-0. [DOI] [Google Scholar]
- 118.Hill MO. 1973. Diversity and evenness: a unifying notation and its consequences. Ecology 54:427–432. doi: 10.2307/1934352. [DOI] [Google Scholar]
- 119.Shannon CE. 1948. A mathematical theory of communication. Bell System Technical J 27:379–423. doi: 10.1002/j.1538-7305.1948.tb01338.x. [DOI] [Google Scholar]
- 120.Hsieh TC, Ma KH, Chao A. 2016. iNEXT: an R package for rarefaction and extrapolation of species diversity (Hill numbers). Methods Ecol Evol 7:1451–1456. doi: 10.1111/2041-210X.12613. [DOI] [Google Scholar]
Associated Data
This section collects any data citations, data availability statements, or supplementary materials included in this article.
Supplementary Materials
Collecting information for populations sampled in this study, including designation codes, localities, coordinates, sampling dates, and specimen accession numbers of plant collections at ARIZ. Download Table S1, DOCX file, 0.1 MB (134.9KB, docx) .
Copyright © 2019 Lu-Irving et al.
This content is distributed under the terms of the Creative Commons Attribution 4.0 International license.
Frequency distributions of unrarefied read counts for samples from all four plant compartments (native and invading population samples combined), as well as control (blank) samples. Vertical red lines indicate thresholds for rarefaction where relevant. Download FIG S1, EPS file, 1.3 MB (1.3MB, eps) .
Copyright © 2019 Lu-Irving et al.
This content is distributed under the terms of the Creative Commons Attribution 4.0 International license.
Comparison of host chloroplast blocking levels achieved by different PNA clamps in pooled endorhizosphere samples from two populations. Download Table S2, DOCX file, 0.05 MB (54.5KB, docx) .
Copyright © 2019 Lu-Irving et al.
This content is distributed under the terms of the Creative Commons Attribution 4.0 International license.
NMDS plot of bacterial OTU composition in unrarefied control, phyllosphere, leaf endosphere, ectorhizosphere, and endorhizosphere samples (stress, 0.10). Download FIG S2, EPS file, 0.8 MB (772.5KB, eps) .
Copyright © 2019 Lu-Irving et al.
This content is distributed under the terms of the Creative Commons Attribution 4.0 International license.
Yellow starthistle populations clustered according to Bray-Curtis dissimilarity between rarefied, square root-transformed pooled samples from three plant compartments. Download FIG S3, EPS file, 0.7 MB (716.2KB, eps) .
Copyright © 2019 Lu-Irving et al.
This content is distributed under the terms of the Creative Commons Attribution 4.0 International license.
Heatmaps showing the fraction of reads mapping to each of the top 25 OTUs in rarefied bulk samples from three plant compartments. The top five OTUs contributing to the first principal component separating native and invaded samples in each compartment are indicated with an asterisk. Taxonomic assignments for each OTU are given to the lowest taxonomic rank identified. Download FIG S4, EPS file, 0.6 MB (590.4KB, eps) .
Copyright © 2019 Lu-Irving et al.
This content is distributed under the terms of the Creative Commons Attribution 4.0 International license.
Loading by top 10 individual OTUs along first principal component axis from analysis of Hellinger-transformed data matrices for three plant compartments. Download Table S3, DOCX file, 0.08 MB (78.2KB, docx) .
Copyright © 2019 Lu-Irving et al.
This content is distributed under the terms of the Creative Commons Attribution 4.0 International license.
Proportion of rarefied read counts assigned to pathogen-containing genera in all samples according to plant compartment and range. Download FIG S5, EPS file, 1.2 MB (1.2MB, eps) .
Copyright © 2019 Lu-Irving et al.
This content is distributed under the terms of the Creative Commons Attribution 4.0 International license.