Abstract.
The refractive index of blood is a key biophysical parameter, which can reflect the physiological state. We measured the refractive index of whole blood and other components, such as serum, plasma, and hemoglobin, based on internal reflection by using a homemade apparatus in the spectral range of 400 to 750 nm. In addition to the hemoglobin solution, which has a Soret band about 420 nm and two Q-bands between 500 and 600 nm, the measurements of other samples are the normal dispersion curve. The results are approximated by the Cauchy equation and Sellmeier equation, and the correlation coefficients are more than 0.997.
Keywords: optical parameters, refractive index, dispersion, biotissue, total internal reflection method
1. Introduction
It is known that the study of optical properties of biological tissue contains much information that plays an important role in medical diagnostics and therapy.1–7 The optical properties of blood are required for a number of methods, such as optical coherent tomography,8 transmission electron microscopy,9 and derivative total internal reflection method,10 to calculate the distribution in the sample. As an important optical parameter, the refractive index of blood sample, which reflects the physiological state and functions regularity, appears crucial in many fields. Blood analysis, which depends on the measurement of refractive index, is widely used as a diagnostic basis for clinical application. Blood plasma and serum are the most substantial biochemical samples in clinical examination, and the substantial difference between them is whether it contains fibrinogen or not.11 For example, Li et al.12 determined the refractive index of different types of human blood sample based on the total internal reflection, and the measurements have an important reference value in pathology and medical laboratory sciences. Mazarevica et al.13 reported a qualitative relationship that the values of the refractive indices of red blood cells (RBCs) significantly decrease for the diabetic patients compared with healthy donors at the same pH level, and Maximov et al.14 confirmed this a few years later. Park et al.15 determined that the refractive index of RBCs declined due to the volume of cytoplasm reduced during infection and used it as an important indicator to diagnose malaria. The refractive index of RBCs can also be seen as a parameter for diagnosis of anemia.16
Normal human whole blood consists of about 55% plasma (90% water and 10% proteins) and 45% cells (99% erythrocytes, 1% leukocytes, and thrombocytes).17 Light adsorbing and scattering properties of blood depend on the refractive index of erythrocytes, which is mainly determined by the concentration of hemoglobin in erythrocytes. According to past research, the measurements of optical properties of blood components focus on absorption, scattering, anisotropy factor, and refractive index at certain wavelengths. The complex refractive index of blood is defined as ; here, the real refractive index describes energy storage and the imaginary refractive index describes energy dissipation and specifies the extinction coefficient.18 There are many investigations on the absorption behavior of hemoglobin, and both the real and imaginary parts of refractive index can be calculated. Ghosh et al.19 gave an equation for calculating the real part of the refractive index of hemoglobin solutions depending on the concentration:
| (1) |
where is the specific refraction increment in dL/g and is the hemoglobin concentration in g/dL. Many studies used phantoms instead of whole blood, and the range of measured wavelengths is limited to a few specific wavelengths. As a consequence, the optical information of the blood sample is missing partly.
In this paper, we present the real part of refractive index of blood components, such as plasma and serum, which were investigated for their effect on the optical properties of whole blood. The continuous complex refractive index dispersion (CRID) of whole blood and blood component solutions was measured in the spectral region of 400 to 750 nm, and spectral resolution is about 0.263 nm. In addition, comparisons were made between our results and the ones reported in the literature. The results of blood plasma and serum present the normal dispersion property, and hemoglobin solution presents a Soret band of about 420 nm and two Q-bands between 500 and 600 nm. The Cauchy equation and Sellmeier equation are used to approximate our results, respectively, and the correlation coefficients are more than 0.997.
2. Material and Methods
2.1. Blood Preparation
Fresh blood sample was obtained from a male adult rabbit by femoral artery puncture and placed in anticoagulation and nonanticoagulation tubes, which used heparin sodium as the anticoagulant. Blood serum was prepared by nonanticoagulation whole blood which was centrifuged at a speed of 3000 rpm for 10 min. Blood plasma and erythrocytes were obtained by centrifuging anticoagulation whole blood at a speed of 2500 rpm for 10 min. The erythrocytes were washed with saline solution until supernatant was transparent after low speed centrifugation.7 Then, erythrocyte samples were frozen () and thawed four times, which caused hemolysis to release hemoglobin.20 After filtering out the cell membranes, hemoglobin concentration was placed in the dialysis dag surrounding phosphate-buffered saline solution (pH 7.4) for 12 h in order to remove small molecular weight impurity. All samples are maintained at pH 7.4. All experiments on animals followed the ethical principles and standards.
2.2. Experimental Setup and Methods
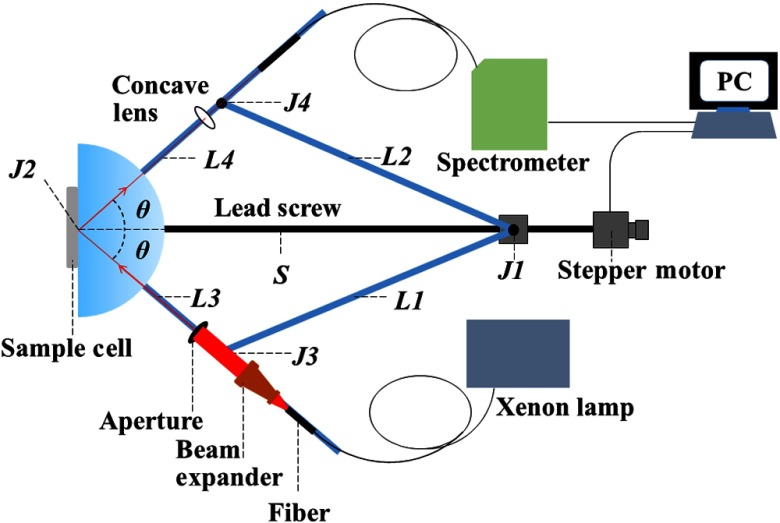
In the illustrated apparatus as shown in Fig. 1, which is similar to Ref. 21, four arms labeled L1, L2, L3, and L4 are connected by high precision bearings with intersection points J1, J2, J3, and J4. A slider fixed on J1 can move along the lead screw, driven by a stepper motor. J2 coincides with the center of the semicylindrical prism (ZF4). The sample cell is placed on the prism surface and its center is in accord with J2. L1 and L2 used as towed arms. The light beam travels along L3, which passes through a fiber, a beam expander, and an aperture (), and an aperture, and the light beam is received by the spectrometer (HR4000, Ocean Optics) on the reflector arm L4. The incident angle depending on the symmetry of the device can be measured as
| (2) |
where , , and are the lengths of J1J3, J2J3, and J1J2, respectively. Therefore, incident angle varies with which is defined as . According to Ref. 22, water is considered as a standard sample for system calibration, and the length of can be obtained when incident angle comes to the critical angle of water. The is the length of the relative movement of the slider. The reflection spectra of sample and air are measured in the same angle range, respectively. Thus, the reflection intensity can be obtained from in a continuous wavelength range. Based on the Fresnel equation, the reflectance of the sample could be calculated; hence, the refractive index is obtained. The correlation coefficient of the fitting program is defined as
| (3) |
Fig. 1.
The schematic of the experimental apparatus.
Here, and are the values of measured and calculated reflectance, respectively, and is the mean value of measured reflectance over whole incident angle. The value of is between 0 and 1, and the value closer to 1 which represents a reliable fitting to be obtained.
3. Results and Discussion
3.1. Blood Serum and Plasma
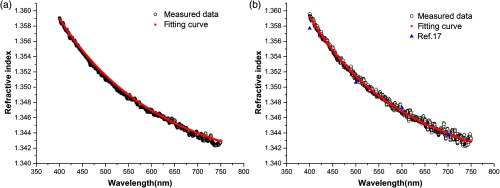
The dispersion of blood serum and plasma in visible wavelength range is shown in Fig. 2. The refractive index of serum and plasma decreases while the wavelength increases. It is shown that there is only a marginal difference between serum and plasma. The composition of plasma in human and rabbit is basically unanimous, then compared with Meinke’s results,17 our results are close to their measured data. There are several fitting equations about refractive index of biotissue given by some research. As Ding et al.23 have done, we selected the Cauchy equation:
| (4) |
Fig. 2.
The measured continuous CRIDs and fitting curves of (a) blood serum and (b) blood plasma.
The coefficients , and calculated by nonlinear fitting program are shown in Table 1. The cooperation between the approximated curve of the Cauchy equation and our measurement is shown in Figs. 2(a) and 2(b). In the range of measured wavelengths, the fitting coefficients values better than 0.997.
Table 1.
The coefficients of Cauchy equation of serum and plasma.
| Sample | A | B | C |
|---|---|---|---|
| Serum | 1.3350 | ||
| Plasma | 1.3353 |
3.2. Whole Blood
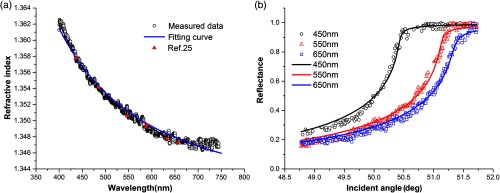
The CRID curve of whole blood is shown in Fig. 3(a). The curve of refractive index of whole blood is decreasing monotonically. The descent of RI is more rapid than other samples we measured, which is consistent with the results in the literature.24 Because of the individual difference, the RI values of whole blood are reported from 1.36 to 1.44,4,25,26 and most of them were measured at single wavelength. As Lazareva et al. has done,24 we selected the Sellmeier equation [Eq. (5)] and the blood refractive index model based on the measured results of refractive index of albumin and hemoglobin to calculate the refractive index of whole blood. The coefficients of the Sellmeier equation are listed in Table 2. The experiment and fitted reflectance curve of whole blood at different wavelengths in which the interval between two adjacent wavelengths is about 100 nm is shown in Fig. 3(b), the critical angles decrease with increasing wavelengths and their fitting coefficients are more than 0.985
| (5) |
Fig. 3.
(a) The measured continuous CRID of whole blood, compared with the Sellmeier equation and the blood refractive index model; (b) the experiment and fitted reflectance curves of whole blood.
Table 2.
The coefficients of Sellmeier equations of whole blood.
| A1 | A2 | B1 | B2 |
|---|---|---|---|
| 0.7960 | 5.1819 |
3.3. Hemoglobin
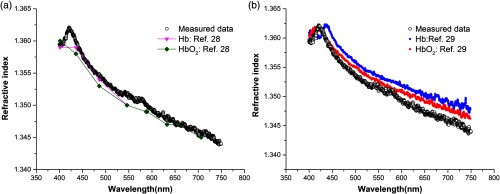
In Fig. 4(a), it is shown that the anomalous dispersion occurs at 420 nm. According to Eq. (1), the concentration of hemoglobin solution was about 88 g/L. Compared to previous research results,27 our result is greater than the 90 g/L solution of Hb and . In contrast to our samples, the configured solutions used in Ref. 27 do not contain other impurity constituents. Unlike the fresh blood, our sample obtained by femoral artery puncture, contained oxyhemoglobin and deoxyhemoglobin. Therefore, the peak position of hemoglobin solution is about 420 nm, which is between the peak of Hb and curves28 in Fig. 4 (b), and it has a shift of the Soret band apparent relative to Ref. 27. Meanwhile, our results present two Q-bands of hemoglobin in the range of 500 to 600 nm.
Fig. 4.
The measured continuous CRID of hemoglobin solution, compared with (a) Ref. 27 and (b) Ref. 28.
4. Conclusion
For this work, the continuous CRID of whole blood and each component is determined in the spectral range of 400 to 750 nm, which is more accurate than the results of equation fitting. As far as we know, this is the first time that continuous CRID of whole blood and each component has been measured. The results can be useful for blood analysis, clinical examination, and study of hematology.
Acknowledgments
The authors thank the National Key R&D Program of China (Grant No. 2018YFF0212105), the Natural Science Foundation of China (Grant No. 61475078), and the National Natural Science Foundation (Grant No. 31527801).
Biographies
Shike Liu completed her bachelor’s degree in the School of Electrical and Information Engineering from the Harbin Institute of Technology, China, in June 2014. Currently, she is studying for her PhD degree in the School of Physics at Nankai University. Her studies cover the optical properties measurement of biotissue.
Zhichao Deng received his PhD from the School of Physics from Nankai University, China, in 2016. Now, he is mainly engaged in research on biomedical refractive index.
Jianwei Li received his PhD in optics from Nankai University, China, in 2010 and then joined Division of Optics, National Institute of Metrology. Since 2014, he has been a research associate at the National Institute of Metrology. His specialization includes high speed optical communication, fiber Bragg grating, and laser detection.
Jin Wang received her master’s degree in biomedical engineering in 2007 and then joined the School of Physics, Nankai University, China. She received her PhD in optics from Nankai University, China, in 2013. Her research interests include optical clearing, refractive index measurement of biotissue, and optical coherence tomography.
Ningning Huang received her bachelor’s degree from the School of Physics and Astronomy, Yunnan University, in 2017. Currently, she is studying for her master’s degree in the School of Physics at Nankai University. Her research interests include optical coherence tomography imaging.
Ruiming Cui received her bachelor’s degree from the School of Physics, Qufu Normal University, in 2018. Currently, she is studying her master’s degree in the School of Physics at Nankai University. Her research interests are DNA computing and microfluidics.
Qiannan Zhang received her bachelor’s degree from the School of Physics, Zhoukou Normal University, in 2018. Currently, she is studying for a master’s degree in the School of Physics at Nankai University. Her research interests include superresolution imaging.
Jianchun Mei completed his master’s degree in the School of Physics from Nankai University, China, in 2010. The same year, he became an engineer and started to work in the Advanced Technology Institute, Nankai University. He is mainly engaged in the research of photoelectric detection and optical instrument design.
Wenyuan Zhou received his master’s degree and doctoral degree in 1996 and 2002, respectively. From 2003 to 2012, he worked as an associate professor at Nankai University. Since 2012, he has been a professor of optics at Nankai University. His main research interests are high sensitive photon detection, photon imaging technology, and application of biological sensors.
Chunping Zhang has been a professor of physics at Nankai University since 1995. His main research interests are optical properties and applications of photochromic materials and biomedical photonics.
Qing Ye received his PhD in optics from Nankai University, China, in 2008, and then joined the School of Physics, Nankai University. Since 2010, he has been an associate professor of optics at Nankai University. His specialization includes optical coherence tomography, optical clearing, and optical properties measurement of biotissue.
Jianguo Tian received his PhD from Nankai University in 1991 and then started to teach in the same university as an assistant professor. In 1995, he became a professor. Since 2001, he has become a specially appointed professor at Nankai University. He is mainly engaged in condensed matter physics and photonics, involving optical nonlinear mechanism and application of photoelectric material properties.
Disclosure
The authors have no relevant financial interests in this article and no potential conflicts of interests to disclose.
References
- 1.Li H., Xie S., “Measurement method of the refractive index of biotissue by total internal reflection,” Appl. Opt. 35(10), 1793–1795 (1996). 10.1364/AO.35.001793 [DOI] [PubMed] [Google Scholar]
- 2.Tuchin V. V., Tissue Optics: Light Scattering Methods and Instruments for Medical Diagnosis, Vol. 13, SPIE Press, Bellingham, Washington: (2007). [Google Scholar]
- 3.Tuchin V. V., et al. , “Light propagation in tissues with controlled optical properties,” J. Biomed. Opt. 2(4), 401–417 (1997). 10.1117/12.281502 [DOI] [PubMed] [Google Scholar]
- 4.Cheng S., et al. , “Measurement of the refractive index of biotissue at four laser wavelengths,” Proc. SPIE 4916, 172 (2002). 10.1117/12.482969 [DOI] [Google Scholar]
- 5.Lai J., et al. , “Experimental measurement of the refractive index of biological tissues by total internal reflection,” Appl. Opt. 44(10), 1845–1849 (2005). 10.1364/AO.44.001845 [DOI] [PubMed] [Google Scholar]
- 6.Lai J., et al. , “Complex refractive index measurement of biological tissues by attenuated total reflection ellipsometry,” Appl. Opt. 49(16), 3235–3238 (2010). 10.1364/AO.49.003235 [DOI] [PubMed] [Google Scholar]
- 7.Jin Y. L., et al. , “Refractive index measurement for biomaterial samples by total internal reflection,” Phys. Med. Biol. 51(20), N371 (2006). 10.1088/0031-9155/51/20/N02 [DOI] [PubMed] [Google Scholar]
- 8.Rylander C. G., et al. , “Dehydration mechanism of optical clearing in tissue,” J. Biomed. Opt. 11(4), 041117 (2006). 10.1117/1.2343208 [DOI] [PubMed] [Google Scholar]
- 9.Brunsting A., Mullaney P. F., “Differential light scattering from spherical mammalian cells,” Biophys. J. 14(6), 439–453 (1974). 10.1016/S0006-3495(74)85925-4 [DOI] [PMC free article] [PubMed] [Google Scholar]
- 10.Zhang C., et al. , “Determination of the refractive index of a bacteriorhodopsin film,” Opt. Lett. 19(18), 1409–1411 (1994). 10.1364/OL.19.001409 [DOI] [PubMed] [Google Scholar]
- 11.Adkins J. N., et al. , “Toward a human blood serum proteome analysis by multidimensional separation coupled with mass spectrometry,” Mol. Cell. Proteomics 1(12), 947–955 (2002). 10.1074/mcp.M200066-MCP200 [DOI] [PubMed] [Google Scholar]
- 12.Li H., Lin L., Xie S., “Refractive index of human whole blood with different types in the visible and near-infrared ranges,” Proc. SPIE 3914, 517–522 (2000). 10.1117/12.388073 [DOI] [Google Scholar]
- 13.Mazarevica G., Freivalds T, Jurka A., “Properties of erythrocyte light refraction in diabetic patients,” J. Biomed. Opt. 7(2), 244–247 (2002). 10.1117/1.1463043 [DOI] [PubMed] [Google Scholar]
- 14.Maksimov G. V., et al. , “Role of viscosity and permeability of the erythrocyte plasma membrane in changes in oxygen-binding properties of hemoglobin during diabetes mellitus,” Bull. Exp. Biol. Med. 140(5), 510–513 (2005). 10.1007/s10517-006-0010-x [DOI] [PubMed] [Google Scholar]
- 15.Park Y. K., et al. , “Refractive index maps and membrane dynamics of human red blood cells parasitized by Plasmodium falciparum,” Proc. Natl. Acad. Sci. U. S. A. 105(37), 13730–13735 (2008). 10.1073/pnas.0806100105 [DOI] [PMC free article] [PubMed] [Google Scholar]
- 16.Liu P. Y., et al. , “Cell refractive index for cell biology and disease diagnosis: past, present and future,” Lab Chip 16(4), 634–644 (2016). 10.1039/C5LC01445J [DOI] [PubMed] [Google Scholar]
- 17.Meinke M. C., et al. , “Optical properties of platelets and blood plasma and their influence on the optical behavior of whole blood in the visible to near infrared wavelength range,” J. Biomed. Opt. 12(1), 014024 (2007). 10.1117/1.2435177 [DOI] [PubMed] [Google Scholar]
- 18.Jacques S. L., “Optical properties of biological tissues: a review,” Phys. Med. Biol. 58(11), R37 (2013). 10.1088/0031-9155/58/11/R37 [DOI] [PubMed] [Google Scholar]
- 19.Ghosh N., et al. , “Simultaneous determination of size and refractive index of red blood cells by light scattering measurements,” Appl. Phys. Lett. 88(8), 084101 (2006). 10.1063/1.2176854 [DOI] [Google Scholar]
- 20.Friebel M., Meinke M. C., “Determination of the complex refractive index of highly concentrated hemoglobin solutions using transmittance and reflectance measurements,” J. Biomed. Opt. 10(6), 064019 (2005). 10.1117/1.2138027 [DOI] [PubMed] [Google Scholar]
- 21.Deng Z., et al. , “Continuous refractive index dispersion measurement based on derivative total reflection method,” Rev. Sci. Instrum. 86(4), 043101 (2015). 10.1063/1.4916256 [DOI] [PubMed] [Google Scholar]
- 22.Daimon M., Masumura A., “Measurement of the refractive index of distilled water from the near-infrared region to the ultraviolet region,” Appl. Opt. 46(18), 3811–3820 (2007). 10.1364/AO.46.003811 [DOI] [PubMed] [Google Scholar]
- 23.Ding H., et al. , “Refractive indices of human skin tissues at eight wavelengths and estimated dispersion relations between 300 and 1600 nm,” Phys. Med. Biol. 51(6), 1479–1489 (2006). 10.1088/0031-9155/51/6/008 [DOI] [PubMed] [Google Scholar]
- 24.Lazareva E. N., Tuchin V. V., “Blood refractive index modelling in the visible and near infrared spectral regions,” J. Biomed. Photonics Eng. 4(1), 10503 (2018). 10.18287/JBPE18.04.010503 [DOI] [Google Scholar]
- 25.Sardar D. K., Levy L. B., “Optical properties of whole blood,” Lasers Med. Sci. 13(2), 106–111 (1998). 10.1007/s101030050062 [DOI] [Google Scholar]
- 26.Bolin F. P., et al. , “Refractive index of some mammalian tissues using a fiber optic cladding method,” Appl. Opt. 28(12), 2297–2303 (1989). 10.1364/AO.28.002297 [DOI] [PubMed] [Google Scholar]
- 27.Zhernovaya O., et al. , “The refractive index of human hemoglobin in the visible range,” Phys. Med. Biol. 56(13), 4013–4021 (2011). 10.1088/0031-9155/56/13/017 [DOI] [PubMed] [Google Scholar]
- 28.Wang J., et al. , “Measurement of the refractive index of hemoglobin solutions for a continuous spectral region,” Biomed. Opt. Exp. 6(7), 2536–2541 (2015). 10.1364/BOE.6.002536 [DOI] [PMC free article] [PubMed] [Google Scholar]


