 Camphor induces oxidative stress-mediated apoptotic cell death.
Abstract
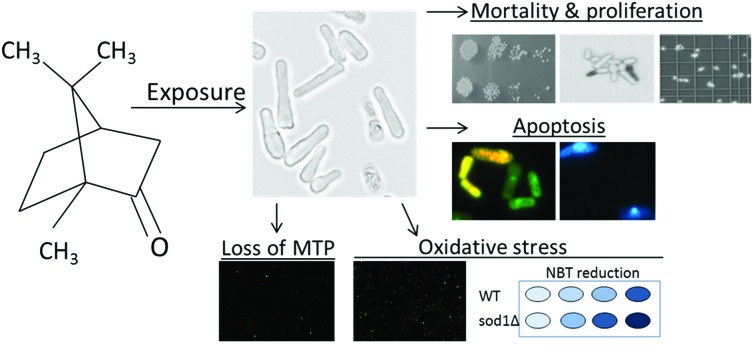
Camphor is one of the monoterpenes widely used in cosmetics, pharmaceutics and the food industry. In this study, we aimed to assess the oxidative, cytotoxic and apoptotic effects of camphor on the fission yeast (Schizosaccharomyces pombe), which is a promising unicellular model organism in mechanistic toxicology and cell biology. Since Sod1 is the main radical scavenger in the cell, we used sod1 mutants to understand whether camphor-induced ROS accumulation caused higher cytotoxicity and apoptosis. Camphor exposure (0–2000 mg L–1) caused significant cytotoxicity in yeast, particularly in sod1Δ cells. DCFDA (2,7-dichlorodihydrofluorescein diacetate) fluorescence and NBT (p-nitro-blue tetrazolium chloride) reduction increased (at least 2.5–3-fold in sod1Δ cells) in correlation with camphor concentrations (800–1200 mg L–1), showing higher ROS levels and oxidative stress. Moreover, cells, stained with acridine orange/ethidium bromide, showed an apoptotic morphology with nuclear fragmentation and condensation. DAPI (4′,6-diamidino-2-phenylindole) staining was used to validate the apoptotic nuclear morphology. Dramatically increased mitochondrial impairment, which was higher in sod1Δ cells than in wild type cells, was shown by rhodamine 123 staining. In conclusion, camphor-induced excessive ROS production, which could not be prevented significantly in sod1 mutants, caused a dramatic increase in mortality rates due to intrinsic apoptosis revealed by mitochondrial impairment and apoptotic nuclear morphology. The potential effects of camphor on apoptotic cell death and the underlying mechanisms were clarified in the unicellular eukaryotic model, S. pombe.
1. Introduction
Terpenic essential oils having defensive roles against pathogens and parasites1 are among the most known natural products,2 which are extracted from the resin ducts and glands of aromatic plants, such as Pinaceae. The anti-inflammatory, bactericidal and bacteriostatic effects of monoterpenes, sesquiterpenes, terpenoids and phenolic acids were reported previously.3–5 Camphor (1,7,7-trimethylbicyclo[2.2.1]heptan-2-one), which is a white colored powder and used in odorants, pharmaceuticals and flavorings,6 is one of the bicyclic monoterpenes7 and widely found in the wood of camphor trees (Cinnamomum camphora) and aromatic plants.8
Although camphor is not recognized as a potentially fatal toxic compound in general,9 researchers have identified its neurotoxic effects following ingestion, inhalation and dermal exposure.10 50 μg ml–1 and higher camphor concentrations were reported to induce oxidative stress and an altered mitochondrial membrane potential in rat thymocytes.11 In addition, camphor increased the activities of cytochrome P450, cytochrome b5, aryl hydrocarbon hydroxylase and glutathione S-transferase in female Swiss albino mice when treated daily by the oral route at the 300 mg kg–1 body weight dose level.12 Besides, inhibition of cell proliferation and viability in the human colon cancer cell line HCT-116 was reported when camphor was combined with lynalyl acetate and terpineol; however, the inhibitory effect was also reported in mutant HCT-116 (p53–/–) cells indicating that cells also undergo apoptosis via a caspase-independent pathway, particularly the intrinsic apoptotic pathway.13 On the other hand, camphor was shown to induce proliferative and anti-senescence activities through the PI3K/AKT and ERK signaling pathways in a dose-dependent manner in human dermal fibroblast cells.14 Given the significance of camphor in the future of the medical and pharmaceutical industries, possible metabolic, anti-aging, cytotoxic, inhibitory and cancer fighting activities together with the underlying mechanisms are under debate and should be unraveled. Research on camphor toxicity mainly focused on laboratory experiments with cell lines,13,15 rodents,11,16,17 and pests.18 However, the undefined mechanisms of camphor toxicity in model fungi are currently limited.
In molecular cell biology, biochemistry and toxicology studies, the fission yeast (Schizosaccharomyces pombe) constitutes a valuable model organism19–21 with its characteristics including cell cycle control,21,22 easily manipulated small genome,23 mitochondrial biogenesis analogous to mammals,24,25 and also conserved programmed cell death (PCD) subroutines.26 Moreover, a high proliferation rate of yeast cells resembles the Warburg effect (the reprogramming of energy metabolism) in cancer cells27 and presents a valuable possibility in cancer research.28–30 Therefore, potential drug candidates for cancer can be evaluated using the cell biology of yeast, and the underlying mechanisms for cytotoxic, genotoxic and apoptotic effects are to be deciphered.31–34
In this study, a unicellular eukaryotic model, S. pombe, was used to investigate the potential cytotoxic effects of camphor and the underlying mechanisms. Cell viability, proliferation and apoptotic cell death were assessed. In addition, oxidative stress, mitochondrial impairment, and DNA damage as accountable molecular mechanisms were evaluated. To show the effect of oxidative stress on cytotoxicity, we used sod1 (S. pombe superoxide dismutase1)-deficient cells in which Sod1 is the main ROS (reactive oxygen species) scavenger and the most abundant antioxidant enzyme in the cell. We hypothesized that excessive ROS production could cause mitochondrial disruption following oxidative DNA damage and activate intrinsic cell death signaling and apoptosis.35,36 The data contribute to understanding the potential cytotoxicity of camphor and support possible future studies in molecular medicine.
2. Materials and methods
2.1. Reagents
Methylene blue was from Merck (Istanbul, Turkey). Components of culture media were from BD Difco (Fisher Scientific, Turkey). Glucose was from Emboy (Istanbul, Turkey). Camphor (product number: 148075-100G) (1,7,7-trimethylbicyclo[2.2.1]heptan-2-one), arsenic(iii) oxide, acridine orange, ethidium bromide, DCFDA (2,7-dichlorodihydrofluorescein diacetate), rhodamine 123, NBT (p-nitro-blue tetrazolium chloride) and DAPI (4′,6-diamidino-2-phenylindole) were purchased from Sigma (Istanbul, Turkey).
2.2. Yeast strain, media and growth conditions
S. pombe wild type strain ED666 (h–ade6-M210/ura4-D18 leu1-32) and ED666 with sod1Δ::KanR (sod1 defective: sod1 was replaced by kanamycin resistance gene) were kind gifts from B. Palabiyik (Istanbul University). Yeast was grown in a standard YEL medium (1% yeast extract, 2% glucose) on a rotary shaker at 150 rpm at 30 °C in all of the experiments. 1 × 10⁶ cells per ml cultures from overnight incubation (14 h) were used for experiments.
2.3. Camphor exposure and cytotoxicity
Yeast cells from the overnight culture (OD600 ≈ 1) in YEL media were counted under an optical microscope (Carl-Zeiss, Axio Observer 3) and dispensed into conical flasks at a final concentration of 1 × 10⁶ cells per ml. Camphor stock solution was prepared at 100 g L–1 concentration in ethanol. Cells were exposed to a solvent control (%0.05 ethanol) and a graded concentration of camphor (0–2000 mg L–1 in ethanol) for 24 h. Arsenic(iii) oxide was used as the positive control for testing apoptosis.37 The evaluation of relative cell proliferation was made using a hemocytometer. Cells were suspended in PBS and a sample (100 μl) of the cell suspension was stained with 100 μl methylene blue (0.1 mg ml–1 in 2% sodium citrate buffer) for mortality evaluation. Mortality was examined under a microscope for at least 200 cells in each of the five independent biological replicates (n = 5). Dead cells were blue, and viable cells were colorless. Mortality rate was calculated as the ratio of stained cells to total cells. A spot assay was performed as described previously38 to evaluate the cytotoxicity of camphor. YEA media were prepared with gradually increasing concentrations of camphor. Serial 5-fold dilutions of logarithmic yeast cells were spotted on agar plates with 3 technical replicas and incubated at 30 °C for 3 days.
2.4. Acridine orange/ethidium bromide (AO/EB) and DAPI staining
Acridine orange/ethidium bromide dual staining was carried out to detect apoptosis. AO/EB dual staining assay was performed as previously described.39,40 Briefly, the cells were mixed with 5 μl of acridine orange/ethidium bromide solution (60 μg ml–1 of AO: 100 μg ml–1 of EB, dissolved in PBS). After incubation, the cells were washed with PBS and examined under a fluorescence microscope (Carl-Zeiss, Axio Observer 3) using 40× objectives at λex = 500 nm and λem = 530 nm for acridine orange, and λex = 510 nm and λem = 595 nm for ethidium bromide. The cell nucleus was also stained with 1 μg ml–1 DAPI (4′,6-diamidino-2-phenylindole). The staining assay was performed as previously described.41 The cells were examined under a fluorescence microscope (Carl-Zeiss, Axio Observer 3) using 63× objectives at λex = 358 nm and λem = 461 nm.
2.5. ROS detection by DCFDA (2,7-dichlorodihydrofluorescein diacetate) staining and NBT (p-nitro-blue tetrazolium chloride) assay
Intracellular ROS analysis was performed as described previously.42 Briefly, cells were incubated with 10 μM DCFDA in culture media before harvesting at 30 °C. The cells were washed in ice-cold PBS and examined under a fluorescence microscope (Carl-Zeiss, Axio Observer 3) using 10× objectives at λex = 495 nm and λem = 529 nm. Intensity analysis was made using Carl-Zeiss Zen 2.3 Blue Edition and the intensity was calculated as a percentage of control. NBT assay was performed as previously described.43 Cells were incubated with 0.1% NBT for 1 h at 1 × 10⁶ cells per ml concentration. The supernatants were removed and the cells were fixed using absolute methanol and washed twice with methanol. The final dry pellet was solubilized in 2 M KOH and DMSO, and was read at 620 nm in a microplate spectrophotometer (Thermo Scientific, Multiskan GO).
2.6. Detection of MTP (mitochondrial transmembrane potential) by rhodamine 123 assay
Mitochondria were stained with rhodamine 123, which is taken up by mitochondria depending on the mitochondrial membrane potential, as indicated previously.44 Cells were suspended in a final concentration of 50 mM sodium citrate (pH 5.0), 2% glucose and 25 μM rhodamine 123, and incubated for 15 min at room temperature. The cells were visualized by fluorescence microscopy (Carl-Zeiss, Axio Observer 3) using 10× objectives at λex = 505 nm and λem = 534 nm. Intensity analysis was made using Carl-Zeiss Zen 2.3 Blue Edition and the intensity was calculated as a percentage of control.
2.7. Statistical analysis
The data were expressed as mean ± standard error of the mean (SEM). The IC50 and LC50 values were calculated by the Probit method. Differences between the groups were analyzed by one-way ANOVA with Tukey's multiple comparison tests using GraphPad Prism (California, USA).
3. Results and discussion
3.1. Camphor showed high cytotoxicity in sod1-deficient cells
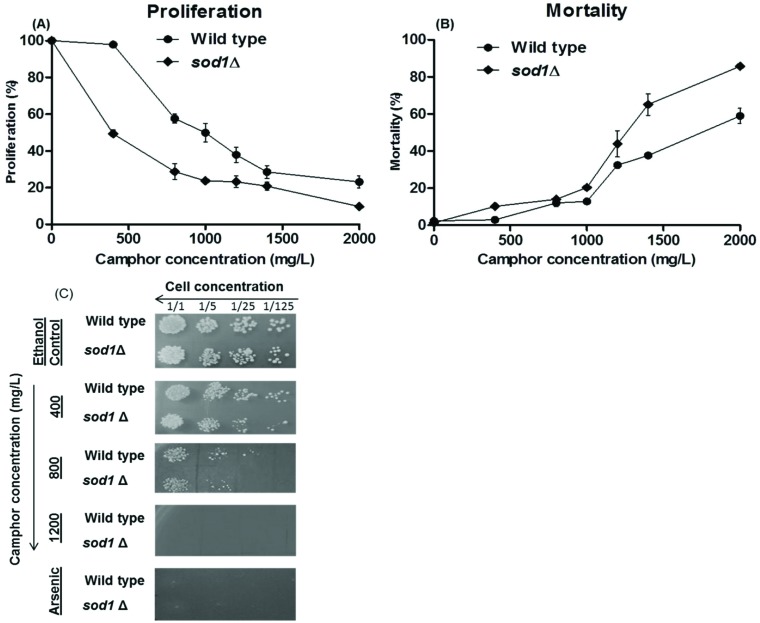
Growth inhibition of wild type cells significantly increased (p < 0.01) after exposure to camphor between 800 and 2000 mg L–1 (Fig. 1A and B). On the other hand, growth inhibition of sod1-deficient cells increased dramatically after camphor exposure even at 400 mg L–1. The IC50 values were (inhibition concentration 50%) 789 mg L–1 and 356 mg L–1 in wild type cells and in sod1Δ cells, respectively. Besides, cell survival notably decreased (p < 0.01) gradually after exposure to camphor at 800–2000 mg L–1 in wild type cells, while cell survival began to decrease dramatically in sod1Δ cells at 400 mg L–1. LC50 values (lethal concentration 50%) were 1182 mg L–1 and 898 mg L–1 in wild type cells and in sod1Δ cells, respectively. To visualize growth inhibition and mortality and to validate the results, a spot assay was performed with 5-fold serial dilutions of yeast cells. The spots (Fig. 1C) showed a significant loss of viability in wild type cells. However, the decrease in viability was more pronounced in sod1Δ cells. Similar to mortality and proliferation assays, the spot assay demonstrated that camphor induced cell death at all concentrations even at lower doses (400 mg L–1) in sod1Δ cells. Although human exposure studies cannot be directly compared with microorganism toxicity studies, the Committee on Drugs (1994) declared that a 20 ml volume of a product containing 1 g camphor is a potentially lethal dose for children,45 which equals 50 g L–1 that is obviously more concentrated than that used in our study (0–2000 mg L–1). In addition, a review on pediatric toxicity declared that ingestion of 750–1000 mg of camphor was associated with seizure and death.46 In contrast, Itani et al. (2008) reported that camphor, at 152 mg L–1 concentration, induced cell death and inhibited cell growth in the human colon cancer cell line HCT-116.13 The outer protein layer of the yeast cell wall limits permeability,47 which may explain the difference in cell growth and mortality rates between the yeast and mammalian cell line. On the other hand, camphor is known as a membrane permeable lipophilic compound,48 as well as other monoterpenes.49
Fig. 1. Cell proliferation and viability of wild type and sod1 mutant cells after exposure to 0–2000 mg L–1 camphor solutions for 24 h. Cell proliferation (A) and mortality (B) of wild type and sod1Δ cells were assessed using a hemocytometer and the methylene blue assay in comparison to ethanol (solvent) control (0 mg L–1 refers to solvent control). Solvent control includes 0.05% ethanol. Values are presented as mean ± SEM. Calculations were made from at least five independent biological replica (n = 5). Cell viability was also assessed by spot assay (C). Serial 5-fold dilutions of yeast cells were spotted on YEA plates including gradually increasing concentrations of camphor (0–1200 mg ml–1) and 3 mM arsenic(iii).
A comparative study on the anti-fungal potential of monoterpenes reported that camphor was found to be more effective in comparison to camphene, carvone, myrcene and geraniol.50 A strong growth inhibition following the inhibition of esterases and oxidases and a change in the fatty acid composition of the cell membrane followed by an altered membrane permeability were proposed to explain the anti-fungal action of monoterpenes.48,49 In addition, lipid peroxidation, elevated ROS levels and oxidative damage were reported after camphor exposure in rat thymocytes,11 in contrast to its potential antioxidant activity in mice.12 Excessive ROS production and oxidative DNA damage followed by mitochondrial disruption are well-known intrinsic cell death signals.35,36 In the present study, the higher camphor sensitivity of sod1Δ mutants could be related to camphor-induced oxidative stress (see section 3.3). Since sod1-deficiency reduces the scavenging ability, vulnerability to oxidative damage can be increased and caused higher cytotoxicity than that of wild type cells.
3.2. Cell death is substantially dependent on apoptosis
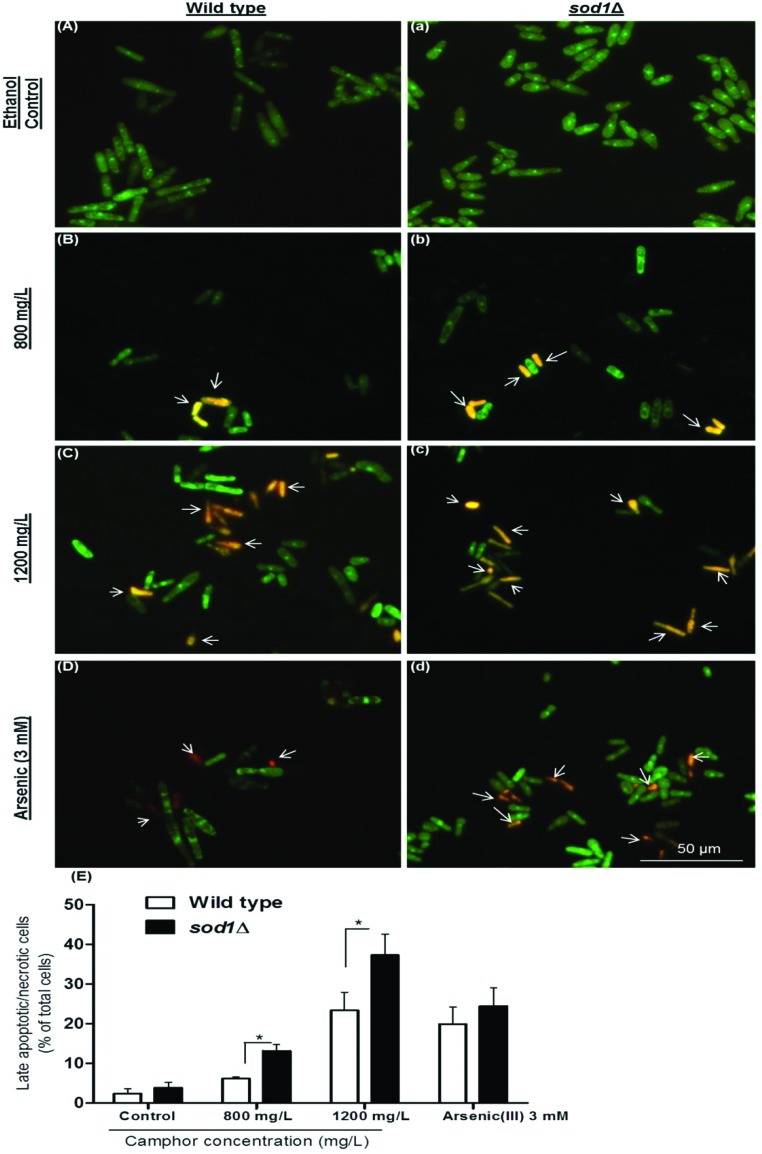
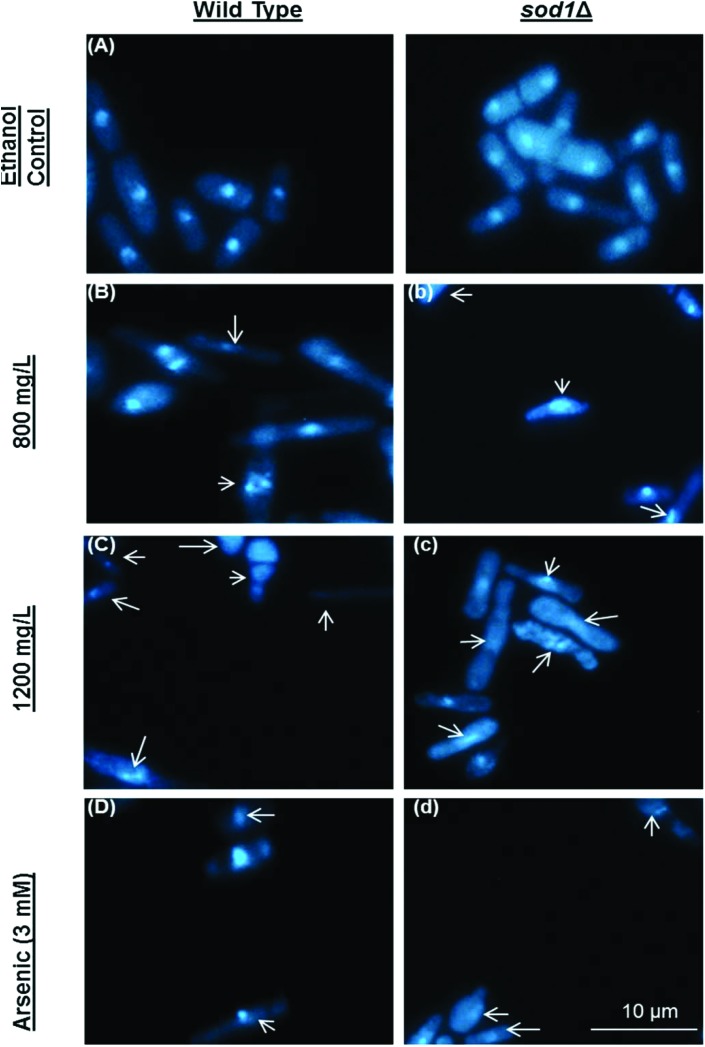
Late apoptotic and/or necrotic cells were observed with acridine orange-ethidium bromide (AO-EB) dual staining (Fig. 2). In this assay, acridine orange permeates both dead and live cell membranes and stains every cell nucleus, while ethidium bromide permeates only dead cells via pores opened in the cell membrane and stains DNA. Apoptotic cells were stained bright green and orange-bright red due to the nuclear conformation and cell-membrane status. While the fragmented orange-bright red chromatin indicates apoptotic cells, the regular green nucleus indicates live cells. The cells were exposed to camphor at IC50 (800 mg L–1) and LC50 (1200 mg L–1) doses for 24 h. Apoptotic cells were indicated by arrows in Fig. 2 (Fig. 2, B and b: 800 mg L–1; C and c: 1200 mg L–1 camphor and D and d: 3 mM arsenic trioxide). As shown in Fig. 2E, percentages of the late apoptotic/necrotic cells and viable cells were significantly different in the experimental groups (800–1200 mg L–1) compared with the control groups (p < 0.01). All tested concentrations of camphor induced apoptosis (see Fig. 2E). When sod1Δ cells were exposed to camphor, apoptosis was markedly increased (37.33%) in comparison to wild type cells (25.38%), particularly at 1200 mg L–1 camphor concentration. The percentage of apoptotic cells (25.38% and 37.33%) was close to mortality rates (32.46% and 43.89%) at 1200 mg L–1 camphor concentration. At 800 mg L–1, apoptotic cell death and mortality rates were very similar (13.18% and 14.01%) in sod1Δ cells. To confirm apoptosis, the cells were fixed with 3.7% formaldehyde and stained with DAPI. Nuclear fragmentation and chromatin condensation, as typical markers of apoptosis, were observed at 800 mg L–1 and 1200 mg L–1 camphor concentrations as shown in Fig. 3. Camphor- and arsenic-treated (apoptosis control) cell nuclei were seen condensed, dot- and crescent-shaped, which are known as apoptotic markers,51,52 while control cell nuclei were seen intact. Similarly, other monoterpenes induced apoptosis along with cell cycle arrest in HL-60 (human promyelocytic leukemia cell line), HSC (hematopoietic stem cell) and HCT-116 (human colorectal carcinoma cell line) human cancer cell lines.53,54 In addition, similar to acridine orange-ethidium bromide staining, DAPI staining showed a higher frequency of apoptotic cell nuclei in sod1Δ cells in comparison to wild type cells.
Fig. 2. Apoptosis of S. pombe cells was evaluated using acridine orange-ethidium bromide dual staining. Viable and late apoptotic/necrotic cells were visualized using a fluorescence microscope after exposure to 0 (A and a), 800 (B and b), and 1200 (C and c) mg L–1 camphor and 3 mM arsenic(iii) (D and d) solutions. Arsenic(iii) was used as the positive control. Percentages (E) of late apoptotic/necrotic wild type and sod1Δ cells after exposure to 0–1200 mg L–1 camphor and 3 mM arsenic solutions are shown in the corresponding graphics. Values are presented as mean ± SEM. At least 200 cells were counted in each biological replica (n = 3). Arrows: Late apoptotic/necrotic cells.
Fig. 3. Nuclear morphology was evaluated using 4,6-diamidino-2-phenylindole (DAPI) staining. DAPI staining was performed after exposure to 0 (A and a), 800 (B and b), and 1200 (C and c) mg L–1 camphor and 3 mM arsenic(iii) (D and d) solutions. Arsenic(iii) was used as the positive control. Arrows: Degraded and fragmented DNA or anucleated cells. Images were obtained using a fluorescence microscope from at least three independent biological replica (n = 3).
3.3. Mortality rates are potentially related to camphor-induced ROS production
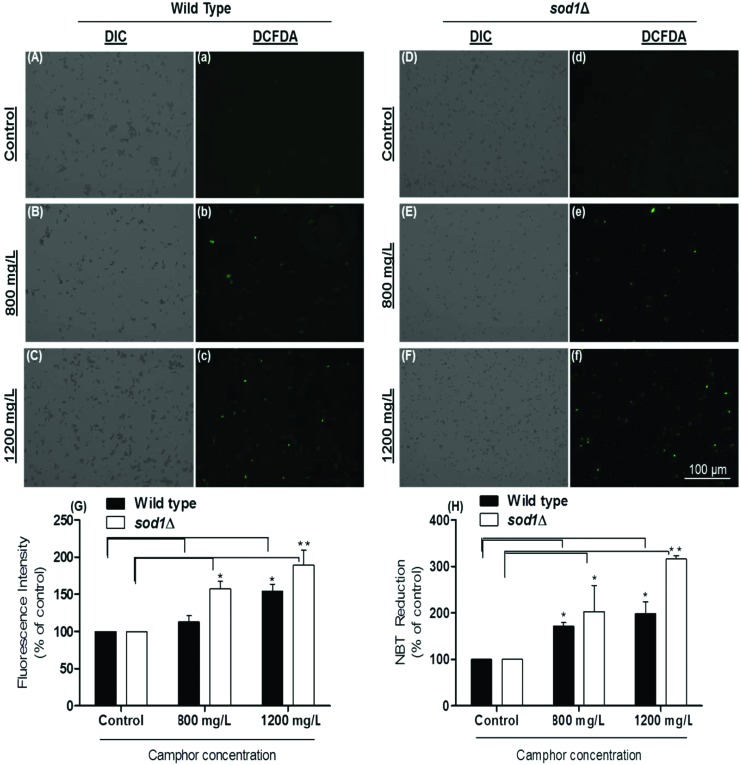
DCFDA, as a membrane permeable dye, reacts with reactive oxygen species accumulating in the cytoplasm, and transforms into DCF (oxidized fluorescent form). We determined intracellular ROS levels using the DCFDA fluorescence assay. As shown in Fig. 4, ROS levels dramatically increased in response to camphor exposure at all concentrations (p < 0.05), particularly 2-fold (p < 0.01) in sod1Δ cells at 1200 mg L–1 (see Fig. 4f and G), as demonstrated by increasing green fluorescence (Fig. 4A and a: wild type control; Fig. 4B and b: wild type 800 mg L–1; Fig. 4C and c: wild type 1200 mg L–1; Fig. 4D and d: sod1Δ control; Fig. 4E and e: sod1Δ 800 mg L–1; Fig. 4F and f: sod1Δ 1200 mg L–1 and Fig. 4G: fluorescence intensity). However, increasing green fluorescence intensities in sod1Δ cells were not comparable to those in wild type cells in experimental groups, probably due to the lack of ROS scavenging activity of superoxide dismutase in mutant strains when ROS production was stimulated by camphor exposure. To confirm the results, ROS levels were calculated using NBT reduction to insoluble blue formazan indicating superoxide generation.43 As shown in Fig. 4H, a dramatic increase in NBT reduction was calculated in the experimental groups, particularly more than two-fold in sod1Δ cells. NBT reduction markedly increased 1.5–2-fold in wild type cells (p < 0.05) at 800–1200 mg L–1 camphor concentrations similar to an increase in mortality rates (12.02% and 32.46%) and apoptotic cell death (8.19% and 25.38%), while significant increases were 2–3-fold in sod1Δ cells consistent with the increase in mortality rates (14.01% and 43.89%) and apoptotic cell death (13.18% and 37.33%) at 800 mg L–1 (p < 0.05) and 1200 mg L–1 (p < 0.01) camphor concentrations (see Fig. 1 and 3).
Fig. 4. Measurement of ROS levels using DCFDA (2′,7′-dichlorofluorescin diacetate) staining. ROS generation in wild type cells exposed to 0 (A and a), 800 (B and b) and 1200 (C and c) mg L–1 camphor and in sod1Δ cells exposed to 0 (D and d), 800 (E and e) and 1200 (F and f) mg L–1 camphor was visualized and measured using a fluorescence microscope. (G) ROS generation of cells exposed to 0–1200 mg L–1 camphor was calculated as a percentage of control fluorescence intensity. (H) ROS levels in cells exposed to 0–1200 mg L–1 camphor were also measured by NBT (3,3′-(3,3′-dimethoxy-4,4′-biphenylene)bis [2-(4-nitrophenyl)-5-phe nyl-2H-tetrazolium chloride) assay. ROS generation of cells was determined as the absorbance of reduced NBT at 620 nm in a microplate reader and expressed as a percentage of the control group NBT reduction. Values are presented as mean ± SEM. Statistical analysis was performed between the dose groups and their control groups for each of the wild type and sod1Δ cells. Significantly different values are indicated by asterisks (one-way ANOVA, *p < 0.05, **p < 0.01). Images were obtained from at least three independent biological replica (n = 3).
DCFDA and NBT assays are known to have a detection capability for a wide range of intracellular reactive oxygen species, including hydroxyl radicals, superoxide anions and hydrogen peroxide,55 which are well-known free radicals.56 The chemical imbalance between ROS levels and the antioxidant molecules in favor of ROS levels can be deleterious and can lead to oxidative stress followed by oxidative DNA damage, mitochondrial disruption, intrinsic apoptosis, necroptosis and other cell death signaling.35,57,58 Camphor was shown to induce lipid peroxidation and excessive ROS production in rat thymocytes11 and in Japanese quail testis tissue59 in contrast to other monoterpenes α-pinene, cineol and myrtenol.60,61 A gradual increase in mortality rates, particularly in sod1Δ cells, was potentially related to camphor-induced ROS accumulation and the following cell death routine. We showed that elevated ROS levels, in response to camphor, have the potential to disrupt cellular balance and metabolism followed by cell death, particularly in cells without scavenging activity (sod1Δ), which normally removes radicals.
3.4. Camphor-induced loss of MTP showed the role of mitochondrial impairment in apoptosis
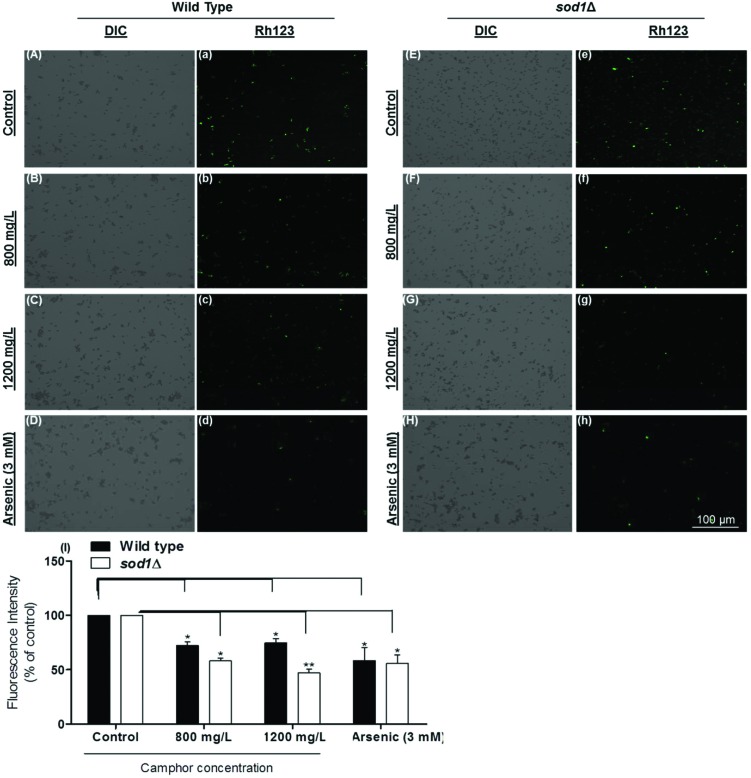
The loss of mitochondrial transmembrane potential, which is an early indicator of apoptosis, is measured (ΔΨm) to understand mitochondrial disruption.62 In this study, we monitored the loss of MTP using rhodamine 123 fluorescence stain, which is sequestered by active mitochondria.63 When an intact mitochondrion is stained, the dye emits green fluorescence. In contrast, since the mitochondrion of an early apoptotic or dead cell cannot pump the dye to the matrix, the dye cannot fluoresce indicating mitochondrial disruption. The difference in the fluorescence intensity of the control and dose groups was calculated using histograms drawn by the software (Carl-Zeiss Zen 2.3 Blue Edition). Fig. 5 demonstrates a dramatic decrease of fluorescence intensity in a dose-dependent manner (800–1200 mg L–1) (Fig. 5A and a: wild type control; Fig. 5B and b: wild type 800 mg L–1; Fig. 5C and c: wild type 1200 mg L–1; Fig. 5D and d: wild type arsenic control; Fig. 5E and e: sod1Δ control; Fig. 5F and f: sod1Δ 800 mg L–1; Fig. 5G and g: sod1Δ 1200 mg L–1; Fig. 5H and h: sod1Δ arsenic control and Fig. 5I: fluorescence intensity). The calculated fluorescence intensity decreased 1.4-fold in wild type cells at 800–1200 mg L–1 camphor concentrations (p < 0.05), while the intensity markedly decreased 2.2-fold in sod1Δ cells at all concentrations as well as in the sod1Δ arsenic control (see Fig. 5I). The dramatic MTP decrease in sod1 lacking cells, in comparison to wild type cells, strongly and negatively correlates with ROS levels (see Fig. 4G and H). There is evidence showing that oxidative stress can cause alteration in the mitochondrial membrane permeability, loss of MTP and mitochondrial DNA damage, and vice versa.64–66 Therefore, our results indicate that apoptotic signaling followed by cell death was potentially due to the camphor-induced excessive ROS production and mitochondrial impairment. Cherneva et al. (2012) reported similar results in rat thymocytes after cultivation with camphor and borneol.11 Similarly, essential oils including cineol, terpinenol and terpinolene, some of the most known monoterpenes, were found to reduce membrane functionality and mitochondrial membrane potential as well as mitochondrial integrity in swine spermatozoa,67 and to reduce MTP followed by apoptosis in human lung cancer cells.68
Fig. 5. Mitochondrial transmembrane potential (MTP) of S. pombe cells was evaluated using rhodamine123. MTP of wild type cells exposed to 0 (A and a), 800 (B and b), and 1200 (C and c) mg L–1 camphor and 3 mM arsenic (D and d) and sod1Δ cells exposed to 0 (E and e), 800 (F and f), and 1200 (G and g) mg L–1 camphor and arsenic (H and h) was visualized and measured using a fluorescence microscope. Dose-dependent decline in the fluorescence intensity of wild type cells and sod1Δ cells (I) exposed to increasing concentrations of camphor (0–1200 mg L–1) was measured and expressed as a percentage of control fluorescence intensity. Values are presented as mean ± SEM. Statistical analysis was performed to compare the experimental groups and control group. Significantly different values are indicated by asterisks (one-way ANOVA, *p < 0.05, **p < 0.01). Images were obtained from at least three independent biological replica (n = 3).
4. Conclusion
In conclusion, cell viability and proliferation markedly decreased after camphor exposure. In addition, apoptotic cell death induced by camphor toxicity was shown to be mediated by the loss of mitochondrial transmembrane potential and oxidative stress. In this study, the potential toxic effects of camphor and the underlying mechanism were investigated in a unicellular eukaryotic model organism, S. pombe. This is the first complete mechanistic toxicology study with experimental data to shed light on camphor-induced apoptosis in S. pombe. However, this study warrants further study. The literature is still lacking experimental data on programmed cell death subroutines, autophagy and lipotoxicity.
Conflicts of interest
There are no conflicts of interest to declare.
Acknowledgments
This work was supported by the TUBITAK (The Scientific and Technological Research Council of Turkey) 2209-A Undergraduate Research Support Program [1919B011701974] and by the board of trustees of Istanbul Yeni Yuzyil University. We wish to thank Aysegul Topal-Sarikaya and Bedia Palabiyik for providing S. pombe cells, Emre Yoruk, Sinem Tunçer-Gurbanov and Gulsen Uz for consumables and chemicals, Cenk Kig for his advice and for sharing experiences.
References
- Farooq A., Choudhary M. I., Atta-ur-Rahman, Tahara S., Başer K. H. C., Demirci F. Z. Naturforsch. C. 2002;57:863–866. doi: 10.1515/znc-2002-9-1018. [DOI] [PubMed] [Google Scholar]
- Nikolić B., Mitić-Ćulafić D., Vuković-Gačić B., KneŽević-Vukčević J. Food Chem. Toxicol. 2011;49:2035–2045. doi: 10.1016/j.fct.2011.05.015. [DOI] [PubMed] [Google Scholar]
- Dawid-Pać R. Postep. Derm. Alergol. 2013;30:170–177. doi: 10.5114/pdia.2013.35620. [DOI] [PMC free article] [PubMed] [Google Scholar]
- Chueca B., Pagán R., García-Gonzalo D. Int. J. Food Microbiol. 2014;189:126–131. doi: 10.1016/j.ijfoodmicro.2014.08.008. [DOI] [PubMed] [Google Scholar]
- Nazzaro F., Fratianni F., De Martino L., Coppola R., De Feo V. Pharmaceuticals. 2013;6:1451–1474. doi: 10.3390/ph6121451. [DOI] [PMC free article] [PubMed] [Google Scholar]
- Chen W., Vermaak I., Viljoen A. Molecules. 2013;18:5434–5454. doi: 10.3390/molecules18055434. [DOI] [PMC free article] [PubMed] [Google Scholar]
- Ishmuratov G. Y., Vydrina V. A., Yakovleva M. P., Galkina Y. A., Lobko I. F., Muslukhov R. R., Vyrypaev E. M., Tolstikov A. G. Russ. J. Org. Chem. 2012;48:1210–1215. [Google Scholar]
- Frizzo C. D., Santos A. C., Paroul N., Serafini L. A., Dellacassa E., Lorenzo D., Moyna P. Braz. Arch. Biol. Technol. 2000;43:313–316. [Google Scholar]
- Narayan S., Singh N. Med. J. Armed Forces India. 2012;68:252–253. doi: 10.1016/j.mjafi.2011.11.008. [DOI] [PMC free article] [PubMed] [Google Scholar]
- Marwah P., Marwah A. Indian J. Pediatr. 2014;81:956–956. doi: 10.1007/s12098-013-1306-2. [DOI] [PubMed] [Google Scholar]
- Cherneva E., Pavlovic V., Smelcerovic A., Yancheva D. Molecules. 2012;17:10258–10266. doi: 10.3390/molecules170910258. [DOI] [PMC free article] [PubMed] [Google Scholar]
- Banerjee S., Welsch C. W., Rao A. R. Cancer Lett. 1995;88:163–169. doi: 10.1016/0304-3835(94)03633-t. [DOI] [PubMed] [Google Scholar]
- Itani W. S., El-Banna S. H., Hassan S. B., Larsson R. L., Bazarbachi A., Gali-Muhtasib H. U. Cancer Biol. Ther. 2008;7:1765–1773. doi: 10.4161/cbt.7.11.6740. [DOI] [PubMed] [Google Scholar]
- Tran T. A., Ho M. T., Song Y. W., Cho M., Cho S. K. Phyther. Res. 2015;29:1917–1925. doi: 10.1002/ptr.5484. [DOI] [PubMed] [Google Scholar]
- Sokolova A. S., Yarovaya O. I., Bormotov N. I., Shishkina L. N., Salakhutdinov N. F. Chem. Biodiversity. 2018;15:e1800153. doi: 10.1002/cbdv.201800153. [DOI] [PubMed] [Google Scholar]
- Leuschner J. Arzneimittelforschung. 1997;47:124–128. [Google Scholar]
- İnce B., Dadacı M., Kılınç İ., Oltulu P., Yarar S., Uyar M. Turk. J. Med. Sci. 2018;48:644–652. doi: 10.3906/sag-1704-166. [DOI] [PubMed] [Google Scholar]
- Jeon J.-H., Yang J.-Y., Lee H.-S. Pest Manage. Sci. 2014;70:1030–1032. doi: 10.1002/ps.3769. [DOI] [PubMed] [Google Scholar]
- Laliberté J., Whitson L. J., Beaudoin J., Holloway S. P., Hart P. J., Labbé S. J. Biol. Chem. 2004;279:28744–28755. doi: 10.1074/jbc.M403426200. [DOI] [PubMed] [Google Scholar]
- Liu M., Huang Y., Wen H., Qiu G. Huan jing ke xue = Huanjing kexue. 2015;36:3943–3951. [PubMed] [Google Scholar]
- Hagan I. M., Grallert A., Simanis V. Cold Spring Harb. Protoc. 2016;2016(9):735–746. doi: 10.1101/pdb.top082800. [DOI] [PubMed] [Google Scholar]
- Hartmuth S., Petersen J. J. Cell Sci. 2009;122:1737–1746. doi: 10.1242/jcs.049387. [DOI] [PubMed] [Google Scholar]
- Sajiki K., Hatanaka M., Nakamura T., Takeda K., Shimanuki M., Yoshida T., Hanyu Y., Hayashi T., Nakaseko Y., Yanagida M. J. Cell Sci. 2009;122:1418–1429. doi: 10.1242/jcs.046466. [DOI] [PubMed] [Google Scholar]
- Schafer B. Curr. Genet. 2003;43:311–326. doi: 10.1007/s00294-003-0404-5. [DOI] [PubMed] [Google Scholar]
- Koyama M., Nagakura W., Tanaka H., Kujirai T., Chikashige Y., Haraguchi T., Hiraoka Y., Kurumizaka H. Biochem. Biophys. Res. Commun. 2017;482:896–901. doi: 10.1016/j.bbrc.2016.11.130. [DOI] [PubMed] [Google Scholar]
- Lin S. J., Austriaco N. FEMS Yeast Res. 2014;14:119–135. doi: 10.1111/1567-1364.12113. [DOI] [PMC free article] [PubMed] [Google Scholar]
- Olayanju B., Hampsey J. J., Hampsey M. Adv. Biol. Regul. 2015;57:185–192. doi: 10.1016/j.jbior.2014.09.009. [DOI] [PMC free article] [PubMed] [Google Scholar]
- Carmona-Gutierrez D., Reisenbichler A., Heimbucher P., Bauer M. A., Braun R. J., Ruckenstuhl C., Büttner S., Eisenberg T., Rockenfeller P., Fröhlich K.-U., Kroemer G., Madeo F. Cell Cycle. 2011;10:3973–3978. doi: 10.4161/cc.10.22.18212. [DOI] [PubMed] [Google Scholar]
- Madeo F., Fröhlich E., Fröhlich K. U. J. Cell Biol. 1997;139:729–734. doi: 10.1083/jcb.139.3.729. [DOI] [PMC free article] [PubMed] [Google Scholar]
- Natter K., Kohlwein S. D. Biochim. Biophys. Acta. 2013;1831:314–326. doi: 10.1016/j.bbalip.2012.09.003. [DOI] [PMC free article] [PubMed] [Google Scholar]
- Takeda K., Mori A., Yanagida M. PLoS One. 2011;6:e22021. doi: 10.1371/journal.pone.0022021. [DOI] [PMC free article] [PubMed] [Google Scholar]
- Endres L., Dedon P. C., Begley T. J. RNA Biol. 2015;12:603–614. doi: 10.1080/15476286.2015.1031947. [DOI] [PMC free article] [PubMed] [Google Scholar]
- Villahermosa D., Knapp K., Fleck O. Curr. Genet. 2017;63:1081–1091. doi: 10.1007/s00294-017-0711-x. [DOI] [PMC free article] [PubMed] [Google Scholar]
- Yue Q., Zhou X., Leng Q., Zhang L., Cheng B., Zhang X. FEMS Yeast Res. 2013;13:796–803. doi: 10.1111/1567-1364.12089. [DOI] [PubMed] [Google Scholar]
- Zhang C., Lai S. H., Yang H. H., Xing D. G., Zeng C. C., Tang B., Wan D., Liu Y. J. RSC Adv. 2017;7:17752–17762. [Google Scholar]
- Xiong X., Gan L., Liu Y., Zhang C., Yong T., Wang Z., Xu H., Yang X. Nanoscale. 2015;7:5217–5229. doi: 10.1039/c4nr07248k. [DOI] [PubMed] [Google Scholar]
- Du L., Yu Y., Chen J., Liu Y., Xia Y., Chen Q., Liu X. FEMS Yeast Res. 2007;7:860–865. doi: 10.1111/j.1567-1364.2007.00274.x. [DOI] [PubMed] [Google Scholar]
- Shemesh K., Sebesta M., Pacesa M., Sau S., Bronstein A., Parnas O., Liefshitz B., Venclovas Č., Krejci L., Kupiec M. Nucleic Acids Res. 2017;45:3189–3203. doi: 10.1093/nar/gkw1348. [DOI] [PMC free article] [PubMed] [Google Scholar]
- Pajaniradje S., Mohankumar K., Pamidimukkala R., Subramanian S., Rajagopalan R. Biomed Res. Int. 2014;2014:474953. doi: 10.1155/2014/474953. [DOI] [PMC free article] [PubMed] [Google Scholar]
- Agus H. H., Sarp C., Cemiloglu M. Toxicol. Res. 2018;7:848–858. doi: 10.1039/c8tx00100f. [DOI] [PMC free article] [PubMed] [Google Scholar]
- Chazotte B. Cold Spring Harb. Protoc. 2011;2011(1):80–82. doi: 10.1101/pdb.prot5557. [DOI] [PubMed] [Google Scholar]
- Azad G. K., Singh V., Mandal P., Singh P., Golla U., Baranwal S., Chauhan S., Tomar R. S. FEBS Open Bio. 2014;4:77–89. doi: 10.1016/j.fob.2014.01.002. [DOI] [PMC free article] [PubMed] [Google Scholar]
- Muñoz M., Cedeño R., Rodríguez J., Van Der Knaap W. P. W., Mialhe E., Bachère E. Penaeus Vannamei Aquaculture. 2000;191:89–107. [Google Scholar]
- Kwolek-Mirek M., Zadrag-Tecza R. FEMS Yeast Res. 2014;14:1068–1079. doi: 10.1111/1567-1364.12202. [DOI] [PubMed] [Google Scholar]
- Committee on Drugs Pediatrics. 1994;94:127–128. [PubMed] [Google Scholar]
- Love J. N., Sammon M., Smereck J. J. Emerg. Med. 2004;27:49–54. doi: 10.1016/j.jemermed.2004.02.010. [DOI] [PubMed] [Google Scholar]
- Klis F. M., Mol P., Hellingwerf K., Brul S. FEMS Microbiol. Rev. 2002;26:239–256. doi: 10.1111/j.1574-6976.2002.tb00613.x. [DOI] [PubMed] [Google Scholar]
- Gohel M., Nagori S. Indian J. Pharm. Sci. 2009;71:622–629. doi: 10.4103/0250-474X.59543. [DOI] [PMC free article] [PubMed] [Google Scholar]
- Aydin E., Türkez H., Taşdemir Ş. Arh. Hig. Rada Toksikol. 2013;64:415–424. doi: 10.2478/10004-1254-64-2013-2365. [DOI] [PubMed] [Google Scholar]
- Marei G. I. K., Abdel Rasoul M. A., Abdelgaleil S. A. M. Pestic. Biochem. Physiol. 2012;103:56–61. [Google Scholar]
- Salucci S., Burattini S., Falcieri E., Gobbi P. Eur. J. Histochem. 2015;59:2539. doi: 10.4081/ejh.2015.2539. [DOI] [PMC free article] [PubMed] [Google Scholar]
- Mutoh N., Kitakima S., Ichihara S. Biosci., Biotechnol., Biochem. 2011;75:1113–1118. doi: 10.1271/bbb.110019. [DOI] [PubMed] [Google Scholar]
- Nakano K., Nakayachi T., Yasumoto E., Morshed S. R., Hashimoto K., Kikuchi H., Nishikawa H., Sugiyama K., Amano O., Kawase M., Sakagami H. Anticancer Res. 2004;24:711–717. [PubMed] [Google Scholar]
- Sobral M. V., Xavier A. L., Lima T. C., de Sousa D. P. Sci. World J. 2014;2014:953451. doi: 10.1155/2014/953451. [DOI] [PMC free article] [PubMed] [Google Scholar]
- Uy B., McGlashan S. R., Shaikh S. B. J. Biomol. Tech. 2011;22:95–107. [PMC free article] [PubMed] [Google Scholar]
- Zini R., Berdeaux A., Morin D. Free Radical Res. 2007;41:1159–1166. doi: 10.1080/10715760701635074. [DOI] [PubMed] [Google Scholar]
- Redza-Dutordoir M., Averill-Bates D. A. Biochim. Biophys. Acta, Mol. Cell Res. 2016;1863:2977–2992. doi: 10.1016/j.bbamcr.2016.09.012. [DOI] [PubMed] [Google Scholar]
- Circu M. L., Aw T. Y. Free Radicals Biol. Med. 2010;48:749–762. doi: 10.1016/j.freeradbiomed.2009.12.022. [DOI] [PMC free article] [PubMed] [Google Scholar]
- Sedaghat A., Karimi Torshizi M. A., Rahimi S. Poult. Sci. 2016;95:2946–2955. doi: 10.3382/ps/pew247. [DOI] [PubMed] [Google Scholar]
- Porres-Martínez M., González-Burgos E., Carretero M. E., Gómez-Serranillos M. P. Zeitschrift für Naturforsch. C. 2016;71:191–199. doi: 10.1515/znc-2014-4135. [DOI] [PubMed] [Google Scholar]
- Gomes B. S., Neto B. P. S., Lopes E. M., Cunha F. V. M., Araújo A. R., Wanderley C. W. S., Wong D. V. T., Júnior R. C. P. L., Ribeiro R. A., Sousa D. P., Medeiros V. R., Oliveira J., and Oliveira R. C. M., A F. Chem.-Biol. Interact. 2017;273:73–81. doi: 10.1016/j.cbi.2017.05.019. [DOI] [PubMed] [Google Scholar]
- Zorova L. D., Popkov V. A., Plotnikov E. Y., Silachev D. N., Pevzner I. B., Jankauskas S. S., Babenko V. A., Zorov S. D., Balakireva A. V., Juhaszova M., Sollott S. J., Zorov D. B. Anal. Biochem. 2018;552:50–59. doi: 10.1016/j.ab.2017.07.009. [DOI] [PMC free article] [PubMed] [Google Scholar]
- Baracca A., Sgarbi G., Solaini G., Lenaz G. Biochim. Biophys. Acta. 2003;1606:137–146. doi: 10.1016/s0005-2728(03)00110-5. [DOI] [PubMed] [Google Scholar]
- Wang J., Luo B., Li X., Lu W., Yang J., Hu Y., Huang P., Wen S. Cell Death Dis. 2017;8:e2887. doi: 10.1038/cddis.2017.272. [DOI] [PMC free article] [PubMed] [Google Scholar]
- Bhat A. H., Dar K. B., Anees S., Zargar M. A., Masood A., Sofi M. A., Ganie S. A. Biomed. Pharmacother. 2015;74:101–110. doi: 10.1016/j.biopha.2015.07.025. [DOI] [PubMed] [Google Scholar]
- Li J., Liu X., Zhang Y., Tian F., Zhao G., Yu Q., Jiang F., Liu Y. Toxicol. Res. 2012;1:137–144. [Google Scholar]
- Cavalleri R., Becker J. S., Pavan A. M., Bianchetti P., Goettert M. I., Ethur E. M., Bustamante-Filho I. C. Andrologia. 2018;50:e13074. doi: 10.1111/and.13074. [DOI] [PubMed] [Google Scholar]
- Wu C. S., Chen Y. J., Chen J. J. W., Shieh J. J., Huang C. H., Lin P. S., Chang G. C., Chang J. T., Lin C. C. J. Evidence-Based Complementary Altern. Med. 2012;2012:818261. doi: 10.1155/2012/818261. [DOI] [PMC free article] [PubMed] [Google Scholar]


