

Abstract
Background
The role of a healthy dietary pattern in the prevention of abdominal aortic aneurysms (AAA) is unknown. We aimed to evaluate the relationship between adherence to a Dietary Approaches To Stop Hypertension‐style dietary pattern and the risk of incident AAAs.
Methods and Results
Dietary intake was assessed via a 66‐item food frequency questionnaire at baseline (1987–1989) and at visit 3 (1993–1995) in 13 496 participants enrolled in the ARIC (Atherosclerosis Risk in Communities) study without clinical AAA (mean age, 54 years). A dietary scoring index based on food times was constructed to assess self‐reported adherence to a dietary approaches to stop hypertension‐style dietary pattern. Participants were followed for incident clinical AAAs using hospital discharge diagnoses, Medicare inpatient and outpatient diagnoses, or death certificates through December 31, 2011. Cox proportional hazards models with covariate adjustment were used to estimate hazard ratios with 95% confidence intervals. During a median follow‐up of 23 years, there were 517 incident AAA cases. Individuals with a Dietary Approaches To Stop Hypertension‐style diet score in the highest quintile had a 40% lower risk of hospitalization for AAA than those in the lowest quintile (hazard ratioQ5 vs Q1: 0.60; 95% confidence intervals: 0.44, 0.83; P trend=0.002). In detailed analyses, higher consumption of fruits, vegetables, whole grains, low‐fat dairy, and nuts and legumes was related to a lower risk for AAA.
Conclusions
Greater adherence to a Dietary Approaches To Stop Hypertension‐style dietary pattern was associated with lower risk for AAA. Higher consumption of fruits, vegetables, whole grains, low‐fat dairy as well as nuts and legumes may help to decrease the burden of AAAs.
Keywords: aneurysm, diet, Dietary Approaches to Stop Hypertension
Subject Categories: Diet and Nutrition, Epidemiology, Vascular Disease, Aneurysm
Clinical Perspective
What Is New?
The role of a healthy dietary pattern in the prevention of abdominal aortic aneurysms is largely unknown.
What Are the Clinical Implications?
In a community‐based setting, individuals with high adherence to a Dietary Approaches To Stop Hypertension‐style dietary pattern had a 40% lower risk of hospitalization for abdominal aortic aneurysm than those with low adherence.
Higher consumption of fruits, vegetables, whole grains, low‐fat dairy as well as nuts and legumes may help to decrease the burden of abdominal aortic aneurysms in US adults.
Introduction
Abdominal aortic aneurysms (AAAs) develop in up to 8% of men and 6% of women over a lifetime.1 Although at most times they remain asymptomatic, rupture of an AAA carries high mortality.2 Aortic wall inflammation has been shown to possibly predict AAA expansion, rupture, and need for surgical repair.2, 3 However, given the considerable morbidity and mortality risk associated with AAA progression, understanding the role of risk factors and preventive measures is of great clinical importance. First and foremost, smoking followed by hypertension and hypercholesterolemia have been identified as modifiable risk factors for developing AAAs, although both latter ones have shown inconsistent findings.1, 4, 5, 6 The role of diet in the development of AAAs is largely unclear. Most evidence is confined to single food items or nutrients, and findings are inconsistent across studies.4, 7, 8, 9, 10 Information is lacking with regards to the association between adherence to a healthy eating pattern and AAA risk in the general population.
The Dietary Approaches to Stop Hypertension (DASH) diet is a healthy and balanced dietary pattern currently promoted by the National Heart, Lung, and Blood Institute of the National Institutes of Health, the United States Department of Agriculture, and the American Heart Association/American College of Cardiology as a healthy diet for all Americans.11, 12, 13, 14, 15 It is rich in fruits, vegetables, low‐fat dairy and includes mostly whole grains; lean meats, fish and poultry; nuts and beans. Adhering to a DASH dietary pattern has been demonstrated to effectively lower blood pressure levels14, 16 and, in observational studies, it has been shown to be associated with a reduced risk of cardiovascular events and kidney disease.17, 18, 19
The objective of this study was to assess if adherence to a DASH‐style dietary pattern is associated with an altered risk for AAA. We therefore examined the association between adherence to DASH‐style dietary pattern and its components with subsequent incidence of AAA in a large, US community‐based cohort of middle‐aged adults. We hypothesized that adherence to a DASH‐style dietary pattern would be associated with a lower risk for AAAs. Second, given previous data suggesting a close linkage between chronic inflammation and the development of AAA,3, 20 we further hypothesized that the relationship between a DASH‐style dietary pattern and AAA risk would differ by the presence of systemic inflammation reflected by C‐reactive protein (CRP) levels.
Methods
The data, analytic methods, and study materials are made available to other researchers for purposes of reproducing the results or replicating the procedure. The data underlying our work can be obtained through 2 mechanisms. First, interested investigators can contact the ARIC Coordinating Center at the University of North Carolina—Chapel Hill. Details about the procedures for data request can be found online.21 Second, most ARIC data can be obtained from BioLINCC, a repository maintained by the National Heart, Lung, and Blood Institute. The BioLINCC website includes detailed information about the available data and the process to obtain such data.22
Study Population
The ARIC (Atherosclerosis Risk in Communities) study is a community‐based prospective cohort study of 15 792 middle‐aged adults (aged 45–64 years at baseline) from 4 US communities (Washington County, Maryland; suburban Minneapolis, Minnesota; Jackson, Mississippi; and Forsyth County, North Carolina).23 ARIC investigators performed a baseline examination of participants in 1987–1989 (visit 1), and followed them by annual telephone interview and up to 4 re‐examinations in 1990–1992 (visit 2), 1993–1995 (visit 3), 1996–1998 (visit 4), and 2011–2013 (visit 5). For this analysis, only white and black adults were included; blacks from the Minneapolis and Washington County field centers were excluded because of small numbers (n=103). Furthermore, we excluded individuals with previous surgery for AAA (reporting prior AAA surgery or aortic angioplasty) and those whose follow‐up AAA status was uncertain at baseline (n=41).1, 20 Participants with incomplete dietary information or with implausible total energy intake (<600 or >4200 kcal per day for men, <500 or >3600 kcal per day for women) were also excluded from the analysis (n=359). Finally, individuals with missing dietary data or covariate information were not part of this analysis (n=1793). Our final study sample consisted of 13 496 participants who were followed through December 31, 2011 (Figure).
Figure 1.
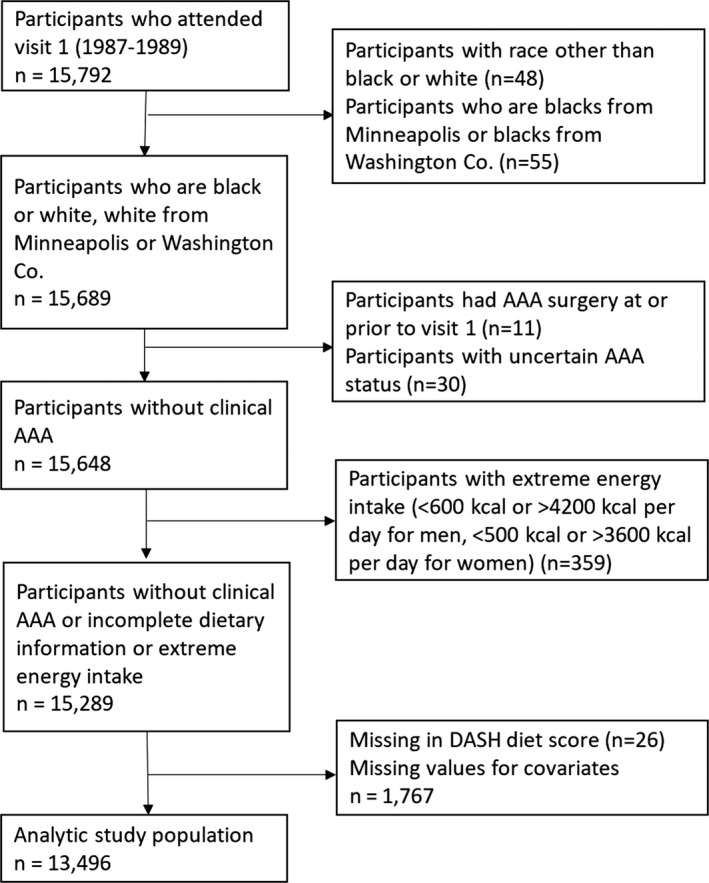
Flow diagram for selection of the analytic study population. AAA indicates abdominal aortic aneurysm; DASH, Dietary Approaches to Stop Hypertension.
All participating institutions received institutional review board approval for the study and all participants provided written informed consent.
Assessment of Dietary Intake
The ARIC study assessed dietary intake using a 66‐item food frequency questionnaire (FFQ) adapted from the 61‐item FFQ developed by Willett et al24 which has been shown to be reliable.25 The FFQ was administered in person to all subjects by a trained interviewer following a standard protocol at visit 1 (1987–1989) and visit 3 (1993–1995). The cumulative average diet incorporating the 2 dietary assessments, when available before AAA occurrence, was used in the analysis, as this improves the estimation of usual dietary intake relative to a single assessment.26
Assessment of DASH Diet Score
Two previously developed dietary scoring indices based on food items or nutrient targets were applied to assess adherence to a DASH‐style diet.19, 27, 28, 29 The DASH diet score based predominantly on food items considered intake of: (1) fruits, (2) vegetables, (3) nuts and legumes, (4) low‐fat dairy products, (5) whole grains, (6) sodium, (7) sweetened beverages, and (8) red and processed meats.19, 30 For fruits, vegetables, nuts and legumes, low‐fat dairy, and whole grains, participants in the highest quintile received a score of 5, those in the second highest quintile received a score of 4, and so on. For sodium, sweetened beverages, and red and processed meats, scoring was reversed, ie, participants in the highest quintile received a minimum score of 1 whereas participants in the lowest quintile received a maximum score of 5. The scores for each component were summed and the overall score ranged from 8 (no adherence) to 40 (perfect adherence).19
In sensitivity analyses, we applied the DASH diet score based on nutrient targets. This score consisted of 9 components, ie, low intake of (1) saturated fat, (2) total fat, (3) cholesterol, and (4) sodium and high intake of (5) protein, (6) fiber, (7) magnesium, (8) calcium, and (9) potassium.27, 28, 29 Individuals who met the DASH target for a nutrient received a score of 1 while those who achieved the intermediate target for a nutrient received a score of 0.5, and those meeting neither goal received 0 points. These DASH nutrient component scores were summed and ranged from 0 to 9 with 9 points representing optimal accordance with a DASH dietary pattern.27, 28, 29
Both scoring systems were analyzed using quintiles with a higher quintile reflecting higher adherence to a DASH‐style diet. We also analyzed quintiles of individual food and nutrient components (including sodium/potassium ratio) of the DASH diet scores. Study participants did not receive dietary counseling, and the DASH‐style diet results were not published at the time of ARIC study visits 1 and 3.14
Assessment of Abdominal Aortic Aneurysms
The primary end point for this study was incident AAA after baseline (ARIC visit 1, 1987–1989). Incident clinical AAAs were identified by searching hospitalization and death records as well as Medicare data as previously outlined.1, 20 In annual telephone calls with ARIC participants, interviewers asked about any interim hospitalizations and identified deaths, and these hospitalization and death records were sought. Surveillance was conducted to identify additional hospitalizations or deaths and linked participant identifiers with Medicare data from the Centers for Medicare and Medicaid Services for 1991–2011, to find any missing hospital or outpatient events for those aged >65 years. Clinical AAAs were identified as those with a hospital discharge diagnosis, or 2 Medicare outpatient claims that occurred at least 1 week apart, with International Classification of Diseases, Ninth Revision, Clinical Modification (ICD‐9‐CM) codes of 441.3 or 441.4, or procedure codes of 38.44 or 39.71, or the following cause of death codes: ICD‐9 441.3 or 441.4 or ICD‐10 code I71.3 or I71.4.1 Although labeled “clinical AAAs,” these diagnoses included both symptomatic and asymptomatic AAAs that were medically documented. Thoracic, thoracoabdominal, or unspecified aortic aneurysms were treated as non‐events.
Covariates
Covariates were assessed at baseline via standardized protocols or questionnaires.23, 31 Information on smoking habits was obtained by interview and participants were classified as current, former, or never smokers. Pack‐years of smoking were calculated as the average number of cigarettes smoked per day multiplied by the years of smoking divided by 20 (the number of cigarettes in a standard pack).1 Data on education and intake of antihypertensive or lipid lowering medication were derived from standardized questionnaires.23 Sports‐related physical activity and leisure‐related physical activity were assessed with the use of Baecke's questionnaire and scoring systems.32 Hypertension was coded positive in participants with systolic blood pressure ≥140 mm Hg or diastolic blood pressure ≥90 mm Hg or use of antihypertensive medication. Abdominal obesity was defined as waist‐to‐hip ratio >0.85 for females and >0.90 for males. ARIC participants underwent venipuncture at each examination.23 Diabetes mellitus status was coded positive in participants with self‐reported physician diagnosis of diabetes mellitus, fasting blood glucose ≥126 mg/dL, non‐fasting blood glucose ≥200 mg/dL, or use of diabetes mellitus medication. Hypercholesterolemia was coded positive if total blood cholesterol level ≥240 mg/dL or if the participant was taking cholesterol‐lowering drugs. Cardiovascular disease was defined as self‐reported history of myocardial infarction, adjudicated myocardial infarction on ECG, coronary bypass, or angioplasty. At ARIC visit 2, CRP was measured in serum using a latex‐particle enhanced immunoturbidimetric assay kit (Roche Diagnostics, Indianapolis, IN) and read on the Roche Modular P800 Chemistry analyzer (Roche Diagnostics).33
Statistical Analysis
Means and proportions were used to describe baseline characteristics (ARIC visit 1, 1987–1989) according to quintiles of the food‐based DASH‐style diet score. To assess the crude (unadjusted) association of the DASH‐style diet score with AAAs, we calculated incidence rates (IR) of incident AAA per 1000 person‐years as the number of diagnosed cases of AAA occurring during the entire follow‐up period divided by person‐years of follow‐up according to quintile of the DASH‐style diet score. Time to event was defined as time from the baseline examination to the date of AAA identification, death, lost to follow‐up, or December 31, 2011. Cox proportional hazards regression models were used to account for potential confounding on the association between the DASH‐style diet score and incident AAAs. An initial model adjusted for sex, total energy intake, race‐center, and age by the use of restricted cubic splines with knots at 45, 51, 57, and 63 years of age representing the 5th, 35th, 65th, and 95th percentiles (minimally adjusted model; model 1). A second model adjusted for all of the baseline covariates in model 1 plus alcohol intake quintiles (sex specific quintiles of g/week), education (less than high school, high school or equivalent, college or above), household income (<$25 000; $25 000–$49 999; ≥$50 000), smoking status (current smoker, former smoker with ≥20 pack‐years, former smoker with <20 pack‐years, never smoker), sport‐related physical activity index, leisure‐time physical activity index, body mass index category (<25, 25 to <30, ≥30 kg/m2), abdominal obesity (waist‐to‐hip ratio >0.85 for females and >0.90 for males), hypertension (yes/no), diabetes mellitus (yes/no), hypercholesterolemia (yes/no), and cardiovascular disease (yes/no) (fully adjusted model; model 2).7 We tested for trend across quintiles of the DASH‐style diet score using the median value within each quintile. Besides examining the overall dietary pattern, we further examined the relationship between individual food and nutrient components of the DASH style dietary scores and risk for AAA, including each component separately in the fully adjusted model. Additional analyses were undertaken by including time‐varying cases of hypertension into the modeling with further stratification by CRP levels (above versus below or equal to 3 mg/L). Finally, we examined effect modification by sex, race, smoking, and obesity using stratified analyses and tests of interaction with each of the potential modifiers. Stata version 14.2 was used for all statistical analyses (StataCorp LP, College Station, TX).
Results
Individuals with a DASH diet score in the highest quintile were older, more likely to be female, to be white, to have a higher education and a higher household income, to have never smoked, and to have lower CRP levels (Table 1).
Table 1.
Baseline Characteristics According to Quintiles of DASH Diet Score, ARIC, 1987–1989
| Characteristic | Quintiles of Food‐Based DASH Diet Scorea: Median (Minimum–Maximum), n | P Value for Trendb | ||||
|---|---|---|---|---|---|---|
| Quintile 1: 17 (8–19), n=2670 | Quintile 2: 22 (20–23), n=3425 | Quintile 3: 25 (24–25), n=1979 | Quintile 4: 27 (26–28), n=2686 | Quintile 5: 31 (29–38), n=2736 | ||
| Age, y | 53.4 (5.7) | 53.8 (5.7) | 54.1 (5.7) | 54.5 (5.7) | 55.2 (5.7) | <0.001 |
| Female, % | 1059 (39.7%) | 1642 (47.9%) | 1120 (56.6%) | 1656 (61.7%) | 1934 (70.7%) | <0.001 |
| Black, % | 987 (37.0%) | 932 (27.2%) | 431 (21.8%) | 500 (18.6%) | 407 (14.9%) | <0.001 |
| Smoking status, % | <0.001 | |||||
| Current smoker | 1049 (39.3%) | 1040 (30.4%) | 448 (22.6%) | 548 (20.4%) | 426 (15.6%) | |
| Former smoker, ≥20 pack‐years | 389 (14.6%) | 539 (15.7%) | 278 (14.0%) | 415 (15.5%) | 382 (14.0%) | |
| Former smoker, <20 pack‐years | 373 (14.0%) | 526 (15.4%) | 348 (17.6%) | 505 (18.8%) | 581 (21.2%) | |
| Never smoker | 859 (32.2%) | 1320 (38.5%) | 905 (45.7%) | 1218 (45.3%) | 1347 (49.2%) | |
| Education, % | <0.001 | |||||
| Less than high school | 960 (36.0%) | 857 (25.0%) | 386 (19.5%) | 454 (16.9%) | 392 (14.3%) | |
| High school or equivalent | 1102 (41.3%) | 1444 (42.2%) | 852 (43.1%) | 1120 (41.7%) | 1046 (38.2%) | |
| College or above | 608 (22.8%) | 1124 (32.8%) | 741 (37.4%) | 1112 (41.4%) | 1298 (47.4%) | |
| Annual househould income, % | <0.001 | |||||
| <$24 999 | 1260 (47.2%) | 1326 (38.7%) | 667 (33.7%) | 883 (32.9%) | 841 (30.7%) | |
| $25 000 to $49 999 | 995 (37.3%) | 1270 (37.1%) | 775 (39.2%) | 1000 (37.2%) | 1056 (38.6%) | |
| >$50 000 | 415 (15.5%) | 829 (24.2%) | 537 (27.1%) | 803 (29.9%) | 839 (30.7%) | |
| Diabetes mellitus,c % | 220 (8.2%) | 365 (10.7%) | 254 (12.8%) | 359 (13.4%) | 365 (13.3%) | <0.001 |
| Prevalent CVD, % | 191 (7.2%) | 312 (9.1%) | 159 (8.0%) | 244 (9.1%) | 278 (10.2%) | 0.001 |
| Hypertension,d % | 1038 (38.9%) | 1328 (38.8%) | 757 (38.3%) | 1061 (39.5%) | 1068 (39.0%) | 0.719 |
| Hypercholesterolemia,e % | 634 (23.7%) | 888 (25.9%) | 557 (28.1%) | 735 (27.4%) | 775 (28.3%) | <0.001 |
| BMI category, % | <0.001 | |||||
| BMI <25 kg/m2 | 877 (32.8%) | 1085 (31.7%) | 600 (30.3%) | 887 (33.0%) | 1062 (38.8%) | |
| BMI 25 to <30 kg/m2 | 1059 (39.7%) | 1388 (40.5%) | 840 (42.4%) | 1047 (39.0%) | 1025 (37.5%) | |
| BMI ≥30 kg/m2 | 734 (27.5%) | 952 (27.8%) | 539 (27.2%) | 752 (28.0%) | 649 (23.7%) | |
| Abdominal obesity,f % | 2198 (82.3%) | 2760 (80.6%) | 1538 (77.7%) | 2052 (76.4%) | 1997 (73.0%) | <0.001 |
| Leisure‐time physical activity index | 2.1 (0.5) | 2.3 (0.6) | 2.4 (0.5) | 2.5 (0.6) | 2.6 (0.6) | <0.001 |
| Sport‐related physical activity index | 2.2 (0.7) | 2.4 (0.8) | 2.4 (0.8) | 2.5 (0.8) | 2.7 (0.8) | <0.001 |
| Total energy intake, kcal/d | 1760.9 (638.2) | 1656.0 (648.7) | 1608.3 (611.1) | 1566.1 (587.3) | 1536.4 (518.4) | <0.001 |
| C‐reactive protein,g mg/L | 4.7 (7.9) | 4.5 (6.3) | 4.6 (8.6) | 4.2 (6.9) | 3.9 (6.0) | <0.001 |
Data reported are mean (standard deviation) or n (%). ARIC indicates Atherosclerosis Risk in Communities Study; BMI, body mass index; CVD, cardiovascular disease; DASH, Dietary Approaches to Stop Hypertension.
Food consumption (DASH diet score and individual nutrients) was estimated using cumulative average intake. For those who developed AAA or were censored from the analysis before visit 3, food frequency questionnaire data from visit 1 were used. Otherwise, for those who developed AAA or were censored from the analysis after study visit 3, the average of food frequency questionnaire data from visits 1 and 3 were used.
Cochran‐Armitage trend tests for categorical variables and linear regression for continuous variables were used to test for trend in baseline characteristics across quintiles of DASH diet scores.
Diabetes mellitus status was defined as self‐reported physician diagnosis of diabetes mellitus, fasting blood glucose ≥126 mg/dL, non‐fasting blood glucose ≥200 mg/dL, or current use of diabetes mellitus medication.
Hypertension was defined as systolic blood pressure ≥140 mm Hg, diastolic blood pressure ≥90 mm Hg, or current use of anti‐hypertensive medication.
Hypercholesterolemia was defined as total blood cholesterol level ≥240 mg/dL or current use of lipid‐lowering medication.
Abdominal obesity was defined as waist‐to‐hip ratio >0.85 for females and >0.90 for males.
C‐reactive protein (CRP) was measured at ARIC visit 2 (1990–1992). Among 13 080 participants attending visit 2, 12 227 participants had measurements of CRP.
A total of 517 cases of incident hospitalized AAA cases were observed during a median follow‐up of 23 years among 13 496 participants. Across quintiles of increasing DASH dietary scores based on food items, individuals with greatest self‐reported adherence had a lower risk for incident AAA hospitalizations (Table 2). Participants in the highest quintile had a 40% lower risk of developing incident AAA than those with the lowest score quintile (HRQ5 vs Q1: 0.60; 95% CI: 0.44, 0.83; P trend=0.002) after fully adjusting for confounding variables (model 2). These main results did not change substantially when we excluded current smokers at baseline from our analyses (Table S1) or undertook stratified analyses by sex (Table S2). Furthermore, our results also held true for sensitivity analyses using a DASH diet score based on nutrient targets (HRQ5 vs Q1: 0.61; 95% CI: 0.45, 0.84; P trend=0.006) (Table S3). When we investigated the interactions of adherence to a DASH‐style dietary pattern with AAA risk, we did not observe any significant interaction by sex (P interaction by sex=0.32), race (P interaction by race=0.38), smoking (P interaction by smoking=0.79), or obesity (P interaction by obesity=0.16).
Table 2.
Association of Quintiles of Food‐Based DASH Diet Score With Incident AAAa
| Quintiles of Food‐Based DASH Diet Scoreb | P Value for Trendc | |||||
|---|---|---|---|---|---|---|
| Quintile 1: n=2670 | Quintile 2: n=3425 | Quintile 3: n=1979 | Quintile 4: n=2686 | Quintile 5: n=2736 | ||
| Median Score (range) | 17.0 (8.0–19.0) | 22.0 (20.0–23.0) | 25.0 (24.0–25.0) | 27.0 (26.0–28.0) | 31.0 (29.0–38.0) | |
| Events | 144 | 151 | 61 | 94 | 67 | |
| Person‐years | 50 560 | 67 163 | 39 767 | 54 502 | 55 991 | |
| IR (95% CI)d | 2.85 (2.42–3.35) | 2.25 (1.92–2.64) | 1.53 (1.19–1.97) | 1.72 (1.41–2.11) | 1.20 (0.94–1.52) | |
| Model 1 HR (95% CI)e | 1 (ref) | 0.76 (0.61–0.96) | 0.53 (0.39–0.72) | 0.59 (0.45–0.77) | 0.41 (0.31–0.56) | <0.001 |
| Model 2 HR (95% CI)f | 1 (ref) | 0.87 (0.69–1.10) | 0.69 (0.51–0.94) | 0.79 (0.60–1.05) | 0.60 (0.44–0.83) | 0.002 |
AAA indicates abdominal aortic aneurysm; ARIC, Atherosclerosis Risk in Communities Study; CI, confidence interval; DASH, Dietary Approaches to Stop Hypertension; HR, hazard ratio; IR, incidence rate.
Incident AAA cases were ascertained from baseline (1987–1989) through December 31, 2011.
Food consumption (DASH diet score and individual components) was estimated using cumulative average intake. For those who developed AAA or were censored from the analysis before visit 3, food frequency questionnaire data from visit 1 were used. Otherwise, for those who developed AAA or were censored from the analysis after study visit 3, the average of food frequency questionnaire data from visits 1 and 3 were used.
Trend across quintiles was tested using the median value for the DASH diet score within each quintile.
IR (incidence rate) expressed as the number of AAA cases per 1000 person‐years with no adjustment for covariates.
Model 1: adjusted for sex, total energy intake, race‐center, and age by the use of restricted cubic splines (with knots at 45, 51, 57, and 63 years of age, representing the 5th, 35th, 65th, and 95th percentiles).
Model 2: adjusted for variables in model 1+alcohol intake quintiles (sex specific quintiles of g/week), education (less than high school, high school or equivalent, college or above), household income (<$25 000; $25 000–$49 999; ≥$50 000), smoking status (current smoker, former smoker with ≥20 pack‐years, former smoker with <20 pack‐years, never smoker), sport‐related physical activity index, leisure‐time physical activity index, body mass index category (<25, 25 to <30, ≥30 kg/m2), abdominal obesity (waist‐to‐hip ratio >0.85 for females and >0.90 for males), hypertension (yes/no), diabetes mellitus (yes/no), hypercholesterolemia (yes/no), and cardiovascular disease (yes/no).
In detailed analyses of food‐item components of a DASH‐style dietary pattern (Table 3), individuals with the highest levels of dietary intake of fruits, vegetables, whole grains, and low‐fat dairy products had a lower risk of incident AAA (fruits HRQ5 vs Q1: 0.70; 95% CI: 0.52, 0.95, P trend=0.013; vegetables HRQ5 vs Q1: 0.60; 95% CI: 0.44, 0.80, P trend<0.001; whole grains HRQ5 vs Q1: 0.67; 95% CI: 0.51, 0.89, P trend=0.027; low‐fat dairy HRQ5 vs Q1: 0.48; 95% CI: 0.36, 0.63, P trend<0.001). In addition, higher nuts and legumes consumption was associated with reduced AAA risk (HRQ5 vs Q1: 0.55; 95% CI: 0.41, 0.72, P trend<0.001). Higher sodium intake was significantly associated with a decreased risk for incident AAAs (HRQ5 vs Q1: 0.64; 95% CI: 0.44, 0.93, P trend=0.006), whereas a higher sodium‐potassium ratio was not associated with AAA risk (HRQ5 vs Q1: 0.86; 95% CI: 0.66, 1.12, P trend=0.409). Dietary intake of red and processed meat products as well as sweetened beverages were not significantly associated with AAA risk in the fully adjusted model. In detailed analyses of nutrient‐item components of a DASH‐style dietary pattern, lower saturated fat, higher protein, and higher fiber intake were associated with a lower risk for incident AAAs (Table S4).
Table 3.
Association of Individual Components of the Food‐Based DASH Diet Score and Risk for AAAa
| Component | Quintiles of DASH Food Componentsb | P Value for Trendc | ||||
|---|---|---|---|---|---|---|
| Quintile 1 | Quintile 2 | Quintile 3 | Quintile 4 | Quintile 5 | ||
| Red and processed meat | ||||||
| Median (range), svg/d | 0.3 (0.0–0.5) | 0.6 (0.5–0.8) | 0.9 (0.8–1.1) | 1.3 (1.1–1.6) | 2.0 (1.6–13.6) | |
| Events | 103 | 88 | 67 | 113 | 146 | |
| Person‐years | 55 341 | 55 966 | 54 641 | 52 190 | 49 844 | |
| IR (95% CI)d | 1.86 (1.53–2.26) | 1.57 (1.28–1.94) | 1.23 (0.97–1.56) | 2.17 (1.80–2.60) | 2.93 (2.49–3.44) | |
| Model 1 HR (95% CI)e | 1 (ref) | 0.86 (0.65–1.15) | 0.60 (0.44–0.83) | 1.01 (0.76–1.35) | 1.33 (0.98–1.80) | 0.039 |
| Model 2 HR (95% CI)f | 1 (ref) | 0.81 (0.61–1.08) | 0.54 (0.40–0.75) | 0.88 (0.66–1.18) | 1.04 (0.77–1.42) | 0.563 |
| Sweetened beverages | ||||||
| Median (range), svg/d | 0.0 (0.0–0.0) | 0.1 (0.0–0.1) | 0.2 (0.1–0.4) | 0.6 (0.5–1.0) | 1.4 (1.0–9.5) | |
| Events | 152 | 53 | 128 | 65 | 119 | |
| Person‐years | 57 561 | 52 659 | 56 847 | 50 182 | 50 733 | |
| IR (95% CI)d | 2.64 (2.25–3.10) | 1.01 (0.77–1.32) | 2.25 (1.89–2.68) | 1.30 (1.02–1.65) | 2.35 (1.96–2.81) | |
| Model 1 HR (95% CI)e | 1 (ref) | 0.33 (0.24–0.45) | 0.69 (0.54–0.87) | 0.40 (0.30–0.54) | 0.82 (0.63–1.08) | 0.127 |
| Model 2 HR (95% CI)f | 1 (ref) | 0.37 (0.27–0.51) | 0.76 (0.59–0.97) | 0.43 (0.32–0.58) | 0.80 (0.60–1.05) | 0.071 |
| Fruits | ||||||
| Median (range), svg/d | 0.6 (0.0–0.9) | 1.3 (1.0–1.6) | 1.9 (1.6–2.2) | 2.6 (2.2–3.1) | 3.9 (3.1–23.6) | |
| Events | 146 | 106 | 107 | 79 | 79 | |
| Person‐years | 50 049 | 53 534 | 55 904 | 54 700 | 53 796 | |
| IR (95% CI)d | 2.92 (2.48–3.43) | 1.98 (1.64–2.40) | 1.91 (1.58–2.31) | 1.44 (1.16–1.80) | 1.47 (1.18–1.83) | |
| Model 1 HR (95% CI)e | 1 (ref) | 0.63 (0.49–0.81) | 0.60 (0.47–0.78) | 0.47 (0.35–0.62) | 0.47 (0.35–0.62) | <0.001 |
| Model 2 HR (95% CI)f | 1 (ref) | 0.76 (0.59–0.98) | 0.80 (0.62–1.04) | 0.68 (0.51–0.91) | 0.70 (0.52–0.95) | 0.013 |
| Vegetables | ||||||
| Median (range), svg/d | 0.4 (0.0–0.6) | 0.8 (0.6–0.9) | 1.1 (0.9–1.3) | 1.5 (1.3–1.8) | 2.3 (1.8–18.1) | |
| Events | 141 | 122 | 92 | 91 | 71 | |
| Person‐years | 52 883 | 53 115 | 54 245 | 54 117 | 53 623 | |
| IR (95% CI)d | 2.67 (2.26–3.14) | 2.30 (1.92–2.74) | 1.70 (1.38–2.08) | 1.68 (1.37–2.07) | 1.32 (1.05–1.67) | |
| Model 1 HR (95% CI)e | 1 (ref) | 0.85 (0.66–1.08) | 0.63 (0.48–0.82) | 0.62 (0.48–0.82) | 0.48 (0.36–0.65) | <0.001 |
| Model 2 HR (95% CI)f | 1 (ref) | 0.98 (0.77–1.25) | 0.73 (0.56–0.96) | 0.72 (0.55–0.95) | 0.60 (0.44–0.80) | <0.001 |
| Whole grains | ||||||
| Median (range), svg/d | 0.1 (0.0–0.2) | 0.4 (0.3–0.6) | 0.7 (0.6–0.9) | 1.1 (0.9–1.5) | 2.2 (1.6–8.6) | |
| Events | 149 | 115 | 51 | 121 | 81 | |
| Person‐years | 53 932 | 55 711 | 50 401 | 52 906 | 55 032 | |
| IR (95% CI)d | 2.76 (2.35–3.24) | 2.06 (1.72–2.48) | 1.01 (0.77–1.33) | 2.29 (1.91–2.73) | 1.47 (1.18–1.83) | |
| Model 1 HR (95% CI)e | 1 (ref) | 0.76 (0.60–0.97) | 0.38 (0.28–0.53) | 0.83 (0.65–1.05) | 0.47 (0.36–0.62) | <0.001 |
| Model 2 HR (95% CI)f | 1 (ref) | 0.92 (0.72–1.17) | 0.48 (0.35–0.66) | 1.00 (0.79–1.28) | 0.67 (0.51–0.89) | 0.027 |
| Low‐fat dairy | ||||||
| Median (range), svg/d | 0.0 (0.0–0.1) | 0.2 (0.1–0.4) | 0.6 (0.5–0.9) | 1.0 (0.9–1.4) | 2.1 (1.4–10.8) | |
| Events | 181 | 85 | 25 | 135 | 91 | |
| Person‐years | 52 848 | 51 281 | 53 785 | 54 743 | 55 326 | |
| IR (95% CI)d | 3.42 (2.96–3.96) | 1.66 (1.34–2.05) | 0.46 (0.31–0.69) | 2.47 (2.08–2.92) | 1.64 (1.34–2.02) | |
| Model 1 HR (95% CI)e | 1 (ref) | 0.43 (0.33–0.55) | 0.11 (0.07–0.16) | 0.55 (0.44–0.70) | 0.37 (0.28–0.48) | <0.001 |
| Model 2 HR (95% CI)f | 1 (ref) | 0.48 (0.37–0.63) | 0.13 (0.08–0.20) | 0.71 (0.56–0.90) | 0.48 (0.36–0.63) | <0.001 |
| Nuts and legumes | ||||||
| Median (range), svg/d | 0.3 (0.0–0.4) | 0.6 (0.4–0.7) | 0.8 (0.7–0.9) | 1.1 (0.9–1.3) | 1.7 (1.3–10.6) | |
| Events | 130 | 90 | 86 | 110 | 101 | |
| Person‐years | 52 229 | 54 578 | 53 936 | 54 070 | 53 170 | |
| IR (95% CI)d | 2.49 (2.10–2.96) | 1.65 (1.34–2.03) | 1.59 (1.29–1.97) | 2.03 (1.69–2.45) | 1.90 (1.56–2.31) | |
| Model 1 HR (95% CI)e | 1 (ref) | 0.59 (0.45–0.78) | 0.54 (0.41–0.71) | 0.63 (0.48–0.82) | 0.49 (0.37–0.65) | <0.001 |
| Model 2 HR (95% CI)f | 1 (ref) | 0.63 (0.48–0.83) | 0.60 (0.45–0.79) | 0.69 (0.53–0.90) | 0.55 (0.41–0.72) | <0.001 |
| Sodium | ||||||
| Median (range), mg/d | 848 (260–1019) | 1153 (1020–1285) | 1412 (1285–1550) | 1704 (1550–1907) | 2211 (1907–5030) | |
| Events | 103 | 103 | 86 | 94 | 131 | |
| Person‐years | 52 138 | 54 684 | 54 793 | 53 846 | 52 522 | |
| IR (95% CI)d | 1.98 (1.63–2.40) | 1.88 (1.55–2.28) | 1.57 (1.27–1.94) | 1.75 (1.43–2.14) | 2.49 (2.10–2.96) | |
| Model 1 HR (95% CI)e | 1 (ref) | 0.80 (0.60–1.05) | 0.59 (0.43–0.79) | 0.57 (0.41–0.78) | 0.65 (0.45–0.94) | 0.004 |
| Model 2 HR (95% CI)f | 1 (ref) | 0.78 (0.59–1.03) | 0.59 (0.44–0.81) | 0.59 (0.43–0.82) | 0.64 (0.44–0.93) | 0.006 |
| Sodium/potassium ratiog | ||||||
| Median (range) | 0.4 (0.1–0.5) | 0.5 (0.5–0.5) | 0.6 (0.5–0.6) | 0.6 (0.6–0.7) | 0.8 (0.7–2.0) | |
| Events | 118 | 79 | 91 | 95 | 134 | |
| Person‐years | 53 802 | 54 383 | 54 506 | 54 143 | 51 148 | |
| IR (95% CI)d | 2.19 (1.83–2.63) | 1.45 (1.17–1.81) | 1.67 (1.36–2.05) | 1.75 (1.43–2.15) | 2.62 (2.21–3.10) | |
| Model 1 HR (95% CI)e | 1 (ref) | 0.60 (0.45–0.79) | 0.64 (0.49–0.84) | 0.64 (0.49–0.84) | 0.94 (0.73–1.21) | 0.992 |
| Model 2 HR (95% CI)f | 1 (ref) | 0.61 (0.45–0.81) | 0.66 (0.50–0.87) | 0.63 (0.48–0.83) | 0.86 (0.66–1.12) | 0.409 |
AAA indicates abdominal aortic aneurysm; ARIC, Atherosclerosis Risk in Communities Study; CI, confidence interval; DASH, Dietary Approaches to Stop Hypertension; HR, hazard ratio; IR, incidence rate; svg/d, servings/day.
Incident AAA cases were ascertained from baseline (1987–1989) through December 31, 2011.
Food consumption was estimated using cumulative average intake. For those who developed AAA or were censored from the analysis before visit 3, food frequency questionnaire data from visit 1 were used. Otherwise, for those who developed AAA or were censored from the analysis after study visit 3, the average of food frequency questionnaire data from visits 1 and 3 were used.
Trend across quintiles was tested using the median value for the component of the DASH diet score within each quintile.
IR (incidence rate) expressed as the number of AAA cases per 1000 person‐years with no adjustment for covariates.
Model 1: adjusted for sex, total energy intake, race‐center, and age by the use of restricted cubic splines (with knots at 45, 51, 57, and 63 years of age, representing the 5th, 35th, 65th, and 95th percentiles).
Model 2: adjusted for variables in model 1+alcohol intake quintiles (sex specific quintiles of g/week), education (less than high school, high school or equivalent, college or above), household income (<$25 000; $25 000–$49 999; ≥$50 000), smoking status (current smoker, former smoker with ≥20 pack‐years, former smoker with <20 pack‐years, never smoker), sport‐related physical activity index, leisure‐time physical activity index, body mass index category (<25, 25 to <30, ≥30 kg/m2), abdominal obesity (waist‐to‐hip ratio >0.85 for females and >0.90 for males), hypertension (yes/no), diabetes mellitus (yes/no), hypercholesterolemia (yes/no), and cardiovascular disease (yes/no).
Sodium/potassium ratio was defined as (Na mg/1000 kcal)/(K mg/1000 kcal).
To assess for partial mediation of the association between the DASH style dietary pattern and incident AAA risk, we additionally adjusted for hypertension modeled as a time‐varying variable. Our results changed only marginally (Table 4). After further stratifying our time‐varying results by CRP level, we found that participants with CRP levels above 3 mg/L tended to have a stronger inverse association between the food‐based DASH diet score and risk of incident AAA compared with people with CRP ≤3 mg/L (P interaction=0.130).
Table 4.
Association of Quintiles of DASH Diet Score With Incident AAAa After Adjusting for Time‐Varying Hypertension and Stratified by C‐Reactive Protein Levels
| Quintiles of DASH Diet Scoreb | P Value for Trendc | P for Interaction | |||||
|---|---|---|---|---|---|---|---|
| Quintile 1: n=2870 | Quintile 2: n=3642 | Quintile 3: n=2085 | Quintile 4: n=2834 | Quintile 5: n=2891 | |||
| Overalld | 1 (ref) | 0.80 (0.62–1.02) | 0.64 (0.46–0.88) | 0.72 (0.54–0.96) | 0.53 (0.38–0.74) | <0.001 | |
| CRP ≤3 mg/Ld | 1 (ref) | 0.84 (0.58–1.23) | 0.72 (0.45–1.14) | 0.92 (0.61–1.37) | 0.58 (0.36–0.94) | 0.091 | |
| CRP >3 mg/Ld | 1 (ref) | 0.66 (0.46–0.96) | 0.41 (0.24–0.70) | 0.44 (0.27–0.71) | 0.45 (0.27–0.75) | <0.001 | 0.130 |
AAA indicates abdominal aortic aneurysm; ARIC, Atherosclerosis Risk in Communities Study; CI, confidence interval; CRP, C‐reactive protein; DASH, Dietary Approaches to Stop Hypertension; HR, hazard ratio; IR, incidence rate.
Incident AAA cases were ascertained from ARIC visit 2 (1990–1992) through December 31, 2011.
Food consumption was estimated using cumulative average intake. For those who developed AAA or were censored from the analysis before visit 3, food frequency questionnaire data from visit 1 were used. Otherwise, for those who developed AAA or were censored from the analysis after study visit 3, the average of food frequency questionnaire data from visits 1 and 3 were used.
Trend across quintiles was tested using the median value for the component of the DASH diet score within each quintile.
Adjusted for sex, total energy intake, race‐center, and age by the use of restricted cubic splines (with knots at 45, 51, 57, and 63 years of age, representing the 5th, 35th, 65th, and 95th percentiles), alcohol intake quintiles (sex specific quintiles of g/week), education (less than high school, high school or equivalent, college or above), household income (<$25 000; $25 000–$49 999; ≥$50 000), smoking status (current smoker, former smoker with ≥20 pack‐years, former smoker with <20 pack‐years, never smoker), sport‐related physical activity index, leisure‐time physical activity index, body mass index category (<25, 25 to <30, ≥30 kg/m2), abdominal obesity (waist‐to‐hip ratio >0.85 for females and >0.90 for males), hypercholesterolemia (yes/no), cardiovascular disease (yes/no), and time‐varying hypertension.
Discussion
In a large, community‐based cohort of middle‐aged adults, greater self‐reported adherence to a DASH‐style dietary pattern was associated with a significantly lower risk of AAA hospitalization.
The majority of the prospective epidemiological evidence for a dietary association with incident AAAs stems from studies of dietary components involving individuals from Sweden and populations in the United States.4, 7, 8, 9 Whereas in previous publications fruits as well as moderate alcohol consumption were associated with a lower risk of AAAs, vegetables did not show a consistent relationship, leaving the question open if and how a healthy dietary pattern might affect incident AAAs.7, 8, 9, 10 Current evidence suggests that the development of AAAs is driven by different pathophysiologic mechanisms that seem to be associated with tissue degradation and inflammation.2, 3 Experimental basic research studies in mice show that angiotensin II infusions which significantly raise blood pressure levels can induce AAAs by elastin fiber disruption associated with macrophage infiltration, medial rupture and thrombosis, followed by luminal expansion with adventitial and tissue remodeling.34, 35, 36 When additionally fed a high saturated fat diet, mice infused with angiotensin II experience a considerably higher risk for AAAs.37
Our results for a heart healthy dietary pattern known to lower blood pressure extend previous reports on single food items suggesting that adherence to a healthy, DASH‐style eating plan can significantly decrease AAA risk. In our community‐based study population, a diet rich in vegetables, whole grains, low‐fat dairy products, and nuts and legumes shows promising results for reducing the risk of incident AAAs. On a nutrient basis, higher saturated fat intake was related to greater risk for AAA which is in line with previous experimental data,34, 37 whereas higher dietary intake of protein and fiber consumption was associated with lower risk of AAA. On the other hand, sodium consumption, but not sodium‐to‐potassium ratio, showed a significant association with AAA risk. However, when we separately examined questions on sodium or salt intake specifically added to foods, no significant relationship with AAA risk was detected (data not shown). Given the methodological difficulties of observational studies to assess the absolute amounts of sodium consumed, the relationship between sodium consumption and AAA risk warrants further research.38
Hypertension was not a strong mediator of the observed inverse association between adherence to a DASH‐style dietary pattern and incident AAA. This underscores, on the one hand, the controversial role of hypertension in the expansion of the AAAs, while it, on the other hand, suggests the presence of other explanatory factors.6, 39 In fact, participants in a pro‐inflammatory state, reflected by CRP levels greater than 3 mg/L, tended to show a slightly stronger association between the DASH‐style dietary pattern and risk of AAA. Our epidemiological findings reinforce the basic science notion that alterations of shear stress by blood pressure elevations together with aortic wall layer break down stimulated by a pro‐inflammatory environment appear to play a key role in the pathophysiology of AAAs.
These results have both clinical and scientific implications. Rather than individual food items, a DASH‐style eating plan, which includes a variety of healthy food choices, may protect against incident AAAs. Second, this study strengthens the concept of the beneficial immuno‐modulating effects of a healthy dietary pattern on inflammatory processes.40, 41 Thus, our results, in line with current dietary recommendations on the prevention of other cardiovascular disease, provide evidence for future AAA prevention through early lifestyle intervention, based on not‐smoking and following a healthy dietary pattern.12
The strengths of our study include a large diverse, community‐based, prospective cohort with long follow‐up, structured assessment of dietary intake, assessment of and adjustment for relevant covariates, and adjudicated outcome events. Nonetheless, there are several limitations. Our exposure, food intake, was assessed in the late 1980's and mid 1990's; thus, changing dietary habits and food supply over time may not have been adequately captured by self‐reported FFQs. Furthermore, although the nutritional data derived from these FFQs have been shown to be reliable, assessing true dietary adherence to a DASH dietary pattern over time was not possible in our study setting.25 It is also likely that self‐reported adherence to DASH dietary pattern may constitute a marker for other healthy behaviours which increases the risk for residual confounding. Moreover, the use of self‐reported dietary information is affected by some degree of misclassification. Absolute amounts of consumed nutrients (in particular sodium) were likely to be underestimated because of several methodological issues including the limited number of items on the questionnaire and lack of information on food brands and snack foods.38, 42 Additionally, salt and sodium‐containing condiments were not queried. On the outcome side, no screening ultrasound for AAA was done at baseline, nor was there a clinical exam which is similar to prior analyses.7, 10 At baseline, participants were explicitly asked if they had had surgery involving the vascular system and we excluded the few participants who reported prior surgery on the aorta. Assessment of clinical AAAs after baseline was limited to hospital and death ICD codes. Although the AAA codes seem specific, we tried to enhance the validity of our AAA outcome by excluding aortic aneurysms coded to uncertain sites because they may not have been abdominal.1, 20 In this context, although the primary end point of incident AAA appears to be largely dependent on healthcare records, and thus engagement with medical services, accounting for household income did not significantly change our results. Finally, as always with observational studies, residual and unmeasured confounding could be partly responsible for the results although we adjusted our analyses for a wide range of confounding factors. Excluding current smokers at baseline did not significantly change our main results.
In conclusion, greater self‐reported adherence to a DASH dietary pattern was found to be associated with lower risk of incident AAA.
Sources of Funding
The Atherosclerosis Risk in Communities study has been funded by the National Heart, Lung, and Blood Institute, National Institutes of Health, Department of Health and Human Services, under contract numbers HHSN268201700001I, HHSN2682017000021, HHSN268201700003I, HHSN268201700004I, and HHSN268201700005I. Dr Selvin was supported by grants from the National Institutes of Health and National Institute of Diabetes and Digestive and Kidney Diseases (K24DK106414 and R01DK089174). Dr Tang was supported by a grant from the National Heart, Lung, and Blood Institute (R01 HL103695). Dr. Rebholz is supported by a mentored research scientist development award from the National Institute of Diabetes and Digestive and Kidney Diseases (K01 DK107782). Open access publishing was funded by the German Research Foundation (DFG) and the University of Würzburg.
Disclosures
None.
Supporting information
Table S1. Association of Quintiles of Food‐Based DASH Diet Score With Incident AAA Excluding Current Smokers*
Table S2. Association of Quintiles of Food‐Based DASH Diet Score With Incident AAA by Sex*
Table S3. Association of Quintiles of Nutrient Based DASH Diet Score With Incident AAA*
Table S4. Association of Individual Nutrients of the Nutrient‐Based DASH Diet Score With Risk for AAA*
Acknowledgments
The authors thank the staff and participants of the ARIC study for their important contributions. Reagents for C‐reactive protein assays were donated by Roche Diagnostics.
(J Am Heart Assoc. 2018;7:e009340 DOI: 10.1161/JAHA.118.009340.)
References
- 1. Tang W, Yao L, Roetker NS, Alonso A, Lutsey PL, Steenson CC, Lederle FA, Hunter DW, Bengtson LG, Guan W, Missov E, Folsom AR. Lifetime risk and risk factors for abdominal aortic aneurysm in a 24‐year prospective study: the ARIC Study (Atherosclerosis Risk in Communities). Arterioscler Thromb Vasc Biol. 2016;36:2468–2477. [DOI] [PMC free article] [PubMed] [Google Scholar]
- 2. Kent KC. Clinical practice. Abdominal aortic aneurysms. N Engl J Med. 2014;371:2101–2108. [DOI] [PubMed] [Google Scholar]
- 3. Aortic wall inflammation predicts abdominal aortic aneurysm expansion, rupture, and need for surgical repair. Circulation. 2017;136:787–797. [DOI] [PMC free article] [PubMed] [Google Scholar]
- 4. Wong DR, Willett WC, Rimm EB. Smoking, hypertension, alcohol consumption, and risk of abdominal aortic aneurysm in men. Am J Epidemiol. 2007;165:838–845. [DOI] [PubMed] [Google Scholar]
- 5. Forsdahl SH, Singh K, Solberg S, Jacobsen BK. Risk factors for abdominal aortic aneurysms: a 7‐year prospective study: the Tromso Study, 1994–2001. Circulation. 2009;119:2202–2208. [DOI] [PubMed] [Google Scholar]
- 6. Lu H, Daugherty A. Aortic aneurysms. Arterioscler Thromb Vasc Biol. 2017;37:e59–e65. [DOI] [PMC free article] [PubMed] [Google Scholar]
- 7. Stackelberg O, Bjorck M, Larsson SC, Orsini N, Wolk A. Fruit and vegetable consumption with risk of abdominal aortic aneurysm. Circulation. 2013;128:795–802. [DOI] [PubMed] [Google Scholar]
- 8. Stackelberg O, Bjorck M, Larsson SC, Orsini N, Wolk A. Alcohol consumption, specific alcoholic beverages, and abdominal aortic aneurysm. Circulation. 2014;130:646–652. [DOI] [PubMed] [Google Scholar]
- 9. Kent KC, Zwolak RM, Egorova NN, Riles TS, Manganaro A, Moskowitz AJ, Gelijns AC, Greco G. Analysis of risk factors for abdominal aortic aneurysm in a cohort of more than 3 million individuals. J Vasc Surg. 2010;52:539–548. [DOI] [PubMed] [Google Scholar]
- 10. Nordkvist S, Sonestedt E, Acosta S. Adherence to diet recommendations and risk of abdominal aortic aneurysm in the Malmo Diet and Cancer Study. Sci Rep. 2018;8:2017. [DOI] [PMC free article] [PubMed] [Google Scholar]
- 11. US Department of Agriculture, US Department of Health and Human Services . Dietary Guidelines for Americans 2010. Washington, DC: US Government Printing Office; 2010. [Google Scholar]
- 12. Eckel RH, Jakicic JM, Ard JD, de Jesus JM, Houston Miller N, Hubbard VS, Lee IM, Lichtenstein AH, Loria CM, Millen BE, Nonas CA, Sacks FM, Smith SC Jr , Svetkey LP, Wadden TA, Yanovski SZ, Kendall KA, Morgan LC, Trisolini MG, Velasco G, Wnek J, Anderson JL, Halperin JL, Albert NM, Bozkurt B, Brindis RG, Curtis LH, DeMets D, Hochman JS, Kovacs RJ , Ohman EM, Pressler SJ, Sellke FW, Shen WK, Tomaselli GF. 2013 AHA/ACC guideline on lifestyle management to reduce cardiovascular risk: a report of the American College of Cardiology/American Heart Association Task Force on Practice Guidelines. Circulation. 2014;129:S76–S99. [DOI] [PubMed] [Google Scholar]
- 13. Steinberg D, Bennett GG, Svetkey L. The DASH diet, 20 years later. JAMA. 2017;317:1529–1530. [DOI] [PMC free article] [PubMed] [Google Scholar]
- 14. Appel LJ, Moore TJ, Obarzanek E, Vollmer WM, Svetkey LP, Sacks FM, Bray GA, Vogt TM, Cutler JA, Windhauser MM, Lin PH, Karanja N. A clinical trial of the effects of dietary patterns on blood pressure. DASH Collaborative Research Group. N Engl J Med. 1997;336:1117–1124. [DOI] [PubMed] [Google Scholar]
- 15. Van Horn L, Carson JA, Appel LJ, Burke LE, Economos C, Karmally W, Lancaster K, Lichtenstein AH, Johnson RK, Thomas RJ, Vos M, Wylie‐Rosett J, Kris‐Etherton P. Recommended dietary pattern to achieve adherence to the American Heart Association/American College of Cardiology (AHA/ACC) guidelines: a scientific statement from the American Heart Association. Circulation. 2016;134:e505–e529. [DOI] [PubMed] [Google Scholar]
- 16. Sacks FM, Svetkey LP, Vollmer WM, Appel LJ, Bray GA, Harsha D, Obarzanek E, Conlin PR, Miller ER III, Simons‐Morton DG, Karanja N, Lin PH. Effects on blood pressure of reduced dietary sodium and the Dietary Approaches to Stop Hypertension (DASH) diet. DASH‐Sodium Collaborative Research Group. N Engl J Med. 2001;344:3–10. [DOI] [PubMed] [Google Scholar]
- 17. Rebholz CM, Crews DC, Grams ME, Steffen LM, Levey AS, Miller ER III, Appel LJ, Coresh J. DASH (Dietary Approaches to Stop Hypertension) diet and risk of subsequent kidney disease. Am J Kidney Dis. 2016;68:853–861. [DOI] [PMC free article] [PubMed] [Google Scholar]
- 18. Maruthur NM, Wang NY, Appel LJ. Lifestyle interventions reduce coronary heart disease risk: results from the PREMIER Trial. Circulation. 2009;119:2026–2031. [DOI] [PMC free article] [PubMed] [Google Scholar]
- 19. Fung TT, Chiuve SE, McCullough ML, Rexrode KM, Logroscino G, Hu FB. Adherence to a DASH‐style diet and risk of coronary heart disease and stroke in women. Arch Intern Med. 2008;168:713–720. [DOI] [PubMed] [Google Scholar]
- 20. Folsom AR, Yao L, Alonso A, Lutsey PL, Missov E, Lederle FA, Ballantyne CM, Tang W. Circulating biomarkers and abdominal aortic aneurysm incidence: the Atherosclerosis Risk in Communities (ARIC) Study. Circulation. 2015;132:578–585. [DOI] [PMC free article] [PubMed] [Google Scholar]
- 21. ARIC , Atherosclerosis Risk in Communities Study. https://www2.cscc.unc.edu/aric/desc_pub. Accessed July 10, 2018.
- 22. NIH/NHLBI , Biologic specimen and data repository information coordinating center. https://biolincc.nhlbi.nih.gov/home/. Accessed July 10, 2018. [DOI] [PMC free article] [PubMed]
- 23. The Atherosclerosis Risk in Communities (ARIC) study: design and objectives. The ARIC Investigators. Am J Epidemiol. 1989;129:687–702. [PubMed] [Google Scholar]
- 24. Willett WC, Sampson L, Stampfer MJ, Rosner B, Bain C, Witschi J, Hennekens CH, Speizer FE. Reproducibility and validity of a semiquantitative food frequency questionnaire. Am J Epidemiol. 1985;122:51–65. [DOI] [PubMed] [Google Scholar]
- 25. Stevens J, Metcalf PA, Dennis BH, Tell GS, Shimakawa T, Folsom A. Reliability of a food frequency questionnaire by ethnicity, gender, age and education. Nutr Res. 1996;16:735–745. [Google Scholar]
- 26. Hu FB, Stampfer MJ, Rimm E, Ascherio A, Rosner BA, Spiegelman D, Willett WC. Dietary fat and coronary heart disease: a comparison of approaches for adjusting for total energy intake and modeling repeated dietary measurements. Am J Epidemiol. 1999;149:531–540. [DOI] [PubMed] [Google Scholar]
- 27. Crews DC, Kuczmarski MF, Miller ER III, Zonderman AB, Evans MK, Powe NR. Dietary habits, poverty, and chronic kidney disease in an urban population. J Ren Nutr. 2015;25:103–110. [DOI] [PMC free article] [PubMed] [Google Scholar]
- 28. Mellen PB, Gao SK, Vitolins MZ, Goff DC Jr. Deteriorating dietary habits among adults with hypertension: DASH dietary accordance, NHANES 1988–1994 and 1999–2004. Arch Intern Med. 2008;168:308–314. [DOI] [PubMed] [Google Scholar]
- 29. Powell‐Wiley TM, Miller PE, Agyemang P, Agurs‐Collins T, Reedy J. Perceived and objective diet quality in us adults: a cross‐sectional analysis of the National Health and Nutrition Examination Survey (NHANES). Public Health Nutr. 2014;17:2641–2649. [DOI] [PMC free article] [PubMed] [Google Scholar]
- 30. George SM, Ballard‐Barbash R, Manson JE, Reedy J, Shikany JM, Subar AF, Tinker LF, Vitolins M, Neuhouser ML. Comparing indices of diet quality with chronic disease mortality risk in postmenopausal women in the Women's Health Initiative Observational Study: evidence to inform national dietary guidance. Am J Epidemiol. 2014;180:616–625. [DOI] [PMC free article] [PubMed] [Google Scholar]
- 31. White AD, Folsom AR, Chambless LE, Sharret AR, Yang K, Conwill D, Higgins M, Williams OD, Tyroler HA. Community surveillance of coronary heart disease in the Atherosclerosis Risk in Communities (ARIC) Study: methods and initial two years’ experience. J Clin Epidemiol. 1996;49:223–233. [DOI] [PubMed] [Google Scholar]
- 32. Richardson MT, Ainsworth BE, Wu HC, Jacobs DR Jr, Leon AS. Ability of the Atherosclerosis Risk in Communities (ARIC)/Baecke Questionnaire to assess leisure‐time physical activity. Int J Epidemiol. 1995;24:685–693. [DOI] [PubMed] [Google Scholar]
- 33. Parrinello CM, Lutsey PL, Ballantyne CM, Folsom AR, Pankow JS, Selvin E. Six‐year change in high‐sensitivity C‐reactive protein and risk of diabetes, cardiovascular disease, and mortality. Am Heart J. 2015;170:380–389. [DOI] [PMC free article] [PubMed] [Google Scholar]
- 34. Daugherty A, Manning MW, Cassis LA. Angiotensin II promotes atherosclerotic lesions and aneurysms in apolipoprotein E‐deficient mice. J Clin Invest. 2000;105:1605–1612. [DOI] [PMC free article] [PubMed] [Google Scholar]
- 35. Liu J, Daugherty A, Lu H. Angiotensin II and abdominal aortic aneurysms: an update. Curr Pharm Des. 2015;21:4035–4048. [DOI] [PubMed] [Google Scholar]
- 36. Daugherty A, Cassis LA, Lu H. Complex pathologies of angiotensin II‐induced abdominal aortic aneurysms. J Zhejiang Univ Sci B. 2011;12:624–628. [DOI] [PMC free article] [PubMed] [Google Scholar]
- 37. Police SB, Thatcher SE, Charnigo R, Daugherty A, Cassis LA. Obesity promotes inflammation in periaortic adipose tissue and angiotensin II‐induced abdominal aortic aneurysm formation. Arterioscler Thromb Vasc Biol. 2009;29:1458–1464. [DOI] [PMC free article] [PubMed] [Google Scholar]
- 38. Cobb LK, Anderson CA, Elliott P, Hu FB, Liu K, Neaton JD, Whelton PK, Woodward M, Appel LJ. Methodological issues in cohort studies that relate sodium intake to cardiovascular disease outcomes: a science advisory from the American Heart Association. Circulation. 2014;129:1173–1186. [DOI] [PubMed] [Google Scholar]
- 39. Takagi H, Umemoto T. Association of hypertension with abdominal aortic aneurysm expansion. Ann Vasc Surg. 2017;39:74–89. [DOI] [PubMed] [Google Scholar]
- 40. Lopez‐Garcia E, Hu FB. Nutrition and the endothelium. Curr Diab Rep. 2004;4:253–259. [DOI] [PubMed] [Google Scholar]
- 41. Lopez‐Garcia E, Schulze MB, Fung TT, Meigs JB, Rifai N, Manson JE, Hu FB. Major dietary patterns are related to plasma concentrations of markers of inflammation and endothelial dysfunction. Am J Clin Nutr. 2004;80:1029–1035. [DOI] [PubMed] [Google Scholar]
- 42. Freedman LS, Commins JM, Moler JE, Willett W, Tinker LF, Subar AF, Spiegelman D, Rhodes D, Potischman N, Neuhouser ML, Moshfegh AJ, Kipnis V, Arab L, Prentice RL. Pooled results from 5 validation studies of dietary self‐report instruments using recovery biomarkers for potassium and sodium intake. Am J Epidemiol. 2015;181:473–487. [DOI] [PMC free article] [PubMed] [Google Scholar]
Associated Data
This section collects any data citations, data availability statements, or supplementary materials included in this article.
Supplementary Materials
Table S1. Association of Quintiles of Food‐Based DASH Diet Score With Incident AAA Excluding Current Smokers*
Table S2. Association of Quintiles of Food‐Based DASH Diet Score With Incident AAA by Sex*
Table S3. Association of Quintiles of Nutrient Based DASH Diet Score With Incident AAA*
Table S4. Association of Individual Nutrients of the Nutrient‐Based DASH Diet Score With Risk for AAA*