

Abstract
Background
Current evaluation about the relationship of sequential change in estimated glomerular filtration rate (eGFR) and clinical outcomes are still inconsistent. We aimed to investigate the association between the change in kidney function over time and the risk of all‐cause mortality and cardiovascular disease.
Methods and Results
This prospective cohort including 37 691 participants aged ≥45 years used data from the Kailuan Health Registry. The relationship of the annual percentage and absolute change in eGFR and outcomes were analyzed with Cox proportional regression. The participants were stratified according to the quintiles distribution of the percentage annual change in eGFR (Q1–Q5). After adjusting for baseline covariates including initial eGFR, participants with annual eGFR decline were at significantly greater risk for all‐cause mortality (Q1: hazard ratio, 1.22 [95% confidence interval, 1.04–1.43]; Q2: 1.19 [1.01–1.40]) than noted for patients in Q3. Cardiovascular disease risk was also significantly higher in participants with annual eGFR decline (Q1 and Q2). No significantly increased risk of adverse outcomes was noted for patients with annual eGFR increased groups (Q4 and Q5). When considering the absolute eGFR annual change rate (no/mild/rapid decline), we obtained similar results in chronic kidney disease participants, whereas non–chronic kidney disease participants had less pronounced association of eGFR decline with cardiovascular disease, though not with mortality.
Conclusions
A decline in eGFR over time is associated with higher risk for all‐cause mortality and cardiovascular disease independent of initial eGFR and other known risk factors at baseline. Our data support the serial evaluation of change in kidney function as a better prognostic indicator than single eGFR assessments.
Keywords: chronic kidney disease, creatinine, glomerular filtration rate, mortality
Subject Categories: Quality and Outcomes, Complications
Clinical Perspective
What Is New?
In this prospective cohort analysis based on the Kailuan study, we found that participants with annual estimated glomerular filtration rate (eGFR) decline had a significantly higher risk of all‐cause mortality and cardiovascular events even after adjustment for baseline covariates including the initial eGFR.
While some studies have reported a U‐shaped association between eGFR change and mortality, we found no association between eGFR increase and mortality or cardiovascular disease, as an accurate eGFR equation was applied and data pertaining to a very large sample representative of the general community‐dwelling Chinese population aged ≥45 years indicate that our present conclusions are likely more accurate and provide more confidence of evidence than currently available.
What Are the Clinical Implications?
We believe that our study makes a significant contribution to the literature because data from this population‐based prospective cohort study support the relevance of eGFR decline over time as a predictor of adverse outcomes, and moreover extend the applicability of this finding in a different ethnic population.
We also believe that this article will be beneficial to the ongoing controversy regarding the usefulness of serial eGFR measurements as prognostic predictors.
Chronic kidney disease (CKD) has become a major public health problem with growing prevalence and poor outcomes. The prevalence of CKD among the adult population was estimated at 10.8% in China.1, 2, 3 Current international guidelines define CKD as an estimated glomerular filtration rate (eGFR) <60 mL/min per 1.73 m2 and/or the presence of kidney damage markers such as albuminuria for at least 3 months.4 Previous studies have consistently demonstrated that CKD is a strong independent risk factor for all‐cause mortality and cardiovascular disease (CVD).5, 6
However, clinicians gradually noticed that eGFR can vary widely over time, which has a negative influence on the predictive power of single eGFR measurements for future clinical outcomes.7 To address this limitation and improve risk stratification in CKD patients, research effort focused on exploring the relationship between sequential changes in eGFR and future adverse outcomes. Most investigations on this topic concluded that kidney function decline over time is associated with adverse outcomes.8, 9, 10 In a recent study of data collected by the Alberta Kidney Disease Network, Turin et al11 reported a U‐shaped association between longitudinal changes in eGFR and all‐cause mortality in a community‐based cohort from Canada. Although that was the largest such study among community dwellers, the concept of a U‐shaped relationship between eGFR changes and mortality is not entirely new. Matsushita et al12 reported similar findings in the ARIC (Atherosclerosis Risk in Communities) cohort, which included 13 029 black or white community dwellers, and speculated that the shape of the association between eGFR changes and mortality may be influenced by lower serum creatinine generation as a result of reduced muscle mass, recovery from an episode of acute kidney injury, or hyperfiltration in very early‐stage diabetic nephropathy. Currently, it is believed that the U‐shaped association between change in eGFR and death is logical and hypothesis generating but should be confirmed using validated eGFR calculation methods.7, 10
Based on those inconsistent results, we aimed to clarify the association between the change of kidney function over time and the risk of all‐cause mortality and CVD in our study. We investigated the percentage and absolute annual change in eGFR as predictors of mortality and CVD in a large population‐based cohort from the Kailuan communities in China. We hypothesized that the sequential change in kidney function among these middle‐aged and elderly participants would be associated with elevated risk for all‐cause mortality and CVD.
Methods
The data, analytic methods, and study materials will be available to other researchers for purposes of reproducing the results or replicating the procedure on request from the corresponding authors.
Data Source and Study Design
The present study was based on healthcare data from the Kailuan Health and Wellness Registry (trial registration number: ChiCTR‐TNRC‐11001489, retrospectively registered), which was started in 2006. At the time of our study, the registry included data on 101 510 participants (81 110 men and 20 400 women), aged 18 to 98 years. All participants were prospectively registered and followed up biennially to collect data on potential risk factors and newly diagnosed diseases.
In the present study, we collected de‐identified secondary data (registry and claims) including demographics such as age, sex, and education background; medical history such as smoking, drinking, hypertension, diabetes mellitus, myocardial infarction (MI), and heart failure; and the results of physical and laboratory examinations conducted during ambulatory and inpatient visits, with disease information coded according to the International Classification of Diseases, Ninth Revision, and Clinical Modification (ICD‐9‐CM).13, 14 The study protocol was approved by the Ethics Committee of both Kailuan General Hospital and Beijing Shijitan Hospital. All Kailuan cohort participants provided informed consent to have their data collected and stored for research purposes. The requirement for informed consent for inclusion in the present study was waived because only de‐identified information was used in this study.
We conducted a population‐based prospective cohort study including 37 691 participants living in the Kailuan communities of Hebei province, China. From January 5, 2008 to December 31, 2009, an initial 72 659 men and women were recruited in this study. During their biennial physical examination, blood samples were drawn from 2008 to 2009 (baseline/visit 1) and from 2010 to 2011 (visit 2). We excluded 37 806 participants younger than 45 years old, 676 participants missing eGFR data at the time of visit 1 or visit 2, 42 participants with history of dialysis or transplant, and 44 participants with a baseline eGFR rate <15 mL/min per 1.73 m2. The final number of transplant, and 44 participants with a baseline estimated eGFR <15 mL/min per 1.73 m2. Finally, 37 691 participants were included in the analysis (Figure 1). These participants were followed up for CVD until December 31, 2015 and for all‐cause mortality until December 31, 2016. The timeline of this study is illustrated in Figure 2.
Figure 1.
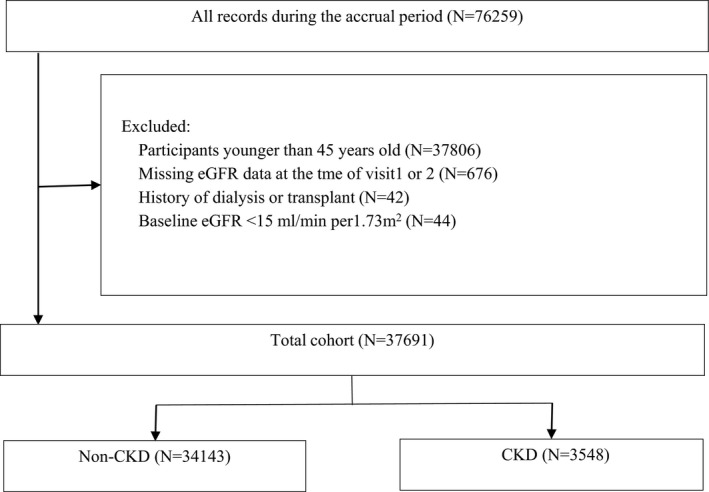
Overview of cohort creation. CKD indicates chronic kidney disease; eGFR, estimated glomerular filtration rate.
Figure 2.
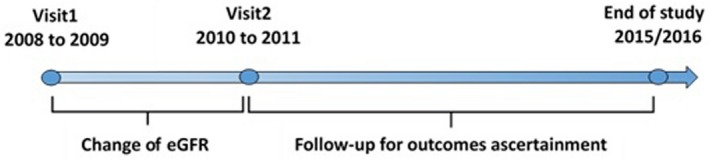
Timeline of this study. eGFR indicates estimated glomerular filtration rate.
Predictor Variables
As the primary predictor, the magnitude of change in eGFR was described using 2 indices: the percentage annual change and the absolute annual change rate.
The percentage annual change was calculated using the following formula:
The absolute annual change rate was calculated using the following formula:
Serum creatinine (SCr) levels, which were used to calculate eGFR, were measured by means of an enzymatic method using a Hitachi 7600 P auto‐analyzer (Hitachi, Tokyo, Japan). We calculated eGFR using a modified 4‐variable Chronic Kidney Disease Epidemiology Collaboration (CKD‐EPI) formula with an adjusted coefficient of 1.1 for the Chinese population15, 16:
where κ was 0.7 for females and 0.9 for males, α was −0.329 for females and −0.411 for males, min (SCr/κ,1) was the minimum value between SCr/κ and 1, and max (SCr/κ,1) was the maximum value between SCr/κ and 1.
Covariates
Sociodemographic, physical examination, and laboratory examination data collected during the baseline visit were included as covariates. A trained interviewer collected data on sociodemographic characteristics and medical history. Anthropometric measures such as height, weight, waist circumference, and standardized blood pressure (BP) measurements were conducted. Hypertension was defined as systolic BP >140 mm Hg, diastolic BP >90 mm Hg, or self‐reported use of antihypertensive medications. Diabetes mellitus was defined as fasting glucose levels >126 mg/dL on 1 occasion, random glucose levels >200 mg/dL, or use of insulin or other antidiabetic medication. MI was defined from hospital records by the clinical history of cardiac symptoms, cardiac enzymes, and serial ECG changes. For the diagnosis of incident heart failure, a physician's diagnosis was followed by a review of the participant's medical records; the CHS Cardiovascular Events Committee based the diagnosis on physician report, as well as consideration of symptoms, signs, chest radiograph findings, and treatment of heart failure. Blood samples were processed and analyzed using an auto‐analyzer (Hitachi 747; Hitachi) in the central laboratory of Kailuan General Hospital. In addition to SCr, the following were evaluated: total cholesterol, low‐density lipoprotein cholesterol, high‐density lipoprotein cholesterol, triglycerides, and other CVD risk markers (ie, C‐reactive protein). Urine protein levels were obtained using automated dipstick urinalysis (DIRUI H12‐MA or N‐600) and quantified as none/trace, 1+, 2+, 3+, or 4+. Proteinuria was defined as a dipstick result of 1+ or greater. For the multivariate models, BP was included both as a categorical variable (hypertension: yes/no) and as a continuous variable (baseline systolic BP and diastolic BP readings).13
Outcomes
The main outcomes included all‐cause mortality and CVD events. The CVD outcome was defined as a composite of definite or probable MI, hemorrhagic stroke, ischemic stroke, and subarachnoid hemorrhage events. Mortality data were collected from provincial vital statistics offices. Information on physician‐diagnosed CVD events was collected during the ongoing biennial interviews. To further identify potential CVD events, we also investigated discharge lists from the 11 hospitals participating in the Kailuan study. According to the World Health Organization criteria, MI was diagnosed based on a clinical history of cardiac symptoms, cardiac enzyme levels, and changes on serial ECGs; stroke was diagnosed based on characteristic signs, symptoms, and brain computed tomography or magnetic resonance imaging findings.17 The study participants were followed up from the time of entry until occurrence of an outcome event or until they were censored because of death, loss to follow‐up, or the end of the study period, which was defined as December 31, 2015 for CVD and as December 31, 2016 for all‐cause mortality.
Statistical Analysis
Baseline characteristics are presented in terms of descriptive statistics, with mean±SD or median (interquartile range) given for continuous variables, and percentages given for categorical variables.
Because the absolute eGFR annual change rate may not accurately reflect the clinical relevance of the magnitude of change in individuals with lower or higher baseline eGFR, we first stratified the participants according to the quintiles of the distribution of values for the percentage annual change in eGFR (Q1, strong decline; Q2, mild decline; Q3, almost no change; Q4, mild increase; Q5, strong increase). The statistical significance of linear trends between outcomes and participant characteristics was tested for each quintile using linear regression for continuous variables and logistic regression for dichotomous variables. Survival analysis in each quintile was conducted using Kaplan–Meier curves. Multivariable Cox proportional hazards regression analysis was conducted to calculate the relative risks for the outcomes of interest according to the annual change in eGFR levels, with Q3 used as the reference group under the assumption that Q4 and Q5 may include individuals with an increase in eGFR as a result of SCr decrease potentially associated with ill health. The results are presented as hazard ratios with 95% confidence intervals (CIs).
We also performed a sensitivity analysis to validate the stability of our study findings. In the first sensitivity analysis, we stratified the participants of each group from Q1 to Q5 into CKD (baseline eGFR <60 mL/min per 1.73 m2 and/or who were determined to have proteinuria at entry based on urine dipstick results and quantified as 1+, 2+, 3+, or 4+) and non‐CKD (eGFR ≥60 mL/min per 1.73 m2 and proteinuria negative) groups. We repeated the analysis by using the group with stable eGFR and no CKD (no CKD in Q3 group) as the reference group. In the second sensitivity analysis, we used the absolute annual change rate (instead of the percentage annual change) to describe the magnitude of change in eGFR. According to the Kidney Disease Outcomes Quality Initiative clinical practice guidelines, we categorized changes in eGFR as no decline (>0 mL/min per 1.73 m2/y; reference group), mild decline (−4 to 0 mL/min per 1.73 m2/y), and rapid decline (< −4 mL/min per 1.73 m2/y). Additionally, we stratified the participants according to CKD incidence at baseline. Specifically, the CKD group included participants with baseline eGFR <60 mL/min per 1.73 m2 and/or proteinuria (urine dipstick result 1+ or above). Participants with baseline eGFR ≥60 mL/min per 1.73 m2 and no proteinuria were included in the non‐CKD group. Multivariable Cox proportional hazards regression analysis was conducted to quantify the risk associated with absolute annual eGFR decline and presence of CKD, with the subgroup having neither CKD nor eGFR decline considered as reference. All Cox proportional hazards models were adjusted for covariates (baseline values) and tested for the interactions between eGFRvisit 1, eGFRvisit 2, and change in eGFR for each outcome by incorporating their product terms in the models.
All statistical tests were evaluated using 2‐tailed 95% CIs. Analyses were performed using Stata version 14.2 (STATA, College Station, TX). P values <0.05 were considered to indicate statistical significance.
Results
Of the 37 691 participants who met all inclusion criteria and no exclusion criteria, 2.89% (n=1089) showed stable kidney function, 48.62% (n=18 326) showed a decline in kidney function, and 48.49% (n=18 276) showed an increase in kidney function between the baseline and follow‐up visits. The distribution of values of the percentage annual change in eGFR appeared normal and centered near 0 (Figure 3). In the overall cohort, the mean percentage annual change was −1.20%/y (SD, 10.84%/y), with a median of −0.47%/y (interquartile range, −3.85% to 3.33%/y). The cutoff points for the quintiles of percentage annual change in eGFR were −5.08, −1.02, 1.16, and 5.34%/y.
Figure 3.
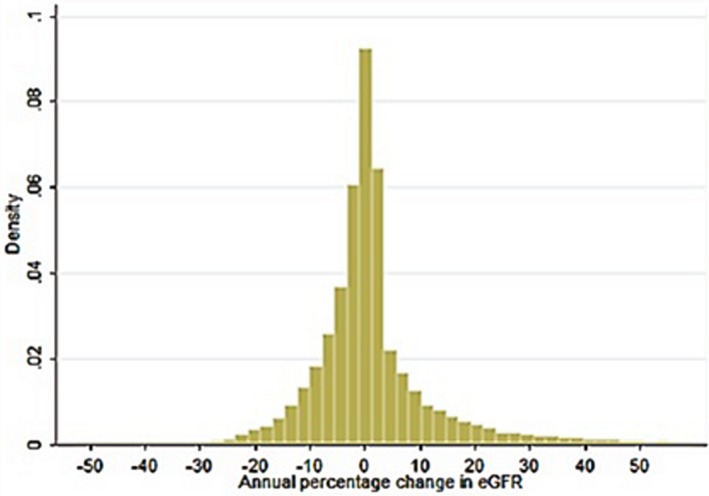
Distribution of percentage annual change in eGFR on the basis of 2‐y change among 37 691 participants of the Kailuan study. Cutoff points of quintiles of percentage annual change in eGFR were −5.08, −1.02, 1.16, and 5.34%/y. eGFR indicates estimated glomerular filtration rate.
The baseline characteristics of the 37 691 participants stratified according to the quintiles of the distribution of values of percentage annual change in eGFR are summarized in Table 1. Compared with participants with no change in eGFR levels (Q3), those with eGFR decline (Q1 and Q2) were slightly older at baseline and more likely to be male. Additionally, the incidence of tobacco use, history of hypertension, MI (%), heart failure (%), and diabetes mellitus was higher in Q1 and in Q2 than in Q3. Finally, systolic BP, diastolic BP, waist circumference, and serum levels of low‐density lipoprotein cholesterol, triglycerides, and C‐reactive protein were higher, whereas the alcohol intake and education level were lower in Q1 and in Q2 than in Q3.
Table 1.
Characteristics at Baseline of Participants According to Quintiles of Percentage Change in eGFR From Visit 1 to Visit 2
| Characteristic | Quintiles of Percentage Annual Change in eGFR (Percent/Year) | P Value for Trend | ||||
|---|---|---|---|---|---|---|
| Q1 (−52.78 to −5.08) n=7539 | Q2 (−5.08 to −1.02) n=7538 | Q3 (−1.02 to 1.16) n=7538 | Q4 (1.16–5.34) n=7538 | Q5 (5.34–59.99) n=7538 | ||
| Demographics | ||||||
| Age (y), mean±SD | 58.77±9.92 | 57.28±8.93 | 56.74±8.59 | 56.63±8.77 | 56.56±8.77 | <0.0001 |
| Age range, y | 45–89 | 45–90 | 45–94 | 45–87 | 45–91 | |
| Male sex, % | 79.88 | 80.43 | 74.69 | 78.91 | 80.05 | <0.001 |
| Education level, % | <0.001 | |||||
| ≤9 y, % | 81.36 | 80.92 | 76.90 | 77.37 | 80.78 | |
| >9 y, % | 15.13 | 17.03 | 20.97 | 20.38 | 18.19 | |
| Clinical history | ||||||
| Tobacco use, % | 45.60 | 44.53 | 43.45 | 38.17 | 42.96 | <0.001 |
| Alcohol intake, % | 35.88 | 42.72 | 43.78 | 45.57 | 42.85 | <0.001 |
| Hypertension, % | 19.26 | 19.37 | 17.55 | 18.13 | 18.48 | <0.001 |
| Diabetes mellitus, % | 6.49 | 6.31 | 6.00 | 5.80 | 6.14 | <0.001 |
| Myocardial infarction, % | 2.12 | 2.04 | 2.01 | 2.11 | 2.06 | <0.001 |
| Heart failure, % | 3.34 | 3.41 | 3.12 | 2.88 | 2.91 | <0.001 |
| Waist circumference (cm), mean±SD | 88.26±10.43 | 88.34±9.95 | 87.97±9.61 | 88.06±9.60 | 87.62±9.60 | 0.0002 |
| SBP (mm Hg), mean±SD | 136.15±21.42 | 133.88±20.46 | 132.07±19.93 | 132.53±19.69 | 133.62±19.94 | <0.0001 |
| DBP (mm Hg), mean±SD | 86.01±11.70 | 85.43±11.54 | 84.89±11.22 | 85.24±11.28 | 85.64±11.22 | <0.0001 |
| LDL cholesterol (mmol/L), mean±SD | 2.86±0.81 | 2.73±0.77 | 2.64±0.75 | 2.64±0.73 | 2.81±0.74 | <0.0001 |
| HDL cholesterol (mmol/L), mean±SD | 2.04±0.25 | 2.05±0.31 | 2.04±0.20 | 2.03±0.19 | 2.03±0.22 | <0.0001 |
| TG (mmol/L), median [IQR] | 1.29 (0.88) | 1.26 (0.97) | 1.26 (0.99) | 1.30 (1.02) | 1.32 (0.96) | 0.0004 |
| TC (mmol/L), median [IQR] | 5.01 (1.17) | 4.98 (1.24) | 5.00 (1.23) | 4.99 (1.26) | 4.99 (1.14) | 0.0005 |
| CRP (mg/L), mean±SD | 4.00±5.97 | 3.41±5.48 | 3.10±5.02 | 3.25±5.41 | 3.89±7.19 | <0.0001 |
| Urine protein positive, % | 8.62 | 7.96 | 7.39 | 7.28 | 8.01 | <0.0001 |
| eGFRvisit 1 (mL/min per 1.73 m2), mean±SD | 89.59±16.05 | 90.80±16.38 | 92.81±14.97 | 87.61±16.07 | 69.53±14.22 | <0.0001 |
| eGFRvisit 2 (mL/min per 1.73 m2), mean±SD | 71.07±15.20 | 85.96±15.79 | 92.97±15.01 | 92.06±16.71 | 90.27±15.40 | <0.0001 |
Missing values (number missing): age, 0; sex, 0; education level, 226; tobacco use, 226; alcohol intake, 223; hypertension, 215; diabetes mellitus, 284; myocardial infarction, 189; heart failure, 211; waist circumference, 398; SBP, 269; DBP, 269; LDL, 40; HDL, 21; TG, 15; TC, 26; CRP, 287; urine protein positive, 324; eGFRvisit 1, 0; eGFRvisit 2, 0. CRP indicates C‐reactive protein; DBP, diastolic blood pressure; eGFR, estimated glomerular filtration rate; HDL, high‐density lipoprotein; IQR, interquartile range; LDL, low‐density lipoprotein; SBP, systolic blood pressure; TC, total cholesterol; TG, triglycerides.
The median follow‐up duration was 5.95 years (5.80±1.13 years) for all‐cause mortality and 4.96 years (4.72±0.97 years) for CVD. During follow‐up, 1995 participants died and 1279 experienced CVD events. The overall incident rates of all‐cause mortality and CVD were 9.12 and 7.12 per 1000 person‐years, respectively. The characteristics of participants who died and ascertained as having CVD during the follow‐up are shown in Table S1.
The relationship of percentage annual change in eGFR with the risk of all‐cause mortality and CVD events is summarized in Table 2. Compared with no change in eGFR (Q3), both strong decline (Q1) and mild decline (Q2) were associated with higher adjusted hazard ratios for all‐cause mortality (1.22 [95% CI, 1.04–1.43] and 1.19 [95% CI, 1.01–1.40], respectively) and for CVD events (1.28 [95% CI, 1.11–1.48] and 1.16 [95% CI, 1.00–1.34], respectively). On survival curve analysis considering the survival among participants from Q3 as reference, participants in Q1 and Q2 had significantly lower probability of survival free from all‐cause mortality and CVD, whereas no such trend was noted for participants in Q4 and Q5 (Figure 4).
Table 2.
Adjusted HRs (95% CIs) of CVD and All‐Cause Mortality by Quintiles of Percentage Annual Change in eGFR From Visit 1 to Visit 2
| Outcomes | Quintiles of Percentage Annual Change in eGFR (Percent/Year) | ||||
|---|---|---|---|---|---|
| Q1 (−52.78 to −5.08) | Q2 (−5.07 to −1.02) | Q3 (−1.03 to 1.16) | Q4 (1.16–5.34) | Q5 (5.34–59.99) | |
| All‐cause mortality | |||||
| Na | 6988 | 7226 | 6804 | 6957 | 7171 |
| Multivariate adjusted HR | 1.22 (1.04–1.43) | 1.19 (1.01–1.40) | Reference | 1.01 (0.85–1.20) | 0.90 (0.75–1.07) |
| CVD | |||||
| Na | 6936 | 7106 | 6897 | 6846 | 7264 |
| Multivariate adjusted HR | 1.28 (1.11–1.48) | 1.16 (1.00–1.34) | Reference | 0.86 (0.70–1.05) | 0.95 (0.77–1.17) |
Using Cox regression adjusting for the following covariates at baseline: age, sex, education level, tobacco use, alcohol intake, hypertension, diabetes mellitus, waist circumference, SBP, DBP, LDL, HDL, TG, TC, CRP, Urine protein positive and eGFR. CI indicates confidence interval; CRP, C‐reactive protein; CVD, cardiovascular disease; DBP, diastolic blood pressure; eGFR, estimated glomerular filtration rate; HDL, high‐density lipoprotein; HR, hazard ratio; LDL, low‐density lipoprotein; SBP, systolic blood pressure; TC, total cholesterol; TG, triglycerides.
Participants included in the fully adjusted analysis.
Figure 4.
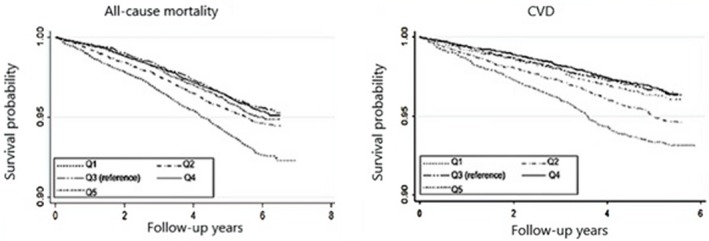
Kaplan–Meier survival curves for all‐causes mortality and CVD based on quintiles of percentage annual change in eGFR from visit 1 to visit 2. CVD indicates cardiovascular disease; eGFR, estimated glomerular filtration rate.
We also stratified the participants of each group from Q1 to Q5 into CKD and no CKD groups and generated the analysis of the joint associations of percentage annual change in eGFR and CKD status with all‐cause mortality and CVD events, and found that the association was slightly affected but still present. Q1 and Q2 were still significantly associated with higher risks of all‐cause mortality and CVD events (Table 3).
Table 3.
Joint Associations of Percentage Annual Change in eGFR and CKD Status With All‐Cause Mortality and CVD Events
| Outcomes | Quintiles of Percentage Annual Change in eGFR (Percent/Year) | Interaction P Valuea | ||||||||||
|---|---|---|---|---|---|---|---|---|---|---|---|---|
| Q1 (−52.78 to −5.08) | Q2 (−5.07 to −1.02) | Q3 (−1.03 to 1.16) | Q4 (1.16–5.34) | Q5 (5.34–59.99) | ||||||||
| No CKD | CKD | No CKD | CKD | No CKD | CKD | No CKD | CKD | No CKD | CKD | Visit 1 | Visit 2 | |
| All‐cause mortality | ||||||||||||
| Nb | 6092 | 896 | 6469 | 797 | 6130 | 674 | 6404 | 553 | 6609 | 562 | ||
| HR (95%CI) | 1.21 (1.04–1.41) | 1.32 (1.07–1.60) | 1.04 (1.00–1.10) | 1.08 (1.02–1.17) | Reference | 1.02 (0.81–1.30) | 0.98 (0.90–1.20) | 0.87 (0.72–1.06) | 1.02 (0.83–1.20) | 0.91 (0.76–1.09) | 0.74 | 0.44 |
| CVD | ||||||||||||
| Nb | 6043 | 893 | 6319 | 787 | 6221 | 676 | 6296 | 550 | 6699 | 565 | ||
| HR (95%CI) | 1.18 (1.05–1.36) | 1.29 (1.11–1.49) | 0.88 (0.72–1.07) | 1.05 (1.01–1.11) | Reference | 1.09 (0.94–1.32) | 0.87 (0.70–1.11) | 0.76 (0.70–1.02) | 0.97 (0.71–1.23) | 0.94 (0.76–1.21) | 0.23 | 0.45 |
CI indicates confidence interval; CKD, chronic kidney disease; CVD, cardiovascular disease; eGFR, estimated glomerular filtration rate; HR, hazard ratio.
Interactions between eGFRvisit 1, eGFRvisit 2 and change in kidney function were evaluated for each outcome, respectively.
Participants included in the fully adjusted analysis.
The results of the sensitivity analysis based on absolute annual change in eGFR (no versus mild versus rapid decline) and CKD incidence (CKD versus non‐CKD) are summarized in Table 4. Overall, participants who had either CKD or eGFR decline had higher rates of all‐cause mortality and CVD events compared with those noted among participants with neither CKD nor eGFR decline. Rapidly declining kidney function was independently associated with higher risk even among participants without CKD. On multivariate analysis, no significant interactions were observed between kidney function decline and baseline or follow‐up eGFR for either outcome.
Table 4.
Joint Associations of Kidney Function Decline and CKD Status With All‐Cause Mortality and CVD Events
| Outcomes | Absolute Annual Change in eGFR (mL/min per 1.73 m2/Year) | Interaction P Valuea | ||||||
|---|---|---|---|---|---|---|---|---|
| No CKD | CKD | |||||||
| No Decline (≥0) | Mild Decline (−4 to 0) | Rapid Decline (< −4) | No Decline (≥0) | Mild Decline (−4 to 0) | Rapid Decline (< −4) | Visit 1 | Visit 2 | |
| n=15 936 | n=10 286 | n=7921 | n=2716 | n=610 | n=222 | |||
| All‐cause mortality | Reference | 1.16 (1.02–1.33) | 1.21 (1.06–1.39) | 0.94 (0.76–1.15) | 1.24 (1.05–1.53) | 1.26 (1.08–1.61) | 0.96 | 0.67 |
| CVD | Reference | 1.00 (0.85–1.17) | 1.16 (1.04–1.30) | 1.07 (0.83–1.38) | 1.06 (1.01–1.12) | 1.28 (1.02–1.63) | 0.11 | 0.68 |
Data are presented as HR (95% CI). CI indicates confidence interval; CKD, chronic kidney disease; CVD, cardiovascular disease; eGFR, estimated glomerular filtration rate; HR, hazard ratio.
Interactions between eGFRvisit 1, eGFRvisit 2 and change in kidney function were evaluated for each outcome, respectively.
Discussion
In this prospective cohort analysis based on the Kailuan study, we found that participants with eGFR decline (Q1 and Q2) had a significantly higher risk of all‐cause mortality and CVD even after adjustment for baseline covariates including initial eGFR; on the other hand, an increase in eGFR (Q4 and Q5) was not associated with adverse outcomes. Furthermore, our sensitivity analyses indicated that the association between kidney function decline and adverse outcomes remained consistent when the magnitude of change in kidney function was expressed as the percentage and absolute annual change in eGFR and participants were stratified according to CKD and non‐CKD at baseline. On the whole, our findings in this population‐representative cohort of middle‐aged and older Chinese adults supports the predictive value of sequential eGFR measurements, with eGFR decline indicating increased risk of adverse outcomes even among individuals with mild change in eGFR.
Several previous studies have demonstrated that eGFR decline over time is an independent risk factor for all‐cause mortality and CVD.18, 19, 20 Rifkin et al21 demonstrated that a rapid annual decrease in eGFR (>3 mL/min per 1.73 m2) was associated with a higher risk for all‐cause and CVD‐related mortality in elderly adults followed up for 3 to 7 years. Cheng et al22 confirmed these findings in a cohort of 17 026 middle‐aged Taiwanese participants, reporting that an eGFR decline of at least 20% over 18 months was associated with a 2.5‐fold increase in the risk of CVD‐related mortality (adjusted hazard ratio, 2.48; 95% CI, 1.58–3.89) and a 1.5‐fold increase in the risk of death within 15 years (adjusted hazard ratio, 1.45; 95% CI, 1.13–1.86). In our large population‐based cohort of Chinese community dwellers, we found that strong and mild eGFR decline, respectively, was associated with 22% and 19% increase in all‐cause mortality, as well as 28% and 16% increase in the incidence of CVD events within ≈6 years. It is important to note that we used the CKD‐EPI formula to estimate eGFR, as the Modification of Diet in Renal Disease equation has been proven to underestimate GFR, especially among individuals with normal kidney function.8 Because our data were derived using the CKD‐EPI equation, the conclusions of our analysis are likely more accurate and provide more confidence in the evidence. Meanwhile, our sensitivity analysis also indicated that any eGFR decline (mild or rapid) is associated with significantly increased risk of all‐cause mortality and CVD regardless of CKD incidence. Thus, taken in the context of current knowledge, our data from this population‐based prospective cohort study support the relevance of eGFR decline over time as a predictor of adverse outcomes, and moreover extend the applicability of this finding in a different ethnic population.
The mechanisms by which kidney function decline contributes to adverse outcomes are not fully understood. Studies showed that declining eGFR may be implicated with aggravating CVD risk factors, endothelial dysfunction, oxidative stress, and vascular damage, as well as with the activation of the renin‐angiotensin system.23, 24, 25 In addition, a gradually decreasing kidney function may lead to decreased appetite, loss of lean body mass, and reduced physical function, thus indirectly contributing to a higher mortality risk among these individuals.26, 27
We also evaluated the relationship of sequential increase in eGFR (Q4 and Q5) with clinical outcomes, but found no significant increase in the risk of all‐cause mortality and CVD among these individuals. Although the clinical relevance of sequential increase in eGFR has received great attention in recent years, results have been controversial.7 Matsushita et al12 analyzed data regarding 13 029 participants in the ARIC Study and were the first to report a U‐shaped association between the annualized change in eGFR and all‐cause mortality. More recently, Perkins et al28 analyzed data regarding 15 465 participants with stage 3 to 4 CKD and reported similar results. However, it remains unclear why increasing eGFR over time would be associated with mortality. It is speculated that this may be because of lower SCr generation as a result of reduced muscle mass associated with chronic debilitating conditions, during recovery from an undetected episode of acute kidney injury, or during withdrawal of certain renoprotective medications such as renin‐angiotensin‐aldosterone system blockers. Hyperfiltration observed in very early‐stage diabetic nephropathy could also account for an increase in risk with increasing eGFR.7, 10, 29 We did not find a U‐shaped association between the annualized change in eGFR and all‐cause mortality. Unlike the studies that reported a U‐shaped relationship, our study did not focus on patients with CKD and instead used a population‐based cohort recruited from among community‐dwelling individuals undergoing routine health examinations; furthermore, we used the CKD‐EPI instead of the Modification of Diet in Renal Disease equation to calculate eGFR. Future studies should use more accurate eGFR calculation approaches for evaluating the relationship between mortality and change in kidney function.
Our study has several limitations. First, although the CKD‐EPI equation has been shown to be more accurate than the Modification of Diet in Renal Disease equation for estimating GFR in patients with normal kidney function, eGFR represents an indirect parameter of kidney function. Direct measurements of GFR were not conducted in the Kailuan study and, therefore, we cannot ascertain that the eGFR changes adequately reflect the real changes in kidney function. Secondly, in the Kailuan study, albuminuria was not measured at baseline and proteinuria was evaluated only using dipsticks. Therefore, we cannot exclude the bias associated with misclassification of CKD. To counteract potential bias, we applied several different statistical adjustments for baseline kidney function. Moreover, the sensitivity analysis confirms that our conclusions were robust. Finally, while the Kailuan study registry contains data obtained via rigorous measurement and many important covariates are covered, we cannot exclude the bias associated with residual confounders (eg, inflammatory or oxidative stress biomarkers not included in our analyses). However, we observed similar associations with increased mortality for the CKD and non‐CKD subgroups after adjusting for hypertension and diabetes mellitus, indicating that potential confounders did not represent the primary explanation for our findings.
Taken together, our present findings indicate that a greater‐than‐average decline in eGFR over time is associated with higher risk for all‐cause mortality and CVD independent of initial eGFR and other known risk factors at baseline. The association between kidney function decline and risk of clinical outcomes is significant regardless of whether the magnitude of annual change in eGFR is expressed as a percentage or as an absolute value, and the relationship holds true both in individuals with CKD and in those without CKD at baseline. Our data suggest that the sequential decline in kidney function is an independent risk factor for adverse outcomes, in support of the use of serial rather than single‐point eGFR assessment for obtaining prognostic information.
Author Contributions
Research idea and study design: Wu, Luo; data acquisition: Cui, Li, Guo, Ye; data analysis/interpretation: Cui, Li, Guo, Ye; statistical analysis: Ye; supervision or mentorship: Wu, Luo. All authors contributed important intellectual content during manuscript drafting or revision and accept accountability for the overall work by ensuring that questions pertaining to the accuracy or integrity of any portion of the work are appropriately investigated and resolved. Wu and Luo take responsibility that this study has been reported honestly, accurately, and transparently; that no important aspects of the study have been omitted; and that any discrepancies from the study as planned have been explained.
Sources of Funding
This study was supported in part through the Capital Project of Clinical Characteristics Application Research (grant no. Z141107002514150) as well as another grant (grant no. Z161100002616005) from the Beijing Municipal Science & Technology Commission.
Disclosures
None.
Supporting information
Table S1. Characteristics of Participants Who Died and Those With Ascertained CVD During Follow‐Up
Acknowledgments
Many thanks to the Nephrology Research Group in Kailuan hospital for advice and feedback during the preparation of this article.
(J Am Heart Assoc.2018;7:e010596 DOI: 10.1161/JAHA.118.010596.)
Contributor Information
Shouling Wu, Email: drwusl@163.com.
Yang Luo, Email: luoyang96@163.com.
References
- 1. Zhang L, Wang F, Wang L, Wang W, Liu B, Liu J, Chen M, He Q, Liao Y, Yu X, Chen N, Zhang JE, Hu Z, Liu F, Hong D, Ma L, Liu H, Zhou X, Chen J, Pan L, Chen W, Wang W, Li X, Wang H. Prevalence of chronic kidney disease in China: a cross‐sectional survey. Lancet. 2012;379:815–822. [DOI] [PubMed] [Google Scholar]
- 2. Coresh J, Astor BC, Greene T, Eknoyan G, Levey AS. Prevalence of chronic kidney disease and decreased kidney function in the adult US population: Third National Health and Nutrition Examination Survey. Am J Kidney Dis. 2003;41:1–12. [DOI] [PubMed] [Google Scholar]
- 3. Okparavero A, Foster MC, Tighiouart H, Gudnason V, Indridason O, Gudmundsdottir H, Eiriksdottir G, Gudmundsson EF, Inker LA, Levey AS. Prevalence and complications of chronic kidney disease in a representative elderly population in Iceland. Nephrol Dial Transplant. 2016;31:439–447. [DOI] [PMC free article] [PubMed] [Google Scholar]
- 4. Levey AS, Coresh J, Balk E, Kausz AT, Levin A, Steffes MW, Hogg RJ, Perrone RD, Lau J, Eknoyan G. National Kidney Foundation practice guidelines for chronic kidney disease: evaluation, classification, and stratification. Ann Intern Med. 2003;139:137–147. [DOI] [PubMed] [Google Scholar]
- 5. Uhlig K, Levey AS, Sarnak MJ. Traditional cardiac risk factors in individuals with chronic kidney disease. Semin Dial. 2003;16:118–127. [DOI] [PubMed] [Google Scholar]
- 6. Inker LA, Coresh J, Levey AS, Tonelli M, Muntner P. Estimated GFR, albuminuria, and complications of chronic kidney disease. J Am Soc Nephrol. 2011;22:2322–2331. [DOI] [PMC free article] [PubMed] [Google Scholar]
- 7. Nishank J, Susan HS. Rise or fall of glomerular filtration rate: does it matter. Kidney Int. 2013;83:550–553. [DOI] [PubMed] [Google Scholar]
- 8. Xie D, Joffe MM, Brunelli SM, Beck G, Chertow GM, Fink JC, Greene T, Hsu CY, Kusek JW, Landis R, Lash J, Levey AS, O'Conner A, Ojo A, Rahman M, Townsend RR, Wang H, Feldman HI. A comparison of change in measured and estimated glomerular filtration rate in patients with nondiabetic kidney disease. Clin J Am Soc Nephrol. 2008;3:1332–1338. [DOI] [PMC free article] [PubMed] [Google Scholar]
- 9. Leffondre K, Boucquemont J, Tripepi G, Stel VS, Heinze G, Dunkler D. Analysis of risk factors associated with renal function trajectory over time: a comparison of different statistical approaches. Nephrol Dial Transplant. 2015;30:1237–1243. [DOI] [PubMed] [Google Scholar]
- 10. Sohel BM, Rumana N, Ohsawa M, Turin TC, Kelly MA, Al MM. Renal function trajectory over time and adverse clinical outcomes. Clin Exp Nephrol. 2016;20:379–393. [DOI] [PubMed] [Google Scholar]
- 11. Turin TC, Coresh J, Tonelli M, Stevens PE, de Jong PE, Farmer CK, Matsushita K, Hemmelgarn BR. Change in the estimated glomerular filtration rate over time and risk of all‐cause mortality. Kidney Int. 2013;83:684–691. [DOI] [PubMed] [Google Scholar]
- 12. Matsushita K, Selvin E, Bash LD, Franceschini N, Astor BC, Coresh J. Change in estimated GFR associates with coronary heart disease and mortality. J Am Soc Nephrol. 2009;20:2617–2624. [DOI] [PMC free article] [PubMed] [Google Scholar]
- 13. Wu S, Li Y, Jin C, Yang P, Li D, Li H, Shen C. Intra‐individual variability of high‐sensitivity C‐reactive protein in Chinese general population. Int J Cardiol. 2012;157:75–79. [DOI] [PubMed] [Google Scholar]
- 14. Wu J, Jia J, Li Z, Pan H, Wang A, Guo X, Wu S, Zhao X; AUID‐ Oho . Association of estimated glomerular filtration rate and proteinuria with all‐cause mortality in community‐based population in China: a result from Kailuan Study. Sci Rep. 2018;8:2157. [DOI] [PMC free article] [PubMed] [Google Scholar]
- 15. Levey AS, Stevens LA, Schmid CH, Zhang YL, Castro AF III, Feldman HI, Kusek JW, Eggers P, Van Lente F, Greene T, Coresh J. A new equation to estimate glomerular filtration rate. Ann Intern Med. 2009;150:604–612. [DOI] [PMC free article] [PubMed] [Google Scholar]
- 16. Teo BW, Xu H, Wang D, Li J, Sinha AK, Shuter B, Sethi S, Lee EJ. GFR estimating equations in a multiethnic Asian population. Am J Kidney Dis. 2011;58:56–63. [DOI] [PubMed] [Google Scholar]
- 17. Li Z, Wang A, Cai J, Gao X, Zhou Y, Luo Y, Wu S, Zhao X. Impact of proteinuria and glomerular filtration rate on risk of ischaemic and intracerebral hemorrhagic stroke: a result from the Kailuan study. Eur J Neurol. 2015;22:355–360. [DOI] [PubMed] [Google Scholar]
- 18. Mann JF, Gerstein HC, Pogue J, Bosch J, Yusuf S. Renal insufficiency as a predictor of cardiovascular outcomes and the impact of ramipril: the HOPE randomized trial. Ann Intern Med. 2001;134:629–636. [DOI] [PubMed] [Google Scholar]
- 19. Penno G, Solini A, Orsi E, Bonora E, Fondelli C, Trevisan R, Vedovato M, Cavalot F, Lamacchia O, Scardapane M, Nicolucci A, Pugliese G; AUID‐ Oho . Non‐albuminuric renal impairment is a strong predictor of mortality in individuals with type 2 diabetes: the Renal Insufficiency And Cardiovascular Events (RIACE) Italian multicentre study. Diabetologia. 2018;61:2277–2289. [DOI] [PubMed] [Google Scholar]
- 20. Zhang L, Zuo L, Wang F, Wang M, Wang S, Lv J, Liu L, Wang H. Cardiovascular disease in early stages of chronic kidney disease in a Chinese population. J Am Soc Nephrol. 2006;17:2617–2621. [DOI] [PubMed] [Google Scholar]
- 21. Rifkin DE, Shlipak MG, Katz R, Fried LF, Siscovick D, Chonchol M, Newman AB, Sarnak MJ. Rapid kidney function decline and mortality risk in older adults. Arch Intern Med. 2008;168:2212–2218. [DOI] [PMC free article] [PubMed] [Google Scholar]
- 22. Cheng TY, Wen SF, Astor BC, Tao XG, Samet JM, Wen CP. Mortality risks for all causes and cardiovascular diseases and reduced GFR in a middle‐aged working population in Taiwan. Am J Kidney Dis. 2008;52:1051–1060. [DOI] [PubMed] [Google Scholar]
- 23. Sarnak MJ, Levey AS, Schoolwerth AC, Coresh J, Culleton B, Hamm LL, McCullough PA, Kasiske BL, Kelepouris E, Klag MJ, Parfrey P, Pfeffer M, Raij L, Spinosa DJ, Wilson PW. Kidney disease as a risk factor for development of cardiovascular disease: a statement from the American Heart Association Councils on Kidney in Cardiovascular Disease, High Blood Pressure Research, Clinical Cardiology, and Epidemiology and Prevention. Circulation. 2003;108:2154–2169. [DOI] [PubMed] [Google Scholar]
- 24. Weiner DE, Tighiouart H, Amin MG, Stark PC, MacLeod B, Griffith JL, Salem DN, Levey AS, Sarnak MJ. Chronic kidney disease as a risk factor for cardiovascular disease and all‐cause mortality: a pooled analysis of community‐based studies. J Am Soc Nephrol. 2004;15:1307–1315. [DOI] [PubMed] [Google Scholar]
- 25. Manjunath G, Tighiouart H, Ibrahim H, MacLeod B, Salem DN, Griffith JL, Coresh J, Levey AS, Sarnak MJ. Level of kidney function as a risk factor for atherosclerotic cardiovascular outcomes in the community. J Am Coll Cardiol. 2003;41:47–55. [DOI] [PubMed] [Google Scholar]
- 26. Shlipak MG, Stehman‐Breen C, Fried LF, Song X, Siscovick D, Fried LP, Psaty BM, Newman AB. The presence of frailty in elderly persons with chronic renal insufficiency. Am J Kidney Dis. 2004;43:861–867. [DOI] [PubMed] [Google Scholar]
- 27. Odden MC, Chertow GM, Fried LF, Newman AB, Connelly S, Angleman S, Harris TB, Simonsick EM, Shlipak MG. Cystatin C and measures of physical function in elderly adults: the Health, Aging, and Body Composition (HABC) Study. Am J Epidemiol. 2006;164:1180–1189. [DOI] [PubMed] [Google Scholar]
- 28. Perkins RM, Bucaloiu ID, Kirchner HL, Ashouian N, Hartle JE, Yahya T. GFR decline and mortality risk among patients with chronic kidney disease. Clin J Am Soc Nephrol. 2011;6:1879–1886. [DOI] [PMC free article] [PubMed] [Google Scholar]
- 29. Shlipak MG, Fried LF, Cushman M, Manolio TA, Peterson D, Stehman‐Breen C, Bleyer A, Newman A, Siscovick D, Psaty B. Cardiovascular mortality risk in chronic kidney disease: comparison of traditional and novel risk factors. JAMA. 2005;293:1737–1745. [DOI] [PubMed] [Google Scholar]
Associated Data
This section collects any data citations, data availability statements, or supplementary materials included in this article.
Supplementary Materials
Table S1. Characteristics of Participants Who Died and Those With Ascertained CVD During Follow‐Up