

Abstract
Background
The physiological function of ADTRP (androgen‐dependent tissue factor pathway inhibitor regulating protein) is unknown. We previously identified ADTRP as coregulating with and supporting the anticoagulant activity of tissue factor pathway inhibitor in endothelial cells in vitro. Here, we studied the role of ADTRP in vivo, specifically related to vascular development, stability, and function.
Methods and Results
Genetic inhibition of Adtrp produced vascular malformations in the low‐pressure vasculature of zebrafish embryos and newborn mice: dilation/tortuosity, perivascular inflammation, extravascular proteolysis, increased permeability, and microhemorrhages, which produced partially penetrant lethality. Vascular leakiness correlated with decreased endothelial cell junction components VE‐cadherin and claudin‐5. Changes in hemostasis in young adults comprised modest decrease of tissue factor pathway inhibitor antigen and activity and increased tail bleeding time and volume. Cell‐based reporter assays revealed that ADTRP negatively regulates canonical Wnt signaling, affecting membrane events downstream of low‐density lipoprotein receptor‐related protein 6 (LRP6) and upstream of glycogen synthase kinase 3 beta. ADTRP deficiency increased aberrant/ectopic Wnt/β‐catenin signaling in vivo in newborn mice and zebrafish embryos, and upregulated matrix metallopeptidase (MMP)‐9 in endothelial cells and mast cells (MCs). Vascular lesions in newborn Adtrp −/− pups displayed accumulation of MCs, decreased extracellular matrix content, and deficient perivascular cell coverage. Wnt‐pathway inhibition reversed the increased mmp9 in zebrafish embryos, demonstrating that mmp9 expression induced by Adtrp deficiency was downstream of canonical Wnt signaling.
Conclusions
Our studies demonstrate that ADTRP plays a major role in vascular development and function, most likely through expression in endothelial cells and/or perivascular cells of Wnt‐regulated genes that control vascular stability and integrity.
Keywords: vascular inflammation; vascular permeability; vascular stability, Wnt signaling, vascular function; vasculopathy
Subject Categories: Vascular Disease
Clinical Perspective
What Is New?
We describe the role of ADTRP (androgen‐dependent tissue factor pathway inhibitor regulating protein) in vivo using mouse and zebrafish models of Adtrp genetic inhibition.
We show that ADTRP deficiency leads to leaky vessels, edema, and hemorrhage involving defective junctions, matrix degradation, and local inflammation, possibly because of ectopic/increased Wnt signaling, accumulation of mast cells, and increased MMP‐9 expression.
What Are the Clinical Implications?
Given that gene association studies suggested that ADTRP associates with deep vein thrombosis/venous thromboembolism, myocardial infarction, and coronary artery disease in humans, ADTRP deficiency affecting vascular homeostasis/stability may negatively impact cardiovascular diseases through pathological disruption of the vascular wall, matrix degradation, and increased inflammation.
ADTRP (Androgen‐dependent tissue factor pathway inhibitor [TFPI]‐regulating protein) was first described in our laboratory as a novel and uncharacterized protein encoded by C6ORF105.1 Based on sequence homology, ADTRP belongs to the androgen‐inducible gene family, of which androgen‐inducible gene 1 was cloned from human dermal papilla.2 In endothelial cells (ECs) in vitro, ADTRP regulates expression and activity of TFPI, the major inhibitor of the tissue factor‐dependent pathway of coagulation, both in normal conditions and in response to androgen,1 the latter involving transcriptional activation through half‐site androgen‐response elements in the ADTRP promoter.1, 3 Genome‐wide association studies revealed that single‐nucleotide polymorphisms in ADTRP associate with deep vein thrombosis/venous thromboembolism,4 myocardial infarction,5 and coronary artery disease, possibly through regulation of melanoma inhibitory activity protein 3 (MIA3)/transport and Golgi organization protein 1 (TANGO1), collagen VII, and apolipoprotein B (ApoB).6, 7 A novel function was recently discovered for ADTRP and androgen‐inducible gene 1, namely that they could hydrolyze bioactive fatty acid esters of hydroxy‐fatty acids in vitro8; however, the in vivo significance of this finding is elusive.
Because the physiological function of ADTRP was still unknown, we addressed in the present study the role of ADTRP in vascular development and function using zebrafish and mouse animal models.
Abnormal vascular remodeling and angiogenesis contribute to the pathogenesis of atherosclerosis, hypertension, and tumors.9 Critical processes for vascular development, such as angiogenesis, maturation of junctions, and mural cell coverage,10, 11, 12, 13 require highly regulated interactions between ECs, mural cells, and extracellular matrix (ECM), which may involve vascular endothelial growth factor (VEGF), Notch, and Wnt signaling.14 Canonical Wnt‐pathway plays important roles in sprouting, arterio‐venous specification, and vascular permeability,15, 16 but its role in vascular remodeling, especially ECM production and turnover, is less known.
Here, we reveal, for the first time, that ADTRP deficiency leads to defective vasculature organization in zebrafish embryos and newborn mice, involving dilated and leaky vessels, EC junction defects, loose perivascular cell (PVC) coverage, microhemorrhage, degraded ECM, and edema. We demonstrate that ADTRP deficiency activates canonical Wnt/β‐catenin signaling resulting in an Wnt‐dependent increase in matrix metalloproteinase (MMP)‐9 expression and activity. Deficiency of ADTRP associates with high accumulation of mast cells (MCs), whose degranulation products could contribute to the inflammation and vascular defects observed. For the first time, to our knowledge, we demonstrate a critical role of ADTRP in vascular homeostasis, with potential impact for diseases involving pathological disruption of the vascular wall, such as inflammation, myocardial infarction, deep vein thrombosis/venous thromboembolism, sepsis, and cancer.
Materials and Methods
The data, analytical methods, and study materials will not be made available to other researchers for purposes of reproducing the results and replicating the procedure.
Antibodies
Primary antibodies, used according to the manufacturers, were as follows: mouse monoclonal antibody (mAb) anti‐FLAG/DDK (TA50011; OriGene, Rockville, MD); rabbit mAb anti‐non‐phospho (active) β‐catenin (Ser33/37/Thr41; 8814; Cell Signaling Technology, Danvers, MA); rabbit anti‐β‐catenin (ab16051; Abcam, Cambridge, MA); rat mAb anti‐mouse CD31 (553370; BD Pharmingen, San Diego, CA); mouse mAb anti‐Fibrin II β‐chain (NYBT2G1; Accurate Chemical & Scientific, Westbury, NY); rabbit mAb anti‐desmin (1466‐1; Epitomics, Inc, Eugene, OR); rat mAb anti‐CD144 (cadherin‐5/VE‐cadherin [VEC]; 550548; BD Pharmingen); Alexa Fluor 488–labeled mouse mAb anti‐claudin‐5 (352588; Thermo Fisher Scientific, Waltham, MA); goat anti‐MMP‐9 (AF909; R&D Systems, Minneapolis, MN); mouse mAb anti‐MC tryptase (M7052; Dako, Carpinteria, CA); rabbit anti‐laminin (Z0097; Dako); rabbit anti‐mouse collagen‐IV (2150‐1470; Bio‐Rad, Hercules, CA); rabbit anti‐β‐galactosidase (β‐GAL; AB1211; EMD Millipore, Burlington, MA); rat mAb anti‐mouse erythroid cells (TER‐119; 116202; BioLegend, San Diego, CA); rabbit anti–platelet‐derived growth factor receptor beta (P20; sc‐339; Santa Cruz Biotechnology, Santa Cruz, CA); rabbit anti‐human ADTRP (HPA048113; Sigma‐Aldrich, St. Louis, MO); biotin‐labeled rat mAb anti‐mouse Ly6G/Ly‐6C (GR‐1; 108404; BioLegend); mouse mAb anti–enhanced green fluorescent protein (632381; Clontech Laboratories, Mountain View, CA); rabbit anti–glyceraldehyde 3‐phosphate dehydrogenase (G9545; Sigma‐Aldrich); and rabbit anti‐zebrafish Mmp‐9 (55345; AnaSpec, Fremont, CA).
Secondary antibodies and fluorophore‐conjugated streptavidin were from Jackson ImmunoResearch (West Grove, PA) and used as described1 or per the manufacturer's protocols.
Cell Lines and Culture
The immortalized hybrid EC line, EA.hy926,17 (gift from Dr Cora‐Jean Edgell, University of North Carolina) and HEK293T cells were cultured and used as described.1, 18, 19 We used L‐Wnt3a cells (ATCC CRL−2647) and L‐Cells (ATCC CRL‐2648) to prepare Wnt‐conditioned and control media as per ATCC (Manassas, VA) instructions.
We isolated mouse dermal fibroblasts from newborn pups (P0) cephalic skin explants20 separately from 4 Adtrp −/− pups and 2 wild‐type (WT) pups, and used them for up to 5 passages.
Animal Studies
All animal procedures followed were approved by the institutional animal care and use committee.
Generation of the mouse model of Adtrp global deletion
The conditional null allele for the Adtrp gene was generated by Dr Dale Cowley (University of North Carolina), using the bacterial artificial chromosome gene targeting strategy,21 to simultaneously introduce LoxP sites flanking both exons 2 and 5 of 9530008L14RIK gene (mouse Adtrp). We needed this approach because exons 2 to 5 of the Adtrp gene share in‐frame splice junctions, so that removal of only 1 of exons 2, 3, or 4 would not produce a frameshift event. Also, the removed exons should encode key protein functions so their excision would inactivate any residual protein produced if the mRNA is not degraded; but, in the case of Adtrp, we did not know which exons were critical for its function. According to the sequence analysis, removal of exon 5 triggers nonsense mRNA decay, and the additional removal of exon 2 ensures that any residual mRNA would not produce a functional polypeptide. The bacterial artificial chromosome targeting vector was designed to introduce: (1) LoxP1 site in intron 1; (2) LoxP2 site and FRT‐flanked Neo‐resistance cassette in intron 2; (3) LoxP3 site in intron 4; and (4) LoxP4 site and FRT‐flanked Hyg‐cassette in intron 5. After validation, the bacterial artificial chromosome was introduced into C57BL/6 embryonic stem cells, which were injected into albino blastocysts and the chimeras were mated to albino‐C57BL/6 females. Black offspring positive for the mutant allele were crossed with ROSA26‐Flpe + mice to remove Hyg and Neo cassettes. In this process, Flpe recombinase also deleted the entire region between exons 3 and 5, and we selected Adtrp Flpe−Del/Flpe−Del as the constitutive global knockout mice, Adtrp −/−. We have also generated and back‐crossed the Adtrp‐floxed (Adtrp fl/fl) mouse line.
We back‐crossed Adtrp −/− with WT C57BL/6 mice for over 10 generations and maintained them at the Oklahoma Medical Research Foundation animal facility.
Adtrp −/− mice were also crossed with the Wnt/β‐catenin reporter mouse B6.Cg‐Tg(BAT‐lacZ) 3Picc/J β‐catenin/TCF/LEF (BAT‐GAL z+), which expresses β‐GAL in the presence of active β‐catenin and mimics the pattern of Wnt signaling (mouse strain datasheet‐005317; The Jackson Laboratory, Bar Harbor, ME).
The age of the mice was P0 (newborn) for the majority of the studies. The use of 2‐ to 3‐month‐old young adults for a small number of assays is indicated in the appropriate sections.
Zebrafish husbandry and drug treatments
WT and transgenic Tg(fli1:EGFP)y1 zebrafish and their embryos were grown and maintained under standard conditions.22, 23 Embryonic pigmentation was inhibited with 0.2 mmol/L of N‐phenylthiourea (Sigma‐Aldrich) and chorions removed with 1 mg/mL of pronase (Calbiochem, San Diego, CA). For blocking Mmp‐9 activity, dechorionated embryos at 48 hours postfertilization (hpf) were incubated with 100 μmol/L of GM600124, 25, 26, 27 (Santa Cruz Biotechnology) and harvested at 72 hpf. To inhibit canonical Wnt signaling, embryos were treated with 20 μmol/L of IWR‐128, 29 (Axin stabilizer) for 8 hours and harvested at 72 hpf.
Morpholino and mRNA microinjections
Two zebrafish paralogous genes for human ADTRP have been identified, namely adtrp1, on chromosome 23, and adtrp2, on chromosome 13.30 The NCBI‐2013 database predicts that zgc112175 (adtrp1) is the only gene homologous to human ADTRP; therefore, we selected this homolog for our study and hereafter refer to it as “adtrp.” Splice‐blocking morpholinos (MOs; GeneTools LLC, Philomath, OR) targeting the exon 2/intron 2 boundary (adtrp e2i2): 5′‐CAGTGTGTGCGGCGCTACTCACCGT‐3′, or exon 3/intron 3 boundary (adtrp e3i3): 5′‐ACAAACGAATGATCTCACCATTGCA‐3′ of the adtrp premature mRNA were used to knock down adtrp expression. Controls included scrambled (5ʹ‐CTCTTACCTCAGTTACAATTTATA‐3ʹ) and p53 (5ʹ GCGCCATTGCTTTGCAAGAATTG‐3ʹ) MOs.31 Capped and polyadenylated human ADTRP mRNA was synthesized from pCMV6‐Entry/ADTRP‐FLAG (OriGene) using the mMESSAGE mMACHINE kit (Ambion, Austin, TX). MOs were microinjected into 1‐ to 4‐cell–stage embryos using 1 pmol/embryo for adtrp MOs (e2i2 or e3i3)±1.5 pmol/embryo of p53 MOs or 350 pg/embryo of ADTRP mRNA. All microinjections were performed as described.32, 33
Gene Expression, Transcriptional Reporter Assay, and RNA Silencing
HEK293T cells were cotransfected with pSuper‐8XTOPFlash luciferase reporter and pRG‐TK encoding Renilla (gifts from Dr Sathish Srinivasan, Oklahoma Medical Research Foundation), and pCMV6‐Entry/ADTRP‐FLAG or control plasmids (OriGene)1, 34 using Effectene (Qiagen, Hilden, Germany).1 Cells incubated with Wnt3a or control media were assayed after 24 hours for luciferase activity using the Dual‐Luciferase Reporter Assay (Promega, Madison, WI) in a Glomax 20/20 Luminometer (Promega).
Cells cotransfected with ADTRP or control plasmids, plus 1 of the following plasmids (Addgene, Cambridge, MA): full‐length β‐CATENIN, constitutively active β‐CATENIN S37A,34 or constitutively active low‐density lipoprotein receptor‐related protein 6 (LRP6)ΔN‐pCS2‐VSVG, were assayed for luciferase activity after 48 hours.
For silencing experiments, ADTRP‐siRNA or negative control (OriGene) were transfected in EA.hy926 cells using Lipofectamine 2000 (Thermo Fisher Scientific).
Quantitative Real‐Time PCR
Total RNA isolated from zebrafish embryos, cultured cells, and mouse tissues using Trizol (Invitrogen) was purified and transcribed into cDNA as described.1 qPCR was performed using predesigned primers (Prime‐Time, Integrated DNA Technologies Inc, Coralville, IA) and RT2SYBR Green master mix (Qiagen) in a CFX96 Real Time System (Bio‐Rad).
Experiments were repeated 3 times using at least 10 zebrafish embryos/condition and mouse samples from 6 individual pups/genotype as biological replicates. For cells in culture, the experiments were repeated at least 2 (usually 3) times using 3 replicate culture wells per condition. All qPCRs were run in duplicate on each cDNA.
In Situ Hybridization
Whole‐mount in situ hybridization (ISH) was performed using zebrafish adtrp and matrix metalloproteinase 9 (mmp9) digoxigenin‐labeled riboprobes essentially as described.35, 36 mmp9 riboprobe was a kind gift from Dr David Jones (Oklahoma Medical Research Foundation). ISH for adult (2 months old) mouse aorta and lung sections was performed using mouse Adtrp riboprobe essentially as described.37 For imaging, we used a Nikon SMZ18 stereomicroscope (Nikon Corp., Tokyo, Japan) with DSFI2 camera and NIS‐Elements (version 4.2) software or the Nikon Eclipse E800M with an OMAX A35140u camera and OMAX ToupView (3.7.2270) software (ToupTek Photonics, Hangzhou City, China).
Immunofluorescence, Image Acquisition, and Image Analysis
Immunofluorescence staining was done as whole mount on pieces of organs from newborn mouse pups, as well as on cryosections of zebrafish caudal vein plexus (CVP), and cell culture as described.1, 38, 39 We used a modification of the iDISCO procedure40 for whole‐mount sample collection, pretreatment without methanol, and immunolabeling without tissue clearing. Samples were mounted with Vectashield (Vector Laboratories, Inc, Burlingame, CA) on homemade slide chambers. Samples were analyzed based on endogenous enhanced green fluorescent protein or immunofluorescence using the Nikon C1 confocal system on a Nikon TE2000U microscope with EZ‐C1 (Version 3.6; Nikon) software1 or a Nikon Eclipse Ti‐E inverted microscope and an Andor Zyla 4.2 Plus sCMOS camera using NIS‐Elements AR4.5 (Nikon) software. The confocal system objectives were all Nikon Infinity‐Corrected: dry PlanFluor 20x/NA0.75 and 20x/NA0.5, and oil‐immersion PlanFluor 40x/NA1.3, PlanApo 60x/NA1.4, and PlanFluor 100x/NA1.3. Image collection parameters (neutral density filters, pinhole, and detector gains) were kept constant during image acquisition to make reliable comparisons between specimens. Image acquisition was done sequentially for each fluorescence channel to avoid bleed‐through. Quantification of fluorescence intensity and image analysis were done as described.19, 41 For whole‐mount samples, 10 to 15 images (12‐bit, 4095 gray levels/pixel) were collected for each experimental condition, and mean fluorescence intensity, expressed as arbitrary units, was measured for the whole image, or in 15 to 20 regions of interest per image (as specified in the figure legends). For cell cultures, mean fluorescence intensity was measured in the whole nucleus in a minimum of 20 cells per group, randomly chosen from at least 5 images for each experiment. For all conditions, mean fluorescence intensity was integrated using EZ‐C1 software.
All primary antibodies used were obtained from commercial sources and tested by us and other groups as described in previous publications. Omission of primary antibody or substitution with isotype‐specific immunoglobulin Gs at the same concentration as the primary antibody were used as controls for nonspecific binding of the secondary antibody.
For zebrafish embryos, total percentage of defective intersegmental vessels (ISVs) was quantified by counting the number of vessels not reaching the dorsal longitudinal anastomotic vessel at 48 or 72 hpf. Percentage of CVP dilation was calculated as the ratio between CVP area and the total area of the tail posterior to the yolk sac.
Histological analysis was done on paraffin sections stained with phosphotungstic acid or hematoxylin and eosin.41 Bright‐field images were obtained with a Nikon SMZ800 stereomicroscope using Nikon HR Plan Apo 0.5x objective and OMAX camera and ToupView software (as above).
Transmission Electron Microscopy
Pieces of cephalic skin (1×1‐mm) and tail rings from newborn pups and 72‐hpf zebrafish embryos were fixed by immersion in Karnovsky's fixative and processed essentially as described.42 Semithin (500 nm) and ultrathin sections (70 nm) were obtained using an ultramicrotome (Leica EM UC7; Leica Microsystems, Wetzlar, Germany) equipped with a diamond knife. Ultrathin sections were stained with uranyl acetate and lead citrate before analysis with a Hitachi H‐7600 electron microscope (Hitachi High‐Technologies Co., Tokyo, Japan) equipped with a 4‐megapixel digital monochrome camera and AMT‐EM image acquisition software (Advanced Microscopy Techniques, Woburn, MA).
Zymography
At least 10 zebrafish embryos (72‐hpf) per condition were lysed in 10 mmol/L of HEPES/saline buffer (pH 7.5), 150 mmol/L of NaCl, 0.1% Triton X‐100, 10 mmol/L of CaCl2, and 1xHalt Protease Inhibitor Cocktail without EDTA (Thermo Fisher Scientific). Thirty micrograms of total protein of lysate or conditioned medium from mouse primary fibroblasts, grown individually from 4xAdtrp −/− and 2xWT P0 pups cephalic skin, were electrophoresed on Novex 10% Gelatin gels (Invitrogen, Carlsbad, CA). Zymogram gels were incubated in 1% Triton X‐100, 50 mmol/L of Tris‐HCL (pH 7.5), 5 mmol/L of CaCl2, and 1 μmol/L of ZnCl2 overnight at 37°C, stained with Coomassie blue, destained, and imaged using an Epson scanner‐1680 (Epson, Suwa, Japan).
In situ zymography was done essentially as described.43 We used a quenched fluorescence MMP substrate, which, upon cleavage by MMPs, becomes dequenched and gives a fluorescent signal. Sections (10‐μm) of unfixed 48‐hpf zebrafish embryos embedded in OCT were taken on glass slides and washed with PBS. Quenched MMP fluorescence substrate QXL 570‐KPLA‐Nva‐Dap(5‐TAMRA)‐AR‐NH2 (AnaSpec) was used according to the manufacturer's instructions. After mixing with 0.1% low‐melting agarose, the substrate was overlaid on tissue sections and slides were incubated at 37°C until a satisfactory fluorescence signal was achieved. Fluorescence microscopy images were taken by a confocal microscope as described above.
Western Blot
Protein lysates from 72‐hpf zebrafish embryos, mouse P0 cephalic skin, or cell cultures were subjected to SDS‐PAGE and western blot as described.1 Total protein was assayed by BCA (Pierce, Rockford, IL). All experiments were repeated 3 times.
Semiquantitative densitometry analysis of zymogram gels and immunoblots was performed using ImageJ software (version 1.42b; National Institutes of Health, Bethesda, MD).
Ortho‐Dianisidine Staining
Staining was done as described.44 Nonfixed 72‐hpf zebrafish embryos were stained for 15 minutes in the dark with O‐dianisidine (0.6 mg/mL), 0.01 mol/L of sodium acetate (pH 4.5), 0.65% H202, and 40% (vol/vol) ethanol and cleared with benzyl benzoate/benzyl alcohol (2:1, vol/vol). Imaging was performed as above.
Coagulation Assays and Blood Cell Counts
Thermo Scientific Pacific hemostasis prothrombin time and activated partial thromboplastin time reagents were used to assess prothrombin time and activated partial thromboplastin time as per the manufacturer's protocol. Thrombin‐antithrombin complexes were detected by sandwich ELISA, using anti‐human thrombin (Affinity Biologicals, Inc, Ancaster, ON, Canada) as capture and biotinylated anti‐human antithrombin antibody (Affinity Biologicals) as detection antibodies. Thrombin‐antithrombin standard was from an Enzygnost thrombin‐antithrombin micro (Siemens Healthcare Diagnostics, Norwood, MA). Blood cell counts were determined using a Hemavet 950FS (Drew Scientific Inc, Miami Lakes, FL) cell counter.
Other Assays
Tail bleeding time and hemoglobin assay were performed as described.45 TFPI antigen, measured by DuoSet ELISA (R&D Systems), and activity, measured by 2‐stage chromogenic assay using human coagulation factors,39, 46 were determined in plasma and lung lysates.46
Data Collection and Statistical Analysis
All results are reported as mean±SEM or mean±SD. Statistical analysis was performed with GraphPad Prism software (v7.0b RRID:SCR_002798; GraphPad Software Inc, La Jolla, CA). An unpaired t test was used to analyze 2 experimental conditions, whereas 1‐way ANOVA followed by Bonferroni's multicomparison test were used when comparing more than 2 data sets. Differences were considered significant when P≤0.05. Analysis of cell and tissue microscopy specimens was done in a blinded manner. All experiments were repeated at least 3 times, with each assay typically run in triplicate.
Results
Knockdown of adtrp Causes Vascular Defects in Zebrafish Embryos
ISH revealed that adtrp is expressed in the developing vasculature (Figure 1A through 1D) in the anterior, medial, and posterior lateral plate mesoderm (arrows), where populations of angioblasts reside. Adtrp is expressed in both the dorsal aorta and cardinal vein (Figure 1B and 1C, right‐side panel) and increases during embryogenesis (Figure 1F).
Figure 1.

Expression of adtrp in zebrafish embryos. A through E, Whole‐mount in situ hybridization for adtrp in zebrafish embryos using digoxigenin‐labeled riboprobes. A, Adtrp expression in anterior, medial, and posterior lateral plate mesoderm (lpm; arrows). B through D, Expression of adtrp is apparent in major blood vessels (arrows) at 16, 24, and 48 hours postfertilization (hpf). C, Right panel displays a cross‐section of 24‐hpf embryo confirming adtrp expression in dorsal aorta and cardinal vein. Bar: 50 μm. E, Negative control with sense riboprobe. F, mRNA expression of adtrp assayed by qPCR in zebrafish embryos through the embryonic development. n>30 biological replicates for each time point. cv indicates cardinal vein; da, dorsal aorta; nt, notochord.
The role of adtrp in vascular development and function was investigated by knocking down adtrp1 (adtrp homologous gene located on chromosome 23; hereafter named “adtrp”) in Tg(fli1:EGFP)y1 embryos using adtrp e2i2 or adtrp e3i3 MOs (Figure 2A). After preliminary testing of a range of MO concentrations, we chose 1 pmol of MO/embryo as the dose producing both an acceptable mortality rate (≈25%) and a knockdown efficiency of ≈50% at 72 hpf, as assessed by qPCR, for both splice‐blocking MOs versus control MO (Figure 2B). The 72‐hpf whole embryos displayed no significant changes in expression of the adtrp2 homolog on chromosome 13 (Figure 2C), which indicates that adtrp1 deficiency is the sole cause of the phenotypic changes observed.
Figure 2.

Efficiency of adtrp knockdown in zebrafish embryos. A, Design of splice‐blocking morpholinos (MO) for adtrp1, the adtrp homologous gene on chromosome (Chr) 23; hereafter named “adtrp,” targeting exon2‐intron2 (e2i2) and exon3‐intron3 (e3i3) boundaries. B, mRNA expression of adtrp assayed by qPCR in 72 hours postfertilization (hpf) embryos shows 50% knockdown efficiency for both adtrp MOs used at 1 pmol MO/embryo. adtrp e2i2 MO, hereafter named “adtrp” MO, was used in all knockdown experiments unless otherwise stated. Statistics: 1‐way ANOVA with Bonferroni's multicomparison test. Values are mean±SEM fold‐change from control after correction for elongation factor 1a as internal control. ****P<0.0001. C, Effect of adtrp1 MO injection on mRNA expression of adtrp2 (adtrp homologous gene on Chr 13), assayed by qPCR in 72‐hpf embryos. Statistics: unpaired t test. Data are presented as for (B). NS indicates not significant, P>0.05. B and C, Experiments were repeated 3 times with qPCR technical duplicates. Each marker represents a group of at least 10 embryos.
As illustrated by the intrinsic enhanced green fluorescent protein fluorescence of embryo blood vessels visualized by whole‐mount confocal microscopy (Figure 3A), adtrp knockdown produced defective patterning of ISVs (white arrows and insets, Figure 3A) and significantly reduced the vessels’ development (Figure 3B; quantitative analysis of ISVs). Disorganization of the CVP network (dashed line areas; Figure 3A, 3D, and 3F) and plexus dilation/edema (Figure 3C; quantitative measurement of CVP area) also occurred. To assess the specificity of MO effects, the adtrp MO was coinjected with human ADTRP‐FLAG mRNA. The human ADTRP protein expressed in the adtrp morphants, as demonstrated by western blot with anti‐FLAG immunoglobulin G (Figure 3A lowest panel) partially rescued the ISV and CVP defects (Figure 3A through 3C). By transmission electron microscopy, the EC layer surrounding dilated CVP appears intact (Figure 3D, panel c).
Figure 3.

Knockdown of adtrp causes vascular defects in zebrafish embryos. A, Bright‐field (left panels) and whole‐mount fluorescence confocal microscopy of 72 hours postfertilization (hpf) Tg(fli1:EGFP)y1 zebrafish embryos (right panels; EGFP, fluorescent vascular reporter) injected with scrambled (control) or adtrp morpholinos (MO)±human ADTRP mRNA. Human FLAG‐tagged ADTRP expression was verified by western blot (lower panel blot of 72‐hpf embryo lysates; protein loading: Ponceau Red staining). White arrows: intersegmental vessels (ISVs). White dashed line: caudal vein plexus (CVP) area. Bars: 100 μm. Quantification of vascular phenotype: scatter plots and statistics (1‐way ANOVA with Bonferroni's multicomparison test) of B the percentage of defective ISVs, and C the percentage area of CVP dilation normalized to tail area. Data are mean±SEM of biological replicates (n). ****P<0.0001 between all groups. D, Semithin sections at the CVP level (red dashed lines) of control (a) and adtrp MOs (b and c). White arrow: endothelial cells (ECs). Bars: a and b, 10 μm; c, 5 μm. E, O‐dianisidine staining for red blood cells in 72‐hpf embryos injected with adtrp or control MOs. Arrows: hemorrhage spots. F, Fluorescence confocal microscopy of 72‐hpf Tg(fli1‐EGFP)y1 embryos injected with adtrp e2i2+p53, adtrp e3i3, or p53 MOs shows nearly identical defective patterning of ISV (arrows) and dilated CVP (white dashed line areas) in all adtrp morphants, but not in the p53 MO–injected embryos. Bars: 100 μm. ADTRP indicates androgen‐dependent tissue factor pathway inhibitor regulating protein; EGFP, enhanced green fluorescent protein.
We also observed hemorrhage spots in the head and CVP region of adtrp morphants as shown by O‐dianisidine staining (Figure 3E).
Similar ISV and CVP network defects also appeared for the adtrp e3i3 MOs (Figure 3F).
To preclude cell death as a cause for the observed phenotype, we coinjected p53+adtrp e2i2 MOs and observed nearly identical responses in both adtrp e2i2 and p53+adtrp e2i2 morphants, but not in embryos injected with p53 MOs alone (Figure 3F). Because penetrance of the vascular phenotype was >80% for all the combinations tested (Table 1), even at ≈50% knockdown efficiency, we used adtrp e2i2 MOs, hereafter referred to as “adtrp” MOs, for all adtrp knockdown experiments.
Table 1.
Descriptive Statistics of the Vascular Phenotype in Zebrafish
| Injections | Total No. | Normal Looking | Presence of Vascular Phenotype |
|---|---|---|---|
| Not injected | 100 | 100 (100%) | 0 (0%) |
| Scrambled MO | 137 | 130 (94.87%) | 7 (5.13%) |
| Water | 59 | 56 (94.90%) | 3 (5.10%) |
| adtrp e2i2 MO | 113 | 14 (12.40%) | 99 (87.60%) |
| adtrp e3i3 MO | 88 | 9 (10.23%) | 79 (89.77%) |
| adtrp e2i2 MO + p53 MO | 71 | 13 (18.30%) | 58 (81.70%) |
MO indicates morpholino.
Generation and Characterization of the Mouse Model of Adtrp Global Deletion
Adtrp expression in whole embryos of WT (C57BL/6) mice gradually increased during embryogenesis (Figure 4A). ISH in lung and aorta of 2‐month‐old WT mice showed strong expression of Adtrp in ECs (Figure 4B).
Figure 4.

Expression of Adtrp in wild‐type (WT) mice. A, mRNA expression of Adtrp assayed by qPCR in WT mouse embryos is observed throughout embryonic development and increases with age. B, In situ hybridization for Adtrp in the lung (upper panels) and aorta (lower panel) of 2‐month‐old WT mice using digoxigenin‐labeled riboprobes shows Adtrp expression in endothelial cells (blue, left‐side panels). Right‐side panels: negative controls with sense riboprobe. Bars: 100 μm (lung), 50 μm (aorta). Adtrp indicates androgen‐dependent tissue factor pathway inhibitor regulating protein.
Adtrp global knockout mice were obtained as described in the Materials and Methods section and are illustrated in Figure 5A through 5C. Additional PCRs (data not shown) confirmed the removal of the Hyg and Neo cassettes and the lack of Flpe expression in the final mouse line selected for backcrossing. qPCR for Adtrp in various organs showed that Adtrp −/− mice had minimal mRNA expression, thus confirming the efficiency of gene deletion (Figure 5D).
Figure 5.

Generation and characterization of Adtrp global knockout mice. A, Bacterial artificial chromosome (BAC) gene targeting was used to simultaneously introduce loxP sites flanking both exons 2 and 5 of 9530008L14RIK gene (mouse Adtrp) to produce a frame‐shift event. The BAC vector also introduced FRT‐flanked Neo‐resistance cassette in intron 2 and Hyg‐cassette in intron 5. During the crossing of offspring positive for the mutant allele with ROSA26‐Flpe + mice to remove Hyg and Neo cassettes, Flpe recombinase also deleted the region between exons 3 and 5, thus generating Adtrp Flpe‐Del/Flpe‐Del, which was selected as the constitutive global knockout mouse, Adtrp −/−. B, Genomic DNA extracted from toe tips was subjected to PCR using primers pair #1, specific for LoxP1 site, to confirm the presence of lox allele. Homozygous Adtrp LoxP1/LoxP1 mice were further screened for the Flpe deletion by using primers pair #2, which amplifies a 511‐bp product only if the recombination occurred between exons 3 to 5. C, Agarose gel showing an example of genotyping (grayscale‐mode inverted image). D, mRNA expression of Adtrp assayed by qPCR in cephalic skin, lung, and heart of newborn (P0) pups shows minimal expression in Adtrp −/− mice. Statistical analysis: unpaired t test. Values are fold‐change from wild‐type (WT; arbitrarily set to 1.0) after correction for β‐2 Microglobulin as internal control. Data are mean±SEM from experiments repeated at least 3 times. Markers represent means of qPCR technical duplicates performed on 5 biological replicates. E and F, Descriptive statistics derived from the breeding and backcrossing of Adtrp −/− mice shows partially penetrant lethality (35%) in newborn pups. E, Genotypic distribution among offspring of heterozygous (Het) pairs. F, Litter size and neo‐/perinatal death. Statistical analysis: 1‐way ANOVA with Bonferroni's multicomparison test. Data are mean±SEM. ****P<0.0001; NS, P>0.05. Adtrp indicates androgen‐dependent tissue factor pathway inhibitor regulating protein; bp, base pair; NS, not significant.
Thirty‐five percent of Adtrp −/− pups are stillborn or expire neo‐/perinatal (Figure 5E and 5F). Given that the number of Adtrp −/− progenies from heterozygous pairs is significantly lower than Mendelian prediction (Figure 5E), substantial lethality likely occurred during late gestation. Pups who survive do grow into adulthood, and, although their reproduction rate is lower than WT littermates, there is no significant difference in litter sizes (Figure 5F).
Newborn Adtrp −/− Mice Show Defective Vasculature
Vascular defects, easily observed in newborn pups (P0) through transparency in the cephalic skin (Figure 6A), as well as in the meningeal layers, thoracic wall, heart, eye, kidney, and brain (Figure 6B), comprised capillary tortuosity, abnormal branching, dilated vessels (Figure 6C), and microhemorrhages associated with the low‐pressure microvasculature such as postcapillary venules and small veins (Figure 6D). We did not observe obvious changes in the morphology of the large vessels, such as the aorta. Severity of vascular defects correlated with the neo‐/perinatal mortality.
Figure 6.

Newborn (P0) Adtrp −/− mice display defective blood vessels. A, Gross morphology of cephalic skin in wild‐type (WT) and Adtrp −/− mice. B, Bright‐field microscopy showing vessel dilation and tortuosity, hemorrhage, and abnormal branching (arrows) in various organs. C, Immunofluorescence staining with anti‐CD31 (FITC, green; endothelial cell marker) IgG and whole‐mount confocal microscopy in WT and Adtrp −/− mice. Bars: 100 μm. D, Immunofluorescence whole‐mount confocal microscopy with anti–red blood cell (RBC) TER‐119 (FITC, green) IgG in the dura mater. Arrows: microhemorrhage. Bars, 50 μm. IgG indicates immunoglobulin G.
We confirmed vessel leakiness in Adtrp −/− P0 pups with the permeability tracer, Sulfo‐NHS‐Biotin (intracardiac infusion),47 followed by whole‐mount staining with streptavidin‐Cy3 (cephalic skin; Figure 7A) and semiquantitative analysis (Figure 7E). Hemorrhage spots (Figure 7A) and extravascular fibrin deposition appeared in the skin (Figure 7B), as well as in brain, heart, kidney, and lung (data not shown).
Figure 7.

Newborn (P0) Adtrp −/− mice display leaky vessels and defective endothelial cell junctions. A, Whole‐mount confocal fluorescence microscopy of P0 pups cephalic skin after infusion of the permeability tracer, Sulfo‐NHS‐Biotin (SNB), and staining with Streptavidin‐Cy3 (red, left‐side panels). Red arrows: vascular leakage. Blue: TO‐PRO3 nuclear staining. Cy3‐channel presented in grayscale mode in the right‐hand panels for better visualization of the fluorescence. Bars: 100 μm. B, Double immunofluorescence with anti‐Fibrin (Cy3, red) and anti‐CD31 (FITC, green) IgGs, and whole‐mount confocal microscopy of skin from wild‐type (WT) and Adtrp −/− P0 mice. Blue: nuclei. Red arrows in “Fibrin” panels: extravascular fibrin. Bars, 50 μm. C, Double immunofluorescence with anti‐VE‐Cadherin (VEC; Cy3, red) and anti‐CD31 (FITC, green) IgGs, and whole‐mount confocal microscopy (as for B) in WT and Adtrp −/− mice. Blue, nuclei. Bars, 10 μm. D, Double immunofluorescence whole‐mount confocal microscopy with anti‐Claudin‐5 (FITC, green) and anti‐CD31 (Cy3, red) IgGs in cephalic skin shows low levels of claudin‐5 (grayscale mode) in Adtrp −/− pups. Bars, 50 μm. E, Mean fluorescence intensity (MFI) and statistics (mean±SD by unpaired t test) of SNB/Cy3 (images in A). Each marker represents the mean of at least 10 regions of interest measured on 5 images/condition and expressed as arbitrary units (AU). ****P<0.0001. F MFI and statistics as for E of VEC immunostaining (images in C). **P<0.01. G mRNA expression of VEC (Cadherin5, Cdh5) and Claudin‐5 (Cldn5) in cephalic skin from P0 pups. Values are fold‐change from WT (arbitrarily set to 1.0) after correction for β2‐Microglobulin as internal control. Statistics: mean±SEM by unpaired t test. **P<0.01. IgG indicates immunoglobulin G.
Adtrp −/− P0 pups displayed lower levels of VEC (Figure 7C and 7F) and claudin‐5 (Figure 7D) than WT mice. qPCR, using RNA from skin, lung, and heart, showed ≈2‐fold decreased expression of both Cdh5 (VEC) and Cldn5 (claudin‐5) in Adtrp −/− mice (Figure 7G; cephalic skin). Transcript levels of some transcription factors that are known as regulators of Cdh5 and Cldn5 expression, such as Klf4 (parallel regulator48) and Hif3α (repressor of Cdh5 49), were significantly changed in Adtrp −/− versus WT P0 pups (Table 2; cephalic skin).
Table 2.
ADTRP Deficiency Regulates Gene Transcription in the Cephalic Skin From Newborn (P0) Mice
| Function | Genes Up‐ or Down‐Regulated in Adtrp −/− versus Wild‐Type Mice P≤0.05a | Fold Ratio |
|---|---|---|
| Endothelial cell permeability | Cdh5 (CD144; VE‐Cadherin) | 0.46 |
| Cldn5 (claudin‐5) | 0.39 | |
| Klf4 (Krueppel like factor‐4) | 0.18 | |
| Hif3α (hypoxia‐inducible factor‐3a) | 2.95 | |
| Mast cell components and regulators | Ktlg (Kit Ligand) | 2.18 |
| Fcer1α (IgE receptor) | 3.65 | |
| Spi1 (transcription factor PU.1) | 2.60 | |
| L1cam (CD171; L1 cell adhesion molecule) | 1.90 | |
| Dpp4 (CD26; dipeptidyl peptidase 4) | 1.60 | |
| Hdc (histidine decarboxylase) | 5.65 | |
| Srgn (serglycin) | 2.30 | |
| Tpsab1 (MCP‐7; tryptase) | 2.27 | |
| Mcpt4 (beta‐chymase; MCP‐4) | 2.32 | |
| Cpa3 (carboxypeptidase A3) | 4.10 | |
| Casp3 (caspase‐3) | 1.70 | |
| Mmp9 (matrix metallopeptidase‐9) | 1.50 | |
| Inflammatory cell markers | Lgals3 (galectin‐3) | 1.80 |
| Itgam (Integrin α M; CD11b) | 1.50 | |
| Itgax (Integrin α X; CD11c) | 2.16 | |
| Cd4 | 1.30 | |
| KC/Cxcl1 (functional IL‐8 homolog) | 2.20 | |
| Tnf (tumor necrosis factor) | 2.94 | |
| Vcam1 (vascular cell adhesion molecule‐1) | 2.31 | |
| Wnt signaling | Tcf4 (transcription factor‐4) | 4.41 |
| Axin2 | 3.20 | |
| Dkk1 (Dickkopf related protein 1) | 0.42 | |
| Notum (palmitoleoyl‐protein carboxylesterase) | 0.23 |
ADTRP indicates androgen‐dependent tissue factor pathway inhibitor regulating protein. n=6 for each genotype.
Statistical analysis was done by t test.
We also observed defective PVC coverage, as illustrated by whole‐mount immunofluorescence for desmin in cephalic skin and brain (Figure 8A), and for platelet‐derived growth factor receptor beta in skin (Figure 8B).
Figure 8.

Newborn (P0) Adtrp −/− mice display defective perivascular cell (PVC) coverage. A, Double immunofluorescence whole‐mount confocal microscopy with anti‐Desmin (Cy3, red) and anti‐CD31 (FITC, green) IgGs in the cephalic skin (upper row) and brain (lower row) of wild‐type (WT) and Adtrp −/− pups. Cy3‐channel in grayscale mode and red arrows in inserts indicate desmin disorganization and deficient mural cells coverage. Bars, 50 μm. B, Double immunofluorescence whole‐mount confocal microscopy with anti‐PDGFRβ (Cy3, red) and anti‐CD31 (FITC, green) IgGs in the skin illustrates decreased levels of red fluorescence intensity and disorganization around dilated vessels in Adtrp −/− pups (grayscale mode). Bars, 50 μm. IgG indicates immunoglobulin G; PDGFRβ, platelet‐derived growth factor receptor beta.
Young Adtrp −/− Adult Mice Display Mild Vascular Dysfunction
Although the surviving pups grow into adulthood without displaying a severe vascular phenotype, adult Adtrp −/− mice (≈3‐months old, both males and females) present mild vascular dysfunction, such as bleeding spots (Figure 9A; red arrows) and fibrin deposition (Figure 9B), in the lung.
Figure 9.
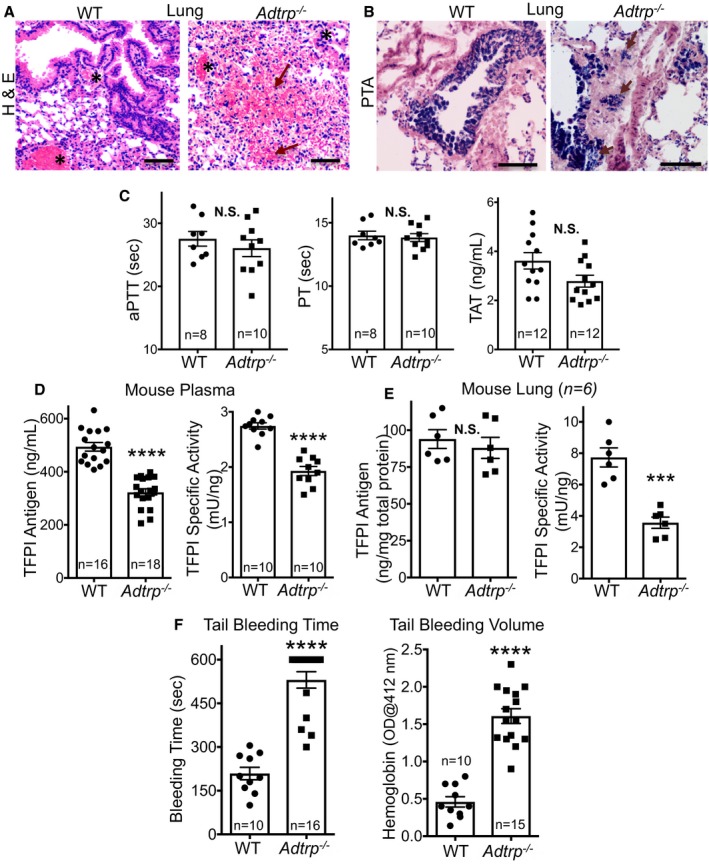
Adult Adtrp −/− mice display mild vascular dysfunction. A, Bright‐field microscopy of lung sections of young adult mice (2–3 months old) stained with hematoxylin and eosin (H&E) shows bleeding areas (red arrows) in Adtrp −/− mice. Black asterisks: blood vessels. Bars, 500 μm. B, Bright‐field microscopy of lung sections as in (A) stained with phosphotungstic acid (PTA) shows extravascular fibrin deposition (purple arrows) in Adtrp −/− mice. Bars, 100 μm. C, Activated partial thromboplastin time (aPTT), prothrombin time (PT), and thrombin‐antithrombin (TAT) complexes measured in plasma from young adult (2–3 months old) wild‐type (WT) and Adtrp −/− mice. Statistics: unpaired t test. Data are mean±SEM. NS, P>0.05. D, TFPI antigen (left panel) and specific activity (right panel) are both decreased in plasma from young adult (2–3 months old) WT and Adtrp −/− mice. TFPI activity assay used human coagulation factors and standard curve made with serial dilutions of pooled normal mouse plasma. E, TFPI antigen (left panel) and specific activity (right panel; as in D) measured in lung extracts from adult WT and Adtrp −/− mice. Statistical analysis: unpaired t test. Data are mean±SEM. ****P<0.0001; ***P<0.001; NS, P>0.05. C through E, Markers are mean values of technical duplicates performed on n biological replicates. F, Tail bleeding time (left panel) and volume of blood loss measured as hemoglobin content (right panel) are significantly increased in Adtrp −/− mice. Statistical analysis: unpaired t test. Data are mean±SEM. n, biological replicates. ****P<0.0001. NS indicates not significant; OD, optical density; TFPI, tissue factor pathway inhibitor.
Hematological and hemostasis/coagulation parameters measured in 2‐month‐old mouse plasma, such as blood cell counts including platelets (Table 3), thrombin‐antithrombin complexes, prothrombin time, and activated partial thromboplastin time, did not change significantly in Adtrp −/− versus WT (Figure 9C). TFPI antigen and activity levels were decreased in the plasma (Figure 9D) regardless of sex. TFPI antigen in lung did not change significantly, but anticoagulant activity of TFPI was lower in lung extracts of Adtrp −/− versus WT mice (Figure 9E). Tfpi mRNA expression in lung was not changed (data not shown).
Table 3.
Mouse Blood Cell Counts
| Blood Cell Counts (Mean±SEM) | Genotype | |
|---|---|---|
| Wild Type (n=10) | Adtrp −/− (n=30) | |
| White blood cells (×103/μL) | 10.34±0.96 | 10.24±0.35 |
| Red blood cells (M/μL) | 8.436±0.11 | 8.531±0.12 |
| Hemoglobin (g/dL) | 11.99±0.15 | 12.02±0.15 |
| Hematocrit (vol %) | 43.1±0.57 | 45.54±0.42 |
| Lymphocytes (×103/μL) | 8.883±0.71 | 8.451±0.32 |
| Monocytes (×103/μL) | 0.525±0.06 | 0.4158±0.02 |
| Neutrophils (×103/μL) | 1.125±0.07 | 1.142±0.04 |
| Eosinophils (×103/μL) | 0.047±0.007 | 0.05676±0.006 |
| Basophils (×103/μL) | 0.013±0.001 | 0.015±0.001 |
| Platelets (×103/μL) | 753.9±21 | 657.9±15 |
Tail bleeding time was significantly increased in Adtrp −/− mice, as was volume of blood loss measured as hemoglobin content (Figure 9F) in saline solution in which the tail was dipped. This increased blood loss likely occurred because of tail vessels dilation.
Newborn Adtrp −/− Mice Display Vascular Defects, Degraded, and/or Decreased ECM, Interstitial Edema, and MC Accumulation
ECM and basement membrane are important factors for vascular stability.50, 51 Transmission electron microscopy of P0 pups skin and tail revealed that, as opposed to WT (Figure 10A and 10G), Adtrp −/− mice showed degraded ECM, severe extravascular edema (red asterisks), distorted basement membrane (black asterisks), and deficient PVC coverage (black arrows; Figure 10B through 10E and 10H). Extravasated red blood cells, neutrophils, and MCs appear near the defective vessels (Figure 10B, 10D, 10F, and 10H‐right panel). Electron density and shape of ECs were heterogenous within the same vessel, indicating some extent of EC dysfunction (Figure 10B through 10E; labeled EC*). Similar heterogeneity was not observed in the PVC.
Figure 10.
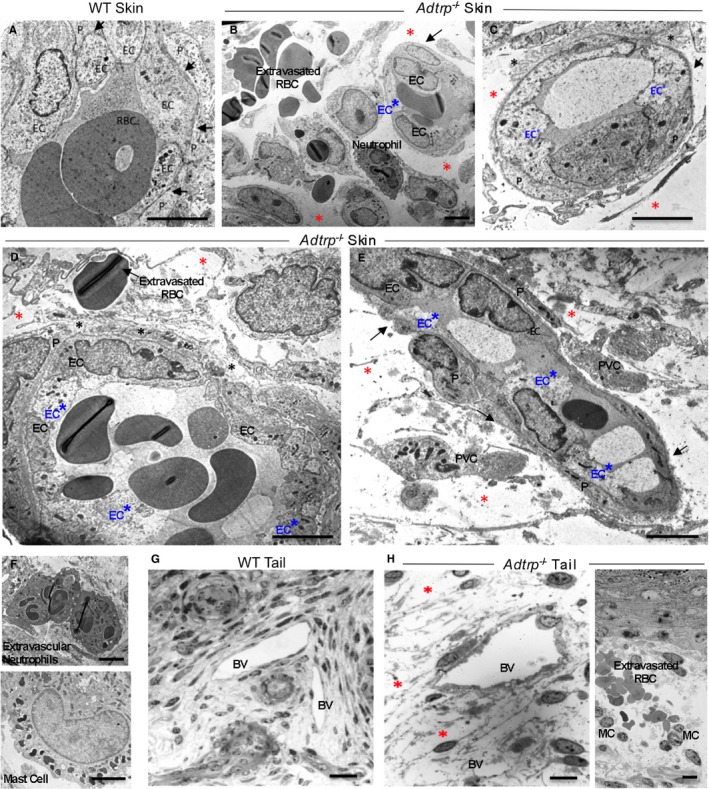
Ultrastructural analysis of the defective blood vessels in Adtrp −/− newborn mice. Transmission electron microscopy of P0 pups cephalic skin (A through E) and tail (G and H) of wild‐type (WT; A and G) and Adtrp −/− (B through F and H) mice. Red asterisks: severe extravascular edema (B, C, E, H). Black asterisks: degraded extracellular matrix (ECM), distorted and amorphous basement membrane (BM) with large intercellular spaces (C and D). Black arrows: defective perivascular cell coverage (B, C, E). Blue EC*: endothelial cells with heterogeneous shape and electron density (B, C, D, E). Mast cells (MC) accumulate in areas with vascular defects (F and H). Bars: (A) to (F) 5 μm, (G) 50 μm, and (H) 10 μm. BV indicates blood vessel; P, pericyte; RBC, red blood cells.
Whole‐mount immunofluorescence and western blot for laminin (Figure 11A and 11B) and collagen‐IV (Figure 11C) in the cephalic skin also illustrate basement membrane and ECM deficiencies.
Figure 11.

Evidence of decreased and/or degraded basement membrane in cephalic skin of P0 Adtrp −/− mice. A, Double immunofluorescence with anti‐Laminin (Cy3, red) and anti‐CD31 (FITC, green) IgGs, and whole‐mount confocal microscopy in wild‐type (WT) and Adtrp −/− mice. Blue, nuclei. Bars, 50 μm. Histogram: mean fluorescence intensity (MFI) of laminin measured on 5 images/condition and expressed as mean±SD arbitrary units (AU). Statistics: unpaired t test. Each marker represents the mean of at least 10 regions of interest. ****P<0.0001. B, Total lysates of skin from WT and Adtrp −/− pups analyzed by SDS‐PAGE and immunoblotted with anti‐Laminin and anti‐β‐Actin antibodies (left panel, representative western blot from 3 biological replicates). Histogram: semiquantitative densitometry and statistics (mean±SEM by t test). Markers represent biological replicates. *P<0.05. C, Double immunofluorescence with anti‐Collagen‐IV (Cy5, blue; or white in grayscale mode) and anti‐erythroid cells TER‐119 (FITC, green) IgGs, and whole‐mount confocal microscopy in WT and Adtrp −/− mice. Arrows in inset: vessel dilation, microhemorrhage, and collagen disruption. Bars, 50 μm. For all panels, grayscale‐mode images are presented for better visualization of fluorescence intensity. IgG indicates immunoglobulin G; RBC, red blood cells.
One striking feature first observed on semithin sections of Adtrp −/− P0 skin and confirmed by transmission electron microscopy was the accumulation of high numbers of MCs in skin (Figure 10H) and tail (Figure 12A, yellow asterisks), many of which appear degranulated (black arrows) and coincide with edema (red asterisks) and extravasated red blood cells (blue arrow; Figure 12A). Staining the diaphragm with Toluidine Blue confirmed significantly increased MC numbers in Adtrp −/− P0 pups (Figure 12B). Whole‐mount immunofluorescence for the MC marker, tryptase, revealed MC accumulation near defective vasculature (Figure 12C).
Figure 12.

Increased mast cell (MC) accumulation in newborn (P0) Adtrp −/− mice. A, Transmission electron microscopy of the tail from wild‐type (WT) and Adtrp −/− pups. Yellow asterisks: MC accumulation. Black arrows: degranulated MC. Blue arrow: extravasated red blood cells. Red asterisks: decreased extracellular matrix density and enhanced edema. Bars, 10 μm. B, Bright‐field microscopy on whole‐mount diaphragms stained with Toluidine Blue showing MC (purple). Histogram: quantification and statistics (mean±SEM by unpaired t test) of MC numbers in the tail and diaphragm of P0 pups (6 each). Markers are numbers of MCs counted in n fields of view (FOV) from at least 5 images/condition. ***P<0.001; ****P<0.0001. C, Double immunofluorescence with anti‐MC Tryptase (Cy3, red) and anti‐CD31 (FITC, green) IgGs, and whole‐mount confocal microscopy in cephalic skin of WT and Adtrp −/− newborn mice. Bars, 50 μm. BV indicates blood vessel; IgG, immunoglobulin G.
qPCR on RNA from P0 pups cephalic skin, lung, and heart showed significantly increased transcript levels for regulators of MC egression from the circulation, maturation, proliferation, and survival of MCs,52 as well as for granule components involved in ECM degradation, vascular remodeling, and inflammation (Table 2; cephalic skin).
ADTRP Negatively Regulates Canonical Wnt Signaling Both In Vitro and In Vivo
Because ADTRP deficiency in both zebrafish and mice produced vascular defects reminiscent of altered canonical Wnt signaling,15, 16, 53 we decided to investigate the involvement of ADTRP in the Wnt/β‐catenin pathway.
Upon Wnt3a induction, ADTRP‐siRNA knockdown in EA.hy926 EC (verified by western blot; Figure 13A) produced significant increase of LEF1 and AXIN2 mRNA levels (Figure 13B, gray bars) and increased active β‐catenin protein expression (Figure 13C) and its nuclear translocation (Figure 13D). These results indicate an inverse correlation between ADTRP expression and canonical Wnt signaling.
Figure 13.

ADTRP deficiency increases canonical Wnt signaling. A, Total lysates of EA.hy926 ECs expressing nontargeting siRNA (siControl) or siADTRP analyzed by SDS‐PAGE and immunoblotted with anti‐ADTRP and anti‐GAPDH IgGs. Shown: representative western blot from 3 experiments. B, mRNA expression of LEF1 and AXIN2 assayed by qPCR in siControl or siADTRP‐expressing EA.hy926 ECs. Gray bars: treatment with Wnt3a conditioned medium for 3 hours. Values (mean±SEM by 1‐way ANOVA with Bonferroni's multicomparison test) are fold‐change from siControl (arbitrarily set to 1.0) after correction for β‐2 MICROGLOBULIN or 18S rRNA as internal controls. *P<0.05; **P<0.01; ****P<0.0001. C, Total lysates of siControl and siADTRP‐ EA.hy926 EC analyzed by SDS‐PAGE and immunoblotted with anti‐active β‐Catenin and anti‐GAPDH IgGs. Shown: representative western blot from 3 experiments. D, Immunofluorescence and confocal microscopy with anti‐active β‐Catenin (Cy3, red) IgG on siControl and siADTRP‐EA.hy926 ECs, and scatter plot and statistics of mean fluorescence intensity (MFI) expressed as mean arbitrary units (AU)±SD (unpaired t test) measured within nuclei (n cells/condition analyzed in at least 5 images recorded from 3 different experiments). White arrow: nuclear active β‐catenin. Blue, nuclei. Bars, 10 μm. ****P<0.0001. ADTRP indicates androgen‐dependent tissue factor pathway inhibitor regulating protein; ECs, endothelial cells; GAPDH, glyceraldehyde 3‐phosphate dehydrogenase; IgG, immunoglobulin G; LEF1, lymphoid enhancer binding factor 1; rRNA, ribosomal RNA; siRNA, small interfering RNA.
Conversely, ADTRP overexpression in HEK293T cells (verified by western blot; Figure 14A) significantly decreased LEF1 and AXIN2 expression (Figure 14B, gray bars) and TOPFlash reporter activity upon Wnt3a induction (Figure 14C, gray bars), confirming that ADTRP inhibits Wnt/β‐catenin signaling. Western blot confirmed the overall decrease of active β‐catenin in ADTRP‐expressing cells upon Wnt3a induction (Figure 14D), whereas immunofluorescence showed significantly less active β‐catenin in the nuclei (Figure 14E).
Figure 14.

ADTRP negatively regulates Wnt/β‐catenin pathway. A, Western blot with anti‐FLAG and anti‐GAPDH IgGs in total lysates of HEK293T cells transfected with control or ADTRP‐FLAG plasmids. Shown: representative blot from 3 experiments. B, mRNA expression of LEF1 and AXIN2 in control and ADTRP‐expressing HEK293T cells. Gray bars: treatment with Wnt3a conditioned medium for 24 hours. Values (mean±SEM by 1‐way ANOVA with Bonferroni's multicomparison test) are fold‐change from control (arbitrarily set to 1.0) after correction for β‐2 MICROGLOBULIN as internal control. *P<0.05; **P<0.01. C, TOPFlash luciferase reporter activity and statistics (unpaired t test) in HEK293T cells expressing empty vector (control) or ADTRP‐FLAG, incubated with Wnt3a medium for 24 hours (gray bars). Data are mean±SEM. ****P<0.0001. D, Total lysates of HEK293T cells analyzed by SDS‐PAGE and immunoblotted with anti‐active β‐Catenin and anti‐GAPDH IgGs. E, Immunofluorescence and confocal microscopy with anti‐active β‐Catenin (Cy3, red) IgG and scatter plot and statistics of mean fluorescence intensity (MFI) expressed as mean arbitrary values (AU)±SD (unpaired t test) measured within nuclei (n cells/condition analyzed in at least 5 images recorded from 3 different experiments). White arrow: nuclear active β‐catenin. Blue, nuclei. Bars, 10 μm. ****P<0.0001. F, TOPFlash luciferase reporter activity and statistics in HEK293T cells incubated with 10 mmol/L of LiCl for 24 hours. Data are mean±SEM by unpaired t test. NS, P>0.05. G and H, TOPFlash luciferase reporter activity and statistics (1‐way ANOVA with Bonferroni's multicomparison test) in control and ADTRP‐expressing HEK293T cells at 48 hours after transfection with either full‐length β‐CATENIN or active β‐CATENIN–expressing plasmids (G, gray bars); or (H) constitutively active LRP6ΔN plasmid (gray bars). Data are mean±SEM. NS, P>0.05; ****P<0.0001. For all panels: Markers represent different experiments. ADTRP indicates androgen‐dependent tissue factor pathway inhibitor regulating protein; GAPDH, glyceraldehyde 3‐phosphate dehydrogenase; IgG, immunoglobulin G; LRP6, low‐density lipoprotein receptor‐related protein 6; LEF1, lymphoid enhancer binding factor 1; NS, not significant.
Addition of LiCl (Figure 14F) or coexpression of constitutively active β‐catenin in Wnt/β‐catenin reporter cells (Figure 14G, gray bars) abolished the inhibitory effect of ADTRP, indicating that ADTRP may act upstream of glycogen synthase kinase‐3 beta (GSK‐3β). Inhibition of Wnt signaling in Wnt/β‐catenin reporter cells coexpressing ADTRP and the constitutively active LRP6ΔN (Figure 14H, gray bars) suggests that ADTRP interferes with events downstream of LRP6 phosphorylation.
To study the effect of ADTRP on Wnt signaling in vivo, we crossed Adtrp −/− mice with the Wnt/β‐catenin reporter mouse BAT‐GAL z+, which expresses β‐GAL in the presence of active β‐catenin and mimics the pattern of Wnt signaling. Whole‐mount immunofluorescence on tissues from P0 pups revealed high levels of β‐GAL staining (Figure 15A) in cells associated with, but not limited to, defective vasculature. For skin, very little β‐GAL appeared in normal vessels in (WT) BAT‐GAL z+ mice, whereas dilated vessels in Adtrp −/− BAT‐GAL z+ mice displayed strong β‐GAL signal (Figure 15A, Skin panels; pink arrows). In contrast with the (WT) BAT‐GAL z+ brain, which showed high levels of β‐GAL, but with little or no association with blood vessels, the Adtrp −/− BAT‐GAL z+ brain displayed strong accumulation of β‐GAL in defective vessels (Figure 15A, brain panels; pink arrows). Skin from Adtrp −/− P0 pups displayed both upregulated expression of Tcf4, the primary target of Wnt/β‐catenin (Figure 15B), and increased active β‐catenin protein levels (Figure 15C). Lef1 expression was also significantly increased in fibroblasts isolated from Adtrp −/− skin explants versus WT (Figure 15D), indicating constitutively active Wnt/β‐catenin signaling in Adtrp −/− dermal fibroblasts.
Figure 15.

Ectopic and/or aberrant canonical Wnt signaling in newborn Adtrp −/− mice. A, Double immunofluorescence and whole‐mount confocal microscopy with anti‐CD31 (FITC, green) and anti‐β‐Galactosidase (β‐GAL; Cy3, red) IgGs in cephalic skin (upper panels) and brain (lower panels) of wild‐type (WT) BAT‐GAL z+ and Adtrp −/− BAT‐GAL z+ pups. Blue, nuclei. Pink arrows: β‐GAL in defective vessels. Bars, 50 μm. B, mRNA expression of Tcf4 in cephalic skin. Values are fold‐change from WT (arbitrarily set to 1.0) after correction for β‐2 Microglobulin as internal control. C, Representative western blot (upper panel) with anti‐active β‐Catenin and anti‐ β‐Actin IgGs in total lysates from WT and Adtrp −/− cephalic skin. Histogram (lower panel): semiquantitative densitometry. D, mRNA expression of Lef1 in primary fibroblasts cultured from WT and Adtrp −/− cephalic skin explants. Values are fold‐change from WT (arbitrarily set to 1.0) after correction for β‐2 Microglobulin as internal control. B through D, Statistics: unpaired t test. Data are mean±SEM. **P<0.01, ****P<0.0001. Markers represent biological replicates. Adtrp indicates androgen‐dependent tissue factor pathway inhibitor regulating protein; IgG indicates immunoglobulin G; Lef1, lymphoid enhancer binding factor 1; Tcf4, transcription factor 4.
Table 2 shows canonical Wnt signaling markers whose transcript levels were significantly changed in Adtrp −/− P0 pups skin.
ADTRP Deficiency Leads to Increased MMP‐9 Expression and Activity
When investigating downstream target genes of Wnt/β‐catenin signaling, which could produce the vascular defects observed in zebrafish morphants, we did not find changes in vascular markers like angptl4, egr1, vegfaa, efnb2a, dll4, and ephb4a. We did, however, find that mmp9 expression was 15‐fold increased in 72‐hpf adtrp morphants.
Whole‐mount ISH showed strong signal for mmp9 in the dilated CVP (Figure 16A; blue arrow). Immunofluorescence on cross‐sections of CVP revealed larger amounts of Mmp‐9 around the dilated CVP in adtrp morphants than in controls, and human ADTRP mRNA reversed the Mmp‐9 increase (Figure 16B). Gel zymography showed increased Mmp‐9 activity in whole extracts of adtrp morphants (Figure 16C). Increased metallopeptidase activity was observed in the vicinity of dilated CVP by in situ zymography on adtrp morphant sections (Figure 16D).
Figure 16.

Adtrp deficiency leads to increased expression of matrix metallopeptidase‐9 (Mmp9) mRNA, protein, and activity levels in zebrafish embryos and newborn mice. A, Whole‐mount in situ hybridization for mmp9 (blue) in 72 hours postfertilization (hpf) control and adtrp zebrafish morphants. Blue arrow: specific signal accumulation. Black arrow: caudal vascular plexus (CVP). n, biological replicates. Bars, 100 μm. B, Immunofluorescence staining with anti‐Mmp‐9 (Cy3, red) IgG on cross‐sectioned CVP (green) of 72‐hpf Tg(fli1:EGFP)y1 (EGFP, fluorescent vascular reporter) control and adtrp morphants±human ADTRP mRNA. Bars, 100 μm. C, Total lysates of 72‐hpf zebrafish embryos incubated ±100 μmol/L of pan‐MMP inhibitor GM6001 for 24 hours and analyzed by 10% gelatin gel electrophoresis. Left: representative zymogram (grayscale inverted image). Histogram: semiquantitative densitometry and statistics (mean±SEM by t test). *P<0.05. Each marker represents a group of at least 10 embryos. D, In situ zymography with MMP fluorescence substrate QXL™ 570‐KPLA‐Nva‐Dap(5‐TAMRA)‐AR‐NH2 (red, dequenched fluorescence) on cross‐sectioned CVP (green) of 48‐hpf Tg(fli1:EGFP)y1 embryos injected with Control or adtrp morpholinos (MOs). Arrows: MMP activity. E, Fluorescence confocal microscopy of 72‐hpf Tg(fli1:EGFP)y1 embryos injected with control or adtrp MOs (left panels; EGFP, fluorescent vascular reporter)±GM6001 as for C. Bars, 100 μm. Quantification of vascular defects (right panels): scatter plots and statistics (1‐way ANOVA with Bonferroni's multicomparison test) of the percentage of defective intersegmental vessels (ISVs) and percentage area of CVP dilation normalized to tail area. Data are mean±SEM of biological replicates (n). ****P<0.0001 between all groups. F, Double immunofluorescence and whole‐mount confocal microscopy with anti‐MMP‐9 (Cy3, red) and either anti‐CD31 or anti‐GR‐1 (FITC, green) in cephalic skin; or with anti‐MMP‐9 (Cy3, red) and anti‐mast cell (MC) Tryptase (FITC, green) in lung of wild‐type (WT) and Adtrp −/− P0 pups. MMP‐9 associates with both CD31 and GR‐1–positive cells in the skin (lower panels, white arrow and inset), and with MC (lung panels, yellow arrows). Bars, 100 μm. G, Zymography (as in C) of conditioned media of primary fibroblasts cultured from P0 WT and Adtrp −/− cephalic skin explants. Upper panel: representative zymogram (grayscale inverted image). Histogram: semiquantitative densitometry and statistics using t test. Data are mean±SEM of biological replicates. ****P<0.0001. Adtrp indicates androgen‐dependent tissue factor pathway inhibitor regulating protein; EGFP, enhanced green fluorescent protein; IgG indicates immunoglobulin G.
To determine whether the increased MMP‐9 activity contributed to the vascular defects in zebrafish, we used the MMP inhibitor GM6001,24, 25, 26, 27 and observed that it reversed the increased MMP‐9 activity (Figure 16C) and partially rescued the vascular defects in adtrp morphants (Figure 16E).
In mice as well, Mmp9 expression was increased in skin (Table 2), as well as in the lung and heart of P0 pups (1.5‐fold increase). Whole‐mount immunofluorescence showed more MMP‐9 staining in cells associated with defective vasculature in Adtrp −/− P0 skin compared with WT (Figure 16F), both in CD31‐positive ECs (lower panel inset) and GR‐1–positive leukocytes, which also appear more numerous (middle panels). MCs in lung costained for MMP‐9 (Figure 16F, Lung; yellow arrows). Conditioned media of dermal fibroblasts from P0 skin contain significantly more MMP‐9 protein and activity in Adtrp −/− than in WT (Figure 16G).
ADTRP Deficiency Enhances MMP‐9 in a Wnt Signaling‐Dependent Manner
Whole‐mount immunofluorescence on lung from Adtrp −/− BAT‐GAL z+ P0 pups confirmed enhanced MMP‐9 staining that partially colocalized with β‐GAL–positive (active β‐catenin reporter) cells (Figure 17A), some of which are MCs (data not shown). Mmp9 expression was significantly higher in dermal fibroblasts from Adtrp −/− P0 pups versus WT, and Wnt3a dramatically increased the effect (Figure 17B, gray bars), as well as in siADTRP EA.hy926 ECs compared with controls upon Wnt3a induction (Figure 17C). Treatment of zebrafish adtrp morphants with the Wnt inhibitor, IWR‐1,28, 29 reversed the increased mmp9 expression (Figure 17D), suggesting that this was partially dependent on Wnt signaling.
Figure 17.

ADTRP deficiency‐induced matrix metallopeptidase‐9 (MMP‐9) is regulated by canonical Wnt signaling. A, Double immunofluorescence with anti‐MMP‐9 (FITC, green) and anti‐β‐Galactosidase (β‐GAL; Cy3, red), and confocal microscopy in whole‐mount P0 pups lung of Adtrp −/− BAT‐GAL z+ and wild‐type (WT) BAT‐GAL z+. Arrows: partial expression of β‐GAL (active β‐catenin reporter) in MMP‐9–producing cells. Blue, nuclei. Bars, 50 μm. B, mRNA expression of Mmp9 in primary fibroblasts cultured from WT and Adtrp −/− P0 pups cephalic skin explants. Gray bars: treatment with Wnt3a medium for 24 hours. Values are fold‐change from WT (arbitrarily set to 1.0) after correction for β‐2 Microglobulin as internal control. Data are mean±SEM by 1‐way ANOVA with Bonferroni's multicomparison test. Markers represent mean values of 3 replicate cell cultures isolated from 2 mice each. **P<0.01; ***P<0.001. C, mRNA expression of MMP9 in control and siADTRP‐EA.hy926 ECs incubated with Wnt3a medium for 24 hours. Markers represent different experiments and are fold‐change from siControl (arbitrarily set to 1.0) after correction for β‐2 MICROGLOBULIN as internal control. Data are mean±SEM by unpaired t test. ****P<0.0001. D, mRNA expression of mmp9 in control and adtrp morphants at 72 hours postfertilization after incubation with Wnt inhibitor IWR‐1 (20 μmol/L) for 8 hours. Values are fold‐change from control (arbitrarily set to 1.0) after correction for β‐actin or elongation factor 1a as internal controls. Each marker represents a group of at least 10 embryos. Data are mean±SEM by 1‐way ANOVA with Bonferroni's multicomparison test. **P<0.01; ****P<0.0001. ADTRP indicates androgen‐dependent tissue factor pathway inhibitor regulating protein; ECs, endothelial cells.
Inflammatory Response in ADTRP‐Deficient Mice
RNA expression of several inflammatory markers was significantly increased in the cephalic skin of Adtrp −/− P0 pups (Table 2): KC/Cxcl1 (functional Interleukin‐8 homolog); Itgam (CD11b); Itgax (CD11c); Lgals3 (galectin‐3); Cd4; Vcam1; and Tnf.
Expression of the major Wnt‐target gene CXCL8 (interleukin‐8) was over 2‐fold ratio increased in zebrafish adtrp morphants and in siADTRP‐EA.hy926 cells after Wnt3a induction.
Discussion
Our study is the first to address the physiological role of ADTRP in vascular development and function. For this purpose, we knocked down adtrp in zebrafish using MOs and developed a genetic mouse model of Adtrp global deletion. Use of MOs, as opposed to genetic knockouts in zebrafish, has been extensively debated, and each approach has its benefits and drawbacks.31, 54, 55 We tried to overcome MO limitations by including the appropriate control and rescue experiments to allow us to distinguish between specific phenotypes and off‐target effects, according to established guidelines.54 We consider that zebrafish data add value to our findings given that they bring complementary information that supports the mouse data.
Adtrp −/− mice do not display hemostasis and/or coagulation defects, except for decreased plasma levels of TFPI antigen and activity, found equally in males and females. Although not shown here, we found no difference of testosterone levels between WT and Adtrp −/− in plasma from ≈3‐month‐old mice. Contrary to our in vitro data1 and a recent report,30 Tfpi expression did not change either in Adtrp −/− mice (lung) or in the Adtrp‐deficient zebrafish embryos, but TFPI‐specific activity in mouse lung was significantly lower and probably caused the mild bleeding and fibrin deposition observed. These in vivo data support our previous findings1 that ADTRP may control and preserve cell‐surface distribution and anticoagulant potential of TFPI in ECs. Whether any of these processes are dependent on androgen signaling remains to be determined.
Zebrafish adtrp morphants display defective vascular patterning and incomplete development of ISVs, disorganized CVP network, and dilation. Similarly, newborn Adtrp −/− pups present vascular malformations in the low‐pressure vasculature, including abnormal dilation, tortuosity and branching, increased permeability, ECM degradation, basement membrane defects, and extravascular edema. Severity of the phenotype correlates with mortality, producing ≈35% neo‐/perinatal lethality. These findings demonstrate a major role of ADTRP in vascular development and remodeling, as well as vessel integrity.
Vessel leakiness in Adtrp −/− pups indicates increased permeability attributed to defective endothelial barrier integrity, which is a hallmark of inflammation, pathological angiogenesis, and edema.56 Interendothelial junctions are the main structures maintaining tissue‐fluid homeostasis. Major components of EC junctions are claudin‐5 in tight junctions57 and VEC and β‐ and γ‐catenins in adherens junctions.56 VEC sequestering of β‐catenin stabilizes the junctions and controls the interaction with mural cells.56 If this sequestering is perturbed through either tyrosine‐phosphorylation of VEC and β‐catenin by inflammatory mediators (such as tumor necrosis factor alpha [TNF‐α]), or decreased VEC expression, then β‐catenin will dissociate from VEC, enhance its nuclear translocation,58 and transcriptionally repress Cldn5.59 We suggest that the low mRNA and protein expression of VEC and claudin‐5 in ADTRP‐deficient cells triggered β‐catenin nuclear translocation and disruption of EC barrier integrity, which led to leakiness, hemorrhage, and severe edema, in a scenario reminiscent of the chronic vascular leakage produced by low VEC expression in tumors.57 These findings confirm that ADTRP is significantly involved in the formation of blood vessels and maintenance of the EC barrier.
Some of the vascular defects in Adtrp‐deficient zebrafish and mice could result from altered Wnt signaling, whereby stabilization of β‐catenin correlates with defects of vessel length and branching, abnormal vessel dilation, and disorganized CVP.15, 53, 60 Whereas baseline Wnt/β‐catenin activity is necessary for vascular development during embryogenesis and tissue homeostasis and repair in the adult,61, 62 aberrant Wnt signaling in pathological conditions like tumors provokes severely destabilized, twisted, and leaky blood vessels,61, 63 features that resemble the defects produced by ADTRP deficiency. Our loss‐of and gain‐of ADTRP function assays in cell cultures stimulated with Wnt3a demonstrated that ADTRP negatively regulates the nuclear translocation of active β‐catenin and its transcriptional TCF/LEF coactivator activity, which is the critical effector of canonical Wnt signaling.58 We made similar discoveries in vivo, demonstrating significant temporally and spatially aberrant activation of the canonical Wnt pathway both in adtrp morphant zebrafish embryos and newborn Adtrp −/− BAT‐GAL z+ mice. By manipulating Wnt‐pathway members in vitro, we found that ADTRP most likely acts downstream of LRP6 phosphorylation but upstream of GSK‐3β. The mechanism through which ADTRP inhibits Wnt signaling awaits elucidation, but it may involve binding to Axin‐2 and/or signalosome formation, perhaps similarly to how ADTRP regulates TFPI distribution and activity in the EC plasma membrane.1
Wnt‐target genes consistently upregulated in all experimental settings were MMP9 and IL8, with the latter involved in mediation of abnormal angiogenesis and upregulation of MMP9 expression.64 ADTRP‐deficient cells, zebrafish, and mice all displayed significant increase in MMP‐9 expression, protein levels, and activity. We demonstrated that aberrant/ectopic activation of the Wnt/β‐catenin pathway and Wnt‐induced expression of MMP9 constitutes a major mechanism through which vascular deregulation occurred in Adtrp −/− mice.
Although Wnt/β‐catenin could activate MMP transcription in ECs,65 other cell types, such as MCs, also produce MMP‐9 and other proteases with vascular remodeling capabilities. Adtrp −/− pups display strikingly large accumulation of MCs near defective vasculature. MCs originate in the bone marrow, circulate in the blood as progenitors, egress into tissues, and maturate under the local control of factors like Kit ligand, interleukin‐3, and L1cam.66 The increased levels of Kit ligand, FcεRI, vascular cell adhesion molecule 1 (VCAM‐1), histidine decarboxylase (HDC), CD4, and CD11c detected in Adtrp −/− mice could probably mediate the enhanced recruitment, proliferation, and survival of MCs.67
The higher expression level of mature MC granule components measured in Adtrp −/− mice indicates enhanced terminal differentiation and maturation of MCs, processes that are increased by canonical Wnt signaling.62 In ADTRP deficiency, the normally highly regulated and temporally organized event of MC degranulation and components release52 could become a potent proinflammatory process. Mature MCs store both early EC activators, like histamine and TNF‐α, and enzymes involved in vascular permeability and remodeling,68 such as tryptases, chymases, carboxypeptidase A3 (CPA3), MMP‐9, and dipeptidyl peptidase‐4 (Dpp4). Enhanced release of fast‐acting histamine, which produces vascular hyperpermeability especially in postcapillary venules,68 and TNF‐α, which induces reactive oxygen species and release of active caspase‐3,69 could produce acute inflammation and endothelial dysfunction.68 Whether the heterogeneous electron density and shape of ECs observed by transmission electron microscopy in Adtrp −/− mice are induced by oxidative stress/reactive oxygen species remains to be determined. The initial acute events could be further amplified and extended in time and space by the long‐lasting MC proteases, which diffuse further away after exocytosis. MC proteases could continue to cleave junction proteins like β‐catenin70 and claudin‐5,71 degrade ECM and destabilize the vascular wall directly or through pro‐MMP activation, and increase perivascular inflammation, processes that are all associated with ADTRP deficiency.
One caveat of our study is that we describe vascular defects generated by ADTRP deficiency in zebrafish embryos versus mouse neonates. Given that the vascular phenotype is already present in newborn mice and some of them are stillborn, it is likely that the defects appeared during embryonic development, probably at late gestation. A comprehensive study of embryonic stage‐related vascular defects in Adtrp −/− mice is currently underway in our group, as are studies involving Adtrp conditional deletion in ECs using transgenic mice Tie2‐Cre and Cdh5‐Cre, and in MC using Mcpt5‐Cre or Cpa3‐Cre mice.
Our studies unveil a novel and critical role of ADTRP in vivo in vascular development and vessel integrity and function. ADTRP deficiency leads to: vessel dilation, junction defects, hemorrhage, defective PVC coverage, ECM degradation, and edema, defects that could produce partial penetrant lethality in zebrafish embryos and newborn mice.
We propose a major mechanism to explain the vascular dysfunction produced by ADTRP deficiency: the increased and/or temporally aberrant canonical Wnt signaling in ECs and MCs induces high levels of MMP‐9 and large accumulation of MCs whose degranulation products maintain and amplify the vascular defects and inflammation. Whether ADTRP in vivo deficiency could impact diseases involving pathological disruption of the vascular wall, such as inflammation, deep vein thrombosis/venous thromboembolism, sepsis, or cancer, remains to be discovered.
Sources of Funding
This work was supported by grants from Oklahoma Center for Adult Stem Cell Research (F. Lupu), National Institute of General Medical Sciences GM 121602 (F. Lupu), P30GM114731 (to F. Lupu with Rodger McEver as PI), and by OMRF Institutional Funds (F. Lupu).
Disclosures
None.
(J Am Heart Assoc. 2018;7:e010690 DOI: 10.1161/JAHA.118.010690.)
References
- 1. Lupu C, Zhu H, Popescu NI, Wren JD, Lupu F. Novel protein ADTRP regulates TFPI expression and function in human endothelial cells in normal conditions and in response to androgen. Blood. 2011;118:4463–4471. [DOI] [PMC free article] [PubMed] [Google Scholar]
- 2. Seo J, Kim J, Kim M. Cloning of androgen‐inducible gene 1 (AIG1) from human dermal papilla cells. Mol Cells. 2001;11:35–40. [PubMed] [Google Scholar]
- 3. Luo C, Pook E, Tang B, Zhang W, Li S, Leineweber K, Cheung SH, Chen Q, Bechem M, Hu JS, Laux V, Wang QK. Androgen inhibits key atherosclerotic processes by directly activating ADTRP transcription. Biochim Biophys Acta. 2017;1863:2319–2332. [DOI] [PMC free article] [PubMed] [Google Scholar]
- 4. Hinds DA, Buil A, Ziemek D, Martinez‐Perez A, Malik R, Folkersen L, Germain M, Malarstig A, Brown A, Soria JM, Dichgans M, Bing N, Franco‐Cereceda A, Souto JC, Dermitzakis ET, Hamsten A, Worrall BB, Tung JY; METASTROKE Consortium, INVENT Consortium , Sabater‐Lleal M. Genome‐wide association analysis of self‐reported events in 6135 individuals and 252 827 controls identifies 8 loci associated with thrombosis. Hum Mol Genet. 2016;25:1867–1874. [DOI] [PMC free article] [PubMed] [Google Scholar]
- 5. Luo C, Wang F, Ren X, Ke T, Xu C, Tang B, Qin S, Yao Y, Chen Q, Wang QK. Identification of a molecular signaling gene‐gene regulatory network between GWAS susceptibility genes ADTRP and MIA3/TANGO1 for coronary artery disease. Biochim Biophys Acta. 2017;1863:1640–1653. [DOI] [PMC free article] [PubMed] [Google Scholar]
- 6. Tayebi N, Ke T, Foo JN, Friedlander Y, Liu J, Heng CK. Association of single nucleotide polymorphism rs6903956 on chromosome 6p24.1 with coronary artery disease and lipid levels in different ethnic groups of the Singaporean population. Clin Biochem. 2013;46:755–759. [DOI] [PubMed] [Google Scholar]
- 7. Dechamethakun S, Ikeda S, Arai T, Sato N, Sawabe M, Muramatsu M. Associations between the CDKN2A/B, ADTRP and PDGFD polymorphisms and the development of coronary atherosclerosis in Japanese patients. J Atheroscler Thromb. 2014;21:680–690. [DOI] [PubMed] [Google Scholar]
- 8. Parsons WH, Kolar MJ, Kamat SS, Cognetta AB III, Hulce JJ, Saez E, Kahn BB, Saghatelian A, Cravatt BF. AIG1 and ADTRP are atypical integral membrane hydrolases that degrade bioactive FAHFAs. Nat Chem Biol. 2016;12:367–372. [DOI] [PMC free article] [PubMed] [Google Scholar]
- 9. Chen Q, Jin M, Yang F, Zhu J, Xiao Q, Zhang L. Matrix metalloproteinases: inflammatory regulators of cell behaviors in vascular formation and remodeling. Mediators Inflamm. 2013;2013:928315. [DOI] [PMC free article] [PubMed] [Google Scholar]
- 10. Poole TJ, Coffin JD. Vasculogenesis and angiogenesis: two distinct morphogenetic mechanisms establish embryonic vascular pattern. J Exp Zool. 1989;251:224–231. [DOI] [PubMed] [Google Scholar]
- 11. Flamme I, Frolich T, Risau W. Molecular mechanisms of vasculogenesis and embryonic angiogenesis. J Cell Physiol. 1997;173:206–210. [DOI] [PubMed] [Google Scholar]
- 12. Risau W. Mechanisms of angiogenesis. Nature. 1997;386:671–674. [DOI] [PubMed] [Google Scholar]
- 13. Bonnans C, Chou J, Werb Z. Remodelling the extracellular matrix in development and disease. Nat Rev Mol Cell Biol. 2014;15:786–801. [DOI] [PMC free article] [PubMed] [Google Scholar]
- 14. Carmeliet P, Jain RK. Molecular mechanisms and clinical applications of angiogenesis. Nature. 2011;473:298–307. [DOI] [PMC free article] [PubMed] [Google Scholar]
- 15. Corada M, Nyqvist D, Orsenigo F, Caprini A, Giampietro C, Taketo MM, Iruela‐Arispe ML, Adams RH, Dejana E. The Wnt/beta‐catenin pathway modulates vascular remodeling and specification by upregulating Dll4/Notch signaling. Dev Cell. 2010;18:938–949. [DOI] [PMC free article] [PubMed] [Google Scholar]
- 16. Dejana E. The role of wnt signaling in physiological and pathological angiogenesis. Circ Res. 2010;107:943–952. [DOI] [PubMed] [Google Scholar]
- 17. Edgell CJ, McDonald CC, Graham JB. Permanent cell line expressing human factor VIII‐related antigen established by hybridization. Proc Natl Acad Sci USA. 1983;80:3734–3737. [DOI] [PMC free article] [PubMed] [Google Scholar]
- 18. Lupu C, Hu X, Lupu F. Caveolin‐1 enhances tissue factor pathway inhibitor exposure and function on the cell surface. J Biol Chem. 2005;280:22308–22317. [DOI] [PubMed] [Google Scholar]
- 19. Popescu NI, Lupu C, Lupu F. Extracellular protein disulfide isomerase regulates coagulation on endothelial cells through modulation of phosphatidylserine exposure. Blood. 2010;116:993–1001. [DOI] [PMC free article] [PubMed] [Google Scholar]
- 20. Takashima A. Establishment of fibroblast cultures. Curr Protoc Cell Biol. 2001;Chapter 2:Unit 2.1. DOI: 10.1002/0471143030.cb0201s00. [DOI] [PubMed] [Google Scholar]
- 21. Valenzuela DM, Murphy AJ, Frendewey D, Gale NW, Economides AN, Auerbach W, Poueymirou WT, Adams NC, Rojas J, Yasenchak J, Chernomorsky R, Boucher M, Elsasser AL, Esau L, Zheng J, Griffiths JA, Wang X, Su H, Xue Y, Dominguez MG, Noguera I, Torres R, Macdonald LE, Stewart AF, DeChiara TM, Yancopoulos GD. High‐throughput engineering of the mouse genome coupled with high‐resolution expression analysis. Nat Biotechnol. 2003;21:652–659. [DOI] [PubMed] [Google Scholar]
- 22. Kimmel CB, Ballard WW, Kimmel SR, Ullmann B, Schilling TF. Stages of embryonic development of the zebrafish. Dev Dyn. 1995;203:253–310. [DOI] [PubMed] [Google Scholar]
- 23. Lawson ND, Weinstein BM. In vivo imaging of embryonic vascular development using transgenic zebrafish. Dev Biol. 2002;248:307–318. [DOI] [PubMed] [Google Scholar]
- 24. Galardy RE, Grobelny D, Foellmer HG, Fernandez LA. Inhibition of angiogenesis by the matrix metalloprotease inhibitor N‐[2R‐2‐(hydroxamidocarbonymethyl)‐4‐methylpentanoyl)]‐L‐tryptophan methylamide. Cancer Res. 1994;54:4715–4718. [PubMed] [Google Scholar]
- 25. Grobelny D, Poncz L, Galardy RE. Inhibition of human skin fibroblast collagenase, thermolysin, and Pseudomonas aeruginosa elastase by peptide hydroxamic acids. Biochemistry. 1992;31:7152–7154. [DOI] [PubMed] [Google Scholar]
- 26. Galardy RE, Cassabonne ME, Giese C, Gilbert JH, Lapierre F, Lopez H, Schaefer ME, Stack R, Sullivan M, Summers B. Low molecular weight inhibitors in corneal ulceration. Ann N Y Acad Sci. 1994;732:315–323. [DOI] [PubMed] [Google Scholar]
- 27. Bai S, Thummel R, Godwin AR, Nagase H, Itoh Y, Li L, Evans R, McDermott J, Seiki M, Sarras MP Jr. Matrix metalloproteinase expression and function during fin regeneration in zebrafish: analysis of MT1‐MMP, MMP2 and TIMP2. Matrix Biol. 2005;24:247–260. [DOI] [PubMed] [Google Scholar]
- 28. Li R, Beebe T, Jen N, Yu F, Takabe W, Harrison M, Cao H, Lee J, Yang H, Han P, Wang K, Shimizu H, Chen J, Lien CL, Chi NC, Hsiai TK. Shear stress‐activated Wnt‐angiopoietin‐2 signaling recapitulates vascular repair in zebrafish embryos. Arterioscler Thromb Vasc Biol. 2014;34:2268–2275. [DOI] [PMC free article] [PubMed] [Google Scholar]
- 29. Chen B, Dodge ME, Tang W, Lu J, Ma Z, Fan CW, Wei S, Hao W, Kilgore J, Williams NS, Roth MG, Amatruda JF, Chen C, Lum L. Small molecule‐mediated disruption of Wnt‐dependent signaling in tissue regeneration and cancer. Nat Chem Biol. 2009;5:100–107. [DOI] [PMC free article] [PubMed] [Google Scholar]
- 30. Wang L, Wang X, Wang L, Yousaf M, Li J, Zuo M, Yang Z, Gou D, Bao B, Li L, Xiang N, Jia H, Xu C, Chen Q, Wang QK. Identification of a new adtrp1‐tfpi regulatory axis for the specification of primitive myelopoiesis and definitive hematopoiesis. FASEB J. 2018;32:183–194. [DOI] [PMC free article] [PubMed] [Google Scholar]
- 31. Robu ME, Larson JD, Nasevicius A, Beiraghi S, Brenner C, Farber SA, Ekker SC. p53 activation by knockdown technologies. PLoS Genet. 2007;3:e78. [DOI] [PMC free article] [PubMed] [Google Scholar]
- 32. Rosen JN, Sweeney MF, Mably JD. Microinjection of zebrafish embryos to analyze gene function. J Vis Exp. 2009;25:1115. [DOI] [PMC free article] [PubMed] [Google Scholar]
- 33. Yuan S, Sun Z. Microinjection of mRNA and morpholino antisense oligonucleotides in zebrafish embryos. J Vis Exp. 2009;27:1113. [DOI] [PMC free article] [PubMed] [Google Scholar]
- 34. Kim WT, Kim H, Katanaev VL, Joon Lee S, Ishitani T, Cha B, Han JK, Jho EH. Dual functions of DP1 promote biphasic Wnt‐on and Wnt‐off states during anteroposterior neural patterning. EMBO J. 2012;31:3384–3397. [DOI] [PMC free article] [PubMed] [Google Scholar]
- 35. Jowett T, Lettice L. Whole‐mount in situ hybridizations on zebrafish embryos using a mixture of digoxigenin‐ and fluorescein‐labelled probes. Trends Genet. 1994;10:73–74. [DOI] [PubMed] [Google Scholar]
- 36. Thisse C, Thisse B. High‐resolution in situ hybridization to whole‐mount zebrafish embryos. Nat Protoc. 2008;3:59–69. [DOI] [PubMed] [Google Scholar]
- 37. Ghafoory S, Varshney R, Robison T, Kouzbari K, Woolington S, Murphy B, Xia L, Ahamed J. Platelet TGF‐beta1 deficiency decreases liver fibrosis in a mouse model of liver injury. Blood Adv. 2018;2:470–480. [DOI] [PMC free article] [PubMed] [Google Scholar]
- 38. Sorrells S, Toruno C, Stewart RA, Jette C. Analysis of apoptosis in zebrafish embryos by whole‐mount immunofluorescence to detect activated Caspase 3. J Vis Exp. 2013;82:e51060. [DOI] [PMC free article] [PubMed] [Google Scholar]
- 39. Lupu C, Westmuckett AD, Peer G, Ivanciu L, Zhu H, Taylor FB Jr, Lupu F. Tissue factor‐dependent coagulation is preferentially up‐regulated within arterial branching areas in a baboon model of Escherichia coli sepsis. Am J Pathol. 2005;167:1161–1172. [DOI] [PMC free article] [PubMed] [Google Scholar]
- 40. Renier N, Wu Z, Simon DJ, Yang J, Ariel P, Tessier‐Lavigne M. iDISCO: a simple, rapid method to immunolabel large tissue samples for volume imaging. Cell. 2014;159:896–910. [DOI] [PubMed] [Google Scholar]
- 41. Silasi‐Mansat R, Zhu H, Popescu NI, Peer G, Sfyroera G, Magotti P, Ivanciu L, Lupu C, Mollnes TE, Taylor FB, Kinasewitz G, Lambris JD, Lupu F. Complement inhibition decreases the procoagulant response and confers organ protection in a baboon model of Escherichia coli sepsis. Blood. 2010;116:1002–1010. [DOI] [PMC free article] [PubMed] [Google Scholar]
- 42. Lupu F, Danaricu I, Simionescu N. Development of intracellular lipid deposits in the lipid‐laden cells of atherosclerotic lesions. A cytochemical and ultrastructural study. Atherosclerosis. 1987;67:127–142. [DOI] [PubMed] [Google Scholar]
- 43. Yi CF, Gosiewska A, Burtis D, Geesin J. Incorporation of fluorescent enzyme substrates in agarose gel for in situ zymography. Anal Biochem. 2001;291:27–33. [DOI] [PubMed] [Google Scholar]
- 44. Detrich HW III, Kieran MW, Chan FY, Barone LM, Yee K, Rundstadler JA, Pratt S, Ransom D, Zon LI. Intraembryonic hematopoietic cell migration during vertebrate development. Proc Natl Acad Sci USA. 1995;92:10713–10717. [DOI] [PMC free article] [PubMed] [Google Scholar]
- 45. Liu Y, Jennings NL, Dart AM, Du XJ. Standardizing a simpler, more sensitive and accurate tail bleeding assay in mice. World J Exp Med. 2012;2:30–36. [DOI] [PMC free article] [PubMed] [Google Scholar]
- 46. Tang H, Ivanciu L, Popescu N, Peer G, Hack E, Lupu C, Taylor FB Jr, Lupu F. Sepsis‐induced coagulation in the baboon lung is associated with decreased tissue factor pathway inhibitor. Am J Pathol. 2007;171:1066–1077. [DOI] [PMC free article] [PubMed] [Google Scholar]
- 47. Ding L, Zhang Y, Tatum R, Chen YH. Detection of tight junction barrier function in vivo by biotin. Methods Mol Biol. 2011;762:91–100. [DOI] [PMC free article] [PubMed] [Google Scholar]
- 48. Cowan CE, Kohler EE, Dugan TA, Mirza MK, Malik AB, Wary KK. Kruppel‐like factor‐4 transcriptionally regulates VE‐cadherin expression and endothelial barrier function. Circ Res. 2010;107:959–966. [DOI] [PMC free article] [PubMed] [Google Scholar]
- 49. Kobayashi S, Yamashita T, Ohneda K, Nagano M, Kimura K, Nakai H, Poellinger L, Ohneda O. Hypoxia‐inducible factor‐3alpha promotes angiogenic activity of pulmonary endothelial cells by repressing the expression of the VE‐cadherin gene. Genes Cells. 2015;20:224–241. [DOI] [PubMed] [Google Scholar]
- 50. Davis GE, Senger DR. Endothelial extracellular matrix: biosynthesis, remodeling, and functions during vascular morphogenesis and neovessel stabilization. Circ Res. 2005;97:1093–1107. [DOI] [PubMed] [Google Scholar]
- 51. Xu J, Shi GP. Vascular wall extracellular matrix proteins and vascular diseases. Biochim Biophys Acta. 2014;1842:2106–2119. [DOI] [PMC free article] [PubMed] [Google Scholar]
- 52. Haenisch B, Nothen MM, Molderings GJ. Systemic mast cell activation disease: the role of molecular genetic alterations in pathogenesis, heritability and diagnostics. Immunology. 2012;137:197–205. [DOI] [PMC free article] [PubMed] [Google Scholar]
- 53. Kashiwada T, Fukuhara S, Terai K, Tanaka T, Wakayama Y, Ando K, Nakajima H, Fukui H, Yuge S, Saito Y, Gemma A, Mochizuki N. Beta‐Catenin‐dependent transcription is central to Bmp‐mediated formation of venous vessels. Development. 2015;142:497–509. [DOI] [PubMed] [Google Scholar]
- 54. Eisen JS, Smith JC. Controlling morpholino experiments: don't stop making antisense. Development. 2008;135:1735–1743. [DOI] [PubMed] [Google Scholar]
- 55. Rossi A, Kontarakis Z, Gerri C, Nolte H, Holper S, Kruger M, Stainier DY. Genetic compensation induced by deleterious mutations but not gene knockdowns. Nature. 2015;524:230–233. [DOI] [PubMed] [Google Scholar]
- 56. Alexander JS, Elrod JW. Extracellular matrix, junctional integrity and matrix metalloproteinase interactions in endothelial permeability regulation. J Anat. 2002;200:561–574. [DOI] [PMC free article] [PubMed] [Google Scholar]
- 57. Komarova YA, Kruse K, Mehta D, Malik AB. Protein interactions at endothelial junctions and signaling mechanisms regulating endothelial permeability. Circ Res. 2017;120:179–206. [DOI] [PMC free article] [PubMed] [Google Scholar]
- 58. Kajiguchi T, Lee S, Lee MJ, Trepel JB, Neckers L. KIT regulates tyrosine phosphorylation and nuclear localization of beta‐catenin in mast cell leukemia. Leuk Res. 2008;32:761–770. [DOI] [PMC free article] [PubMed] [Google Scholar]
- 59. Taddei A, Giampietro C, Conti A, Orsenigo F, Breviario F, Pirazzoli V, Potente M, Daly C, Dimmeler S, Dejana E. Endothelial adherens junctions control tight junctions by VE‐cadherin‐mediated upregulation of claudin‐5. Nat Cell Biol. 2008;10:923–934. [DOI] [PubMed] [Google Scholar]
- 60. Shivanna S, Harrold I, Shashar M, Meyer R, Kiang C, Francis J, Zhao Q, Feng H, Edelman ER, Rahimi N, Chitalia VC. The c‐Cbl ubiquitin ligase regulates nuclear beta‐catenin and angiogenesis by its tyrosine phosphorylation mediated through the Wnt signaling pathway. J Biol Chem. 2015;290:12537–12546. [DOI] [PMC free article] [PubMed] [Google Scholar]
- 61. Clevers H, Nusse R. Wnt/beta‐catenin signaling and disease. Cell. 2012;149:1192–1205. [DOI] [PubMed] [Google Scholar]
- 62. Yamaguchi T, Nishijima M, Tashiro K, Kawabata K. Wnt‐beta‐catenin signaling promotes the maturation of mast cells. Biomed Res Int. 2016;2016:2048987. [DOI] [PMC free article] [PubMed] [Google Scholar]
- 63. Giannotta M, Trani M, Dejana E. VE‐cadherin and endothelial adherens junctions: active guardians of vascular integrity. Dev Cell. 2013;26:441–454. [DOI] [PubMed] [Google Scholar]
- 64. Li A, Dubey S, Varney ML, Dave BJ, Singh RK. IL‐8 directly enhanced endothelial cell survival, proliferation, and matrix metalloproteinases production and regulated angiogenesis. J Immunol. 2003;170:3369–3376. [DOI] [PubMed] [Google Scholar]
- 65. Munshi HG, Stack MS. Reciprocal interactions between adhesion receptor signaling and MMP regulation. Cancer Metastasis Rev. 2006;25:45–56. [DOI] [PubMed] [Google Scholar]
- 66. Gschwandtner M, Paulitschke V, Mildner M, Brunner PM, Hacker S, Eisenwort G, Sperr WR, Valent P, Gerner C, Tschachler E. Proteome analysis identifies L1CAM/CD171 and DPP4/CD26 as novel markers of human skin mast cells. Allergy. 2017;72:85–97. [DOI] [PubMed] [Google Scholar]
- 67. Dahlin JS, Hallgren J. Mast cell progenitors: origin, development and migration to tissues. Mol Immunol. 2015;63:9–17. [DOI] [PubMed] [Google Scholar]
- 68. Kunder CA, St John AL, Abraham SN. Mast cell modulation of the vascular and lymphatic endothelium. Blood. 2011;118:5383–5393. [DOI] [PMC free article] [PubMed] [Google Scholar]
- 69. Wiggins‐Dohlvik K, Merriman M, Shaji CA, Alluri H, Grimsley M, Davis ML, Smith RW, Tharakan B. Tumor necrosis factor‐alpha disruption of brain endothelial cell barrier is mediated through matrix metalloproteinase‐9. Am J Surg. 2014;208:954–960. [DOI] [PubMed] [Google Scholar]
- 70. Sawant DA, Tharakan B, Wilson RL, Stagg HW, Hunter FA, Childs EW. Regulation of tumor necrosis factor‐alpha‐induced microvascular endothelial cell hyperpermeability by recombinant B‐cell lymphoma‐extra large. J Surg Res. 2013;184:628–637. [DOI] [PMC free article] [PubMed] [Google Scholar]
- 71. Zehendner CM, Librizzi L, de Curtis M, Kuhlmann CR, Luhmann HJ. Caspase‐3 contributes to ZO‐1 and Cl‐5 tight‐junction disruption in rapid anoxic neurovascular unit damage. PLoS One. 2011;6:e16760. [DOI] [PMC free article] [PubMed] [Google Scholar]