Abstract
Objective
To examine the association between neuroimaging features in a predominantly middle-aged cohort and risk of late-life dementia.
Methods
Cerebral MRI was performed on 1,881 individuals with no history of stroke from the Atherosclerosis Risk in Communities Study cohort in 1993 to 1995. White matter hyperintensities (WMH), ventricular size, and sulcal size were graded on a semiquantitative scale, and presence of silent cerebral infarcts was identified. In 2011 to 2013, dementia was determined from neuropsychological testing, informant interview, hospital ICD-9 codes, and death certificate dementia codes. Cox regression was used to evaluate associations between MRI findings and dementia.
Results
Over 20 years of follow-up, dementia developed in 279 participants (14.8%). High-grade WMH and high-grade ventricular size were independently associated with increased dementia risk (hazard ratio [HR] for WMH 1.62, 95% confidence interval [CI] 1.14–2.30; HR for ventricular size 1.46, 95% CI 1.06–2.03). There was an increased risk of dementia for diabetic participants with silent infarcts (HR 2.56, 95% CI 1.23–5.31) but not among nondiabetic participants (HR 0.87, 95% CI 0.56–1.37). Each 1-unit increase in the total number of high-grade cerebral abnormalities at baseline (count values range 0–4) showed increased dementia risk, with a considerably higher risk among diabetic participants (HR for diabetes mellitus 1.97, 95% CI 1.44–2.69; HR for no diabetes mellitus 1.20, 95% CI 1.03–1.39).
Conclusion
In adults without evidence of clinical stroke, MRI-detected WMH and ventricular enlargement in midlife may represent markers of brain injury that increase risk for later-life cognitive impairment. The presence of diabetes mellitus may modify the association between silent infarcts and dementia.
The neuropathology of dementia in late life appears to involve a complex interplay between Alzheimer disease pathology, other neurodegenerative pathologies, and microvascular brain damage, which may overlap and interact to amplify the risk of impairment.1 Ventricular enlargement, sulcal widening, white matter hyperintensities (WMH), and subclinical brain infarcts that are detectable by MRI are not uncommon in asymptomatic populations beginning in middle age.2,3 Silent infarcts, the majority of which are lacunar, are far more common than larger territorial strokes in the general population.4 There is growing evidence that these imaging features may be associated with an increased risk for cognitive deficits in late life.5–7
While the majority of studies have demonstrated cross-sectional associations between MRI findings and cognitive impairment in older ages (≥60 years), few have reported these relationships across the midlife to late-life transition. Because evidence suggests that the pathogenesis of most late-life dementia begins years, if not decades, before diagnosis, it has become critically important to identify predictive disease markers of the brain that best detect progression from the preclinical to the clinical stages of dementia. This preclinical phase provides a crucial time frame for prevention and therapeutic intervention.
We investigated the association between MRI-detected WMH, ventricular enlargement, sulcal widening, and presence/absence of subclinical infarcts in a large biracial cohort of stroke-free, predominately middle-aged individuals and progression to dementia during a 20-year observational follow-up.
Methods
Study population
The current analyses involve a subset of the original Atherosclerosis Risk in Communities (ARIC) study, a longitudinal, predominantly biracial cohort study of women and men 45 to 64 years of age at baseline who were recruited between 1987 and 1989 (visit 1) from 4 US communities: suburbs of Minneapolis, MN; Forsyth County, North Carolina; Washington County, Maryland; and Jackson, MS.8 After the visit 1 examination, there were 4 additional examinations: visit 2 (1990–1992), visit 3 (1993–1995), visit 4 (1996–1998), and visit 5 (2011–2013). During the third ARIC visit, participants ≥55 years of age from the study sites in North Carolina and Mississippi were invited for a brain MRI. Of the 2,892 participants meeting the MRI inclusion criteria, 1,934 participants (67%) completed imaging. This MRI visit (visit 3) constitutes the baseline of the present analysis. Cognitive function in our sample was evaluated at visits 3, 4, and 5 with participants undergoing extensive cognitive and neurologic assessment at visit 5 to determine dementia status (figure). Participants were excluded from the current analysis if they were not black or white (n = 4), if they reported a history of physician-diagnosed stroke or TIA (n = 46), or if they had incomplete magnetic resonance (MR) data (n = 3), leaving a total of 1,881 individuals for this analysis.
Figure. ARIC study timeline relevant to current analysis.
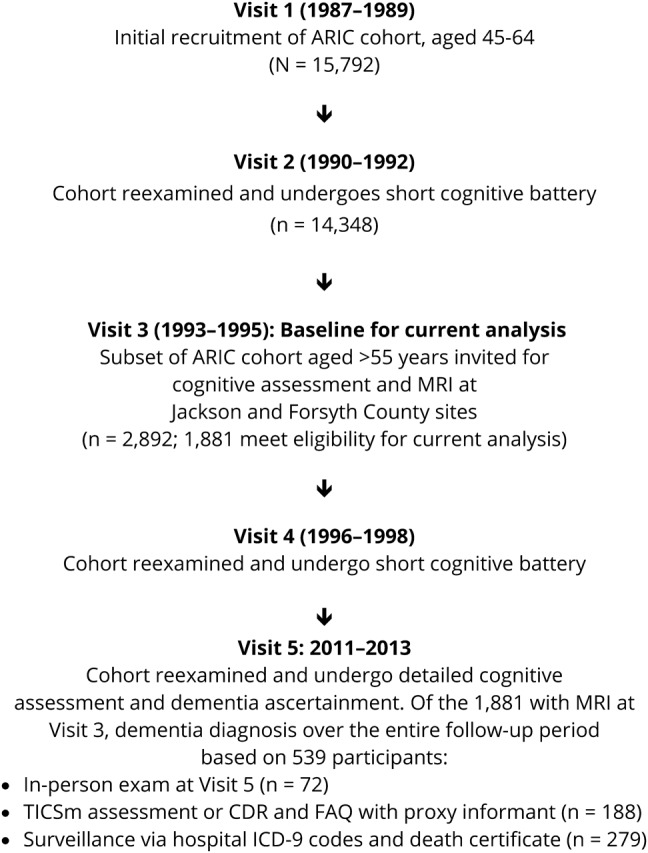
ARIC = Atherosclerosis Risk in Communities; CDR = Clinical Dementia Rating; FAQ = Functional Activities Questionnaire; TICSm = Telephone Interview for Cognitive Status–modified.
Standard protocol approvals, registrations, and patient consents
All study participants provided written informed consent to participate based on local standards at Wake Forest University School of Medicine or the University of Mississippi Medical Center.
MRI protocol and image analysis
Quantitative volumetric brain imaging was not available at the time that the scans were obtained; consequently, our analyses used visual ratings of WMH, ventricular volume, and sulcal width. The scans were performed at 1.5T and included axial 5-mm contiguous T1-, T2-, and proton density–weighted images. The images were obtained on GE (Chicago, IL) or Picker (Cleveland, OH) scanners and were interpreted by neuroradiologists at the ARIC MRI Reading Center at Johns Hopkins Medical Institutions (Baltimore, MD) using a scoring protocol developed and validated by the Cardiovascular Health Study.9 Images were interpreted by different primary and secondary readers who were blinded to participants' age, race, sex, vascular risk factors, and previous imaging findings. Primary readers were board-certified radiologists with training in neuroradiology; secondary readers included the same radiologists plus an experienced neuroimaging technician. Interrater reliability of ventricles (κ = 0.89) and WMH (κ = 0.81) was higher than that of sulci (κ = 0.66).10
WMH grades were visually assessed as the total volume of subcortical and periventricular white matter high signal abnormality and graded by comparison with 8 reference scans that successively worsened from barely detectable white matter changes (grade 1) to extensive changes (grade 8). Images with no white matter changes received grade 0, and those with changes worse than grade 8 received grade 9. Ventricular size was also graded on a semiquantitative 10-point scale by matching the participant's T1-weighted images with a series of 8 reference scans that successively increased in size from presumably normal (grade 1) to severe atrophy (grade 8). Images considered to have ventricles smaller than those in grade 1 received grade 0 and those larger than grade 8 received grade 9. Similarly, sulcal size was assessed by comparison with 8 reference scans with successively worsening size, with grades 0 and 9 assigned as for ventricular size. Reference images for WMH, ventricular, and sulcal size have been published previously.11 Subclinical infarcts, the majority of which were lacunar (>80%), were defined as having a ≥3-mm focal lesion without mass effect and with an arterial vascular distribution (if cortical) that was hyperintense to gray matter on both proton-density and T2-weighted images.4
Dementia assessment
Detailed methods of dementia classification have been previously described.12 Briefly, dementia status was determined by an expert committee, which included physicians and neuropsychologists, using detailed neuropsychological tests at ARIC visit 5 (2011–2013), previous cognitive testing performed at visits 3 (1993–1996) and 4 (1996–1998), medical and family histories, and informant interviews that included the Clinical Dementia Rating and/or Functional Assessment Questionnaire. Study participants who did not attend visit 5 were contacted by phone and administered the modified Telephone Interview for Cognitive Status questionnaire.13,14 For deceased participants or those who could not be reached, dementia status was ascertained by administration of the Clinical Dementia Rating scale to proxy informants, surveillance of hospitalizations with dementia ICD-9 codes, and dementia codes on death certificates (figure).
Dementia date was defined as the earliest of either a hospitalization date with an ICD-9 code for dementia, death date if a dementia code was listed on the death certificate, date of telephone communication with the participant or proxy with indication of dementia, or date of visit 5 if dementia was indicated at this visit but not at previous visits. Participants who were evaluated and classified at visit 5 as not having dementia were censored at visit 5. Participants who did not attend visit 5 were censored at the last study contact date when there was no indication of dementia.
Covariates
Diabetes status at the MRI visit 3 (the present study baseline) was defined as a fasting glucose of ≥126 mg/dL, nonfasting glucose of ≥200 mg/dL, a self-reported history of physician-diagnosed diabetes mellitus, or use of medications to treat diabetes. Hypertension status at visit 3 was defined as systolic blood pressure ≥140 mm Hg, diastolic blood pressure ≥90 mm Hg, or use of antihypertensive medications. APOE ε4 was dichotomized to represent the presence or absence of an ε4 allele. Education level, obtained at the first ARIC visit, was categorized as less than high school, high school or vocational school, or completed college. Smoking status at visit 3 was categorized as current, former, or never smoker.
Statistical analysis
To distinguish between normal and abnormal MRI findings, the graded MRI variables (WMH, ventricular size, and sulcal size) were dichotomized into no or mild-grade abnormality (low grade) and moderate or higher-grade abnormality (high grade). To differentiate between normal and abnormal MRI findings, we dichotomized the MRI variables at ≈1.5 SDs from the mean into low grade (no or mild-grade abnormality) and high grade (moderate or higher-grade abnormality). High grade was defined for each abnormality as follows: WMH grade 3 or higher, ventricular size grade 4 or higher, sulcal size grade 3 or higher, and presence vs absence of infarcts. These cut points were chosen on the basis of previous studies.6,15 We created a “cerebral-abnormality burden score,” defined as the count of high-grade cerebral abnormalities (score values range 0–4), to explore the association of the burden score with dementia risk.
Cox proportional hazards regression was used to investigate the association of the MR measures with rate of incident dementia during the follow-up period. The Cox models were fit with each participant contributing time at risk starting from the MR measurements (visit 3) until time of dementia diagnosis or censoring. We evaluated 3 models for each of the individual MR measures. Model 1 was adjusted for age, sex, race/ethnicity, education, and APOE ε4 status (study site was not statistically significant after adjustment for race/ethnicity). Model 2 was adjusted for all variables in model 1 plus smoking status, diabetes status, and hypertension. Model 3 was adjusted for all variables in model 2 plus the 3 other MR measures. Heterogeneity of associations with the MR abnormalities by diabetes status, hypertension, sex, race/ethnicity, age, and APOE ε4 status was assessed by including product terms in the models.
Data availability
A public-use ARIC dataset is available through BioLINCC. More information on the data is available from the authors on reasonable request.
Results
Of the 1,881 participants in this analysis, 279 (14.8%) were diagnosed with dementia and 1,602 were censored. Of those censored, 438 were identified as cognitively normal (only among those who were evaluated during visit 5). Maximum follow-up was 21 years, and the median follow-up time was 18 years (interquartile interval 14–19).
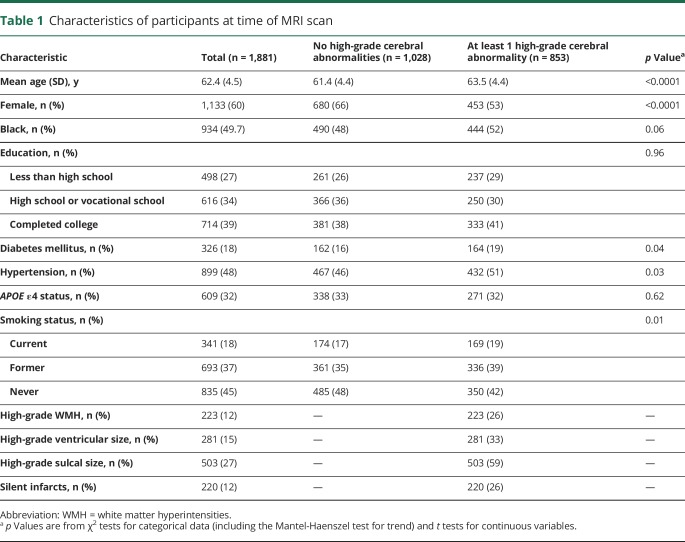
Compared to study participants who had no high-grade cerebral abnormalities at the MR evaluation, those who had a least 1 abnormality were older and were more likely to be male, to have diabetes mellitus and hypertension, and to be current or former smokers (table 1). There were no significant differences in race/ethnicity, education, or APOE ε4 status between the groups. Of the total sample, 12% had high-grade WMH, 15% had high-grade ventricular enlargement, 27% had high-grade sulcal widening, and 12% had silent infarcts.
Table 1.
Characteristics of participants at time of MRI scan
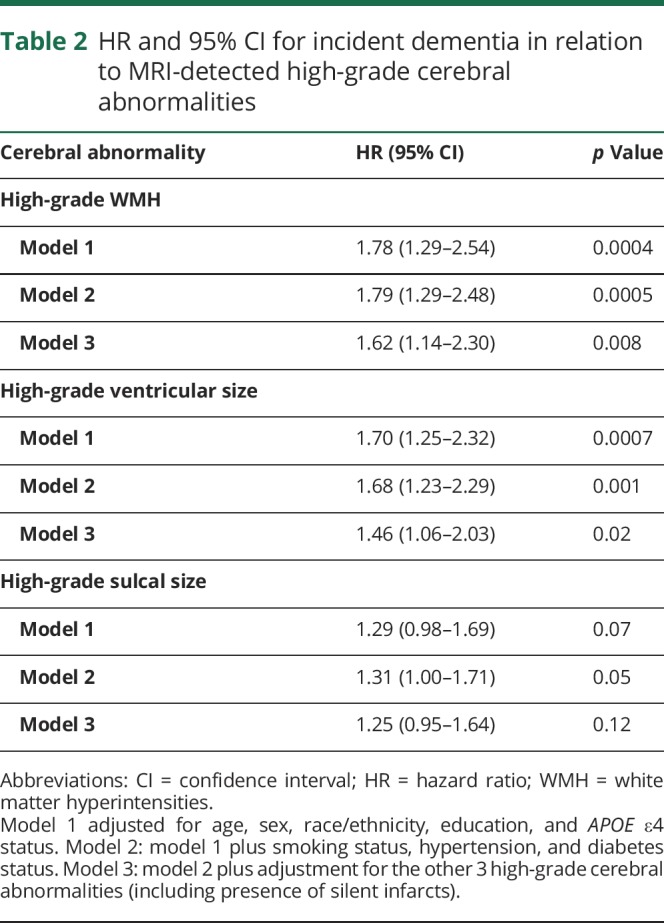
High-grade (relative to low-grade) WMH and ventricular enlargement were each significantly associated with dementia risk in models adjusted for age, sex, race/ethnicity, education, and APOE ε4 status, with little attenuation after further adjustment for vascular risk factors (table 2). High-grade WMH and ventricular enlargement remained independently associated with dementia risk after further adjustment for the other MRI measures (adjusted hazard ratio [HR] for WMH 1.62, 95% confidence interval [CI] 1.14–2.30, p = 0.008; adjusted HR for ventricular enlargement 1.46, 95% CI 1.06–2.03, p = 0.02). High-grade sulcal widening was nominally associated with dementia risk in models adjusted for age, sex, race/ethnicity, education, APOE ε4 status, smoking status, hypertension, and diabetes status but did not attain statistical significance in the fully adjusted model (adjusted HR 1.25, 95% CI 0.95–1.64, p = 0.12).
Table 2.
HR and 95% CI for incident dementia in relation to MRI-detected high-grade cerebral abnormalities
There was a significant interaction between diabetes status and silent infarcts and dementia risk (p = 0.02 for the interaction term) in the model adjusted for age, sex, race/ethnicity, education, and APOE ε4 status (model 1), so these results are presented stratified by diabetes status in table 3. There was a significantly increased risk of dementia for diabetic participants with silent infarcts after adjustment for age, sex, race/ethnicity, education, APOE ε4 status, smoking, and hypertension (adjusted HR for diabetes mellitus 2.56, 95% CI 1.23–5.31, p = 0.01) but no evidence of increased risk for nondiabetic participants with infarcts (adjusted HR for no diabetes mellitus 0.87, 95% CI 0.56–1.37, p = 0.55). These results were moderately attenuated after further adjustment for the other MRI measures in the model.
Table 3.
HR and 95% CI for incident dementia in relation to MRI-detected silent infarcts, stratified by diabetes status at the MRI visit
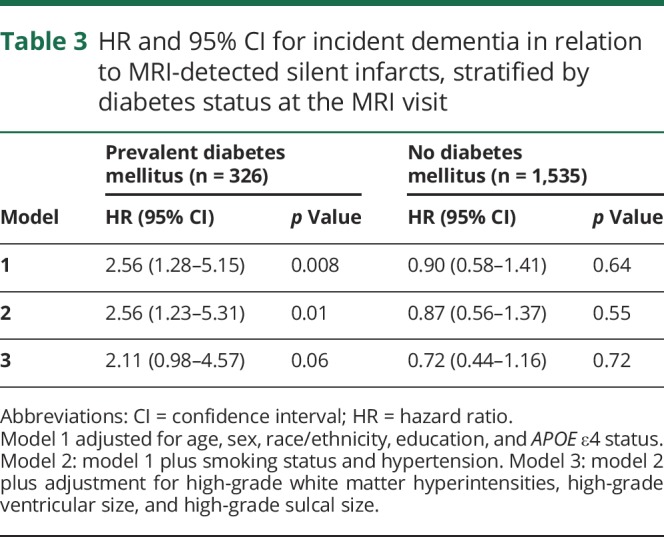
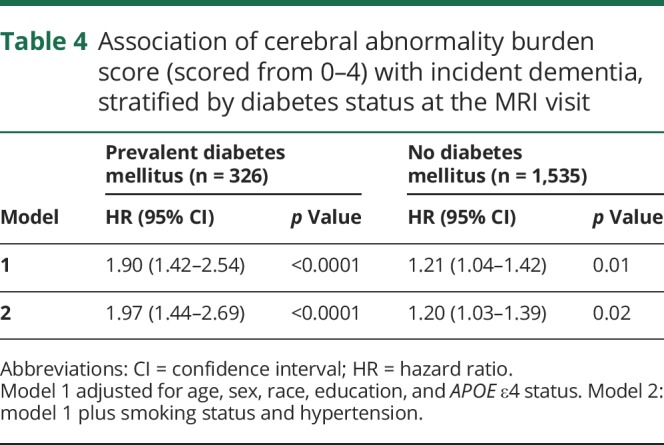
Table 4 shows the association between the sum of high-grade cerebral abnormalities (value range 0–4) for participants at the MR visit and dementia risk. There was evidence of a significant interaction between prevalent diabetes status and the sum of high-grade abnormalities on dementia risk (p = 0.02 for interaction term) in the model adjusted for age, sex, race/ethnicity, and APOE ε4 status (model 1). Although an increased number of MRI abnormalities was significantly associated with greater dementia risk among all participants, the risk was considerably higher among participants with diabetes mellitus. For diabetic participants, each 1-unit increase in the total number of high-grade cerebral abnormalities was associated with a doubling of dementia risk (adjusted HR 1.97, 95% CI 1.44, 2.69, p < 0.0001). For nondiabetic participants, each increase in the total was associated with a 20% increase in dementia risk (adjusted HR 1.20, 95% CI 1.03–1.39, p = 0.02).
Table 4.
Association of cerebral abnormality burden score (scored from 0–4) with incident dementia, stratified by diabetes status at the MRI visit
Discussion
In this large cohort of black and white adults followed up for 20 years, there was an increased rate of dementia for study participants who had a greater burden of high-grade imaging findings in midlife. The presence of high-grade WMH and ventricular enlargement had the most robust individual associations with development of dementia, and these associations were independent of other contributors to cognitive impairment, including vascular risk factors. The presence of silent infarcts, the vast majority (>80%) of which were lacunar, during midlife increased dementia risk during follow-up but only among participants with diabetes mellitus. Our data did not support differential relationships of silent high-grade cerebral abnormalities and dementia risk by sex, race/ethnicity, age, APOE ε4 status, or hypertension.
Although many of our cohort (55%) had no high-grade abnormalities at study baseline, of those who had ≥1 such abnormalities, 32% had coexisting abnormalities. Our findings of a significant increase in dementia risk with each concomitant abnormality highlight that dementia risk is graded across the aggregate of attendant abnormalities and furthermore that the coexistence of cerebral abnormalities may itself be an important risk factor for dementia. While we did not have sufficient power to examine every combination of the 4 high-grade abnormalities separately, we note that every possible 2-way, 3-way, and 4-way combination existed in our cohort, with the most prevalent combination being the joint presence of high-grade ventricular and sulcal enlargement (31% of participants with multiple abnormalities had this combination).
Our results are similar to the longitudinal findings in the Rotterdam Scan Study and the Cardiovascular Health Cognition Study, both of which showed an increased risk of dementia with greater severity of white matter lesions and greater ventricular enlargement at study baseline among older adults (age ≥60 years).16–18 Excessive WMH and MRI-defined brain infarcts were also significantly associated with dementia risk in the Framingham Offspring Study, a community-based cohort study of middle-aged adults.19 In contrast to these earlier studies, we found that the presence of silent brain infarcts was associated with increased dementia risk only among participants with diabetes mellitus rather than among all participants.
Previous cohort studies of MRI findings and dementia risk have focused primarily on findings in late life and have had shorter follow-up periods. Strengths of this study include a large biracial cohort of individuals with 20 years of follow-up across the midlife to late-life transition. Another strength of this study includes the extensive characterization of the ARIC study population, which facilitated our adjustment for key potential confounders; nonetheless, we cannot rule out the possibility of residual confounding.
An important limitation is that quantitative volumetric brain imaging was not available at the time that the scans were obtained; consequently, our analyses used visual ratings of WMH, ventricular volume, and sulcal width. However, MRI scans were interpreted by trained neuroradiologists using a standardized grading system previously validated and blinded to participants' information. Furthermore, the semiquantitative 10-point scale used in our study captures a greater range of gradation of the MRI findings than less discretized grading systems. Other limitations include lack of coronal MRIs and hippocampal atrophy measures, as well as partial reliance on self-report of diabetes status. In addition, our findings are subject to type I error arising from multiple testing, particularly in the stratified analyses in which decreased sample sizes make chance findings more likely to occur. Finally, because of the limited information available through informant interviews and surveillance from discharge hospitalization IDC-9 or death certificate codes for dementia, we were unable to evaluate specific etiologic classifications of dementia.
In middle-aged and older adults without evidence of clinical stroke, a greater burden of high-grade imaging findings was associated with an increased rate of dementia over 20 years of follow-up. Our results, combined with previous findings, suggest that high-grade WMH and ventricular enlargement in midlife may represent specific markers of brain injury that increase risks for later-life cognitive impairment. Our finding of a notable interaction between diabetes mellitus and silent infarcts and dementia risk suggests that the presence of diabetes mellitus may amplify the association between silent infarcts and dementia. This interaction is a novel finding and requires additional study. These results have important implications for early identification of high-risk individuals and for targeted prevention strategies.3
Acknowledgment
The authors thank the staff and participants of the ARIC study for their important contributions.
Glossary
- ARIC
Atherosclerosis Risk in Communities
- CI
confidence interval
- HR
hazard ratio
- ICD-9
International Classification of Diseases, 9th revision
- MR
magnetic resonance
- WMH
white matter hyperintensities
Author contributions
Dr. Nancy West conceptualized and designed the study, carried out the statistical analysis, interpreted the data, drafted the initial manuscript, and approved the final manuscript as submitted. Dr. Gwen Windham made substantial contributions to the conception of the study and interpretation of the data, reviewed and revised the manuscript for important intellectual content, and approved the final manuscript as submitted. Dr. David Knopman made substantial contributions to the interpretation of the data, reviewed and revised the manuscript for important intellectual content, and approved the final manuscript as submitted. Dr. Dean Shibata made important contributions to the interpretation of the data, reviewed and revised the manuscript for important intellectual content, and approved the final manuscript as submitted. Dr. Laura Coker reviewed and revised the manuscript for important intellectual content and approved the final manuscript as submitted. Dr. Thomas Mosley made substantial contributions to the conception and design of the study and the interpretation of the data, reviewed and revised the manuscript for important intellectual content, and approved the final manuscript as submitted.
Study funding
The ARIC study is carried out as a collaborative study supported by National Heart, Lung, and Blood Institute (NHLBI) contracts (HHSN268201100005C, HHSN268201100006C, HHSN268201100007C, HHSN268201100008C, HHSN268201100009C, HHSN268201100010C, HHSN268201100011C, and HHSN268201100012C). Neurocognitive data are collected by U01 2U01HL096812, 2U01HL096814, 2U01HL096899, 2U01HL096902, and 2U01HL096917 from the NIH (NHLBI; National Institute of Neurological Disorders and Stroke; National Institute on Aging, and National Institute on Deafness and Other Communication Disorders), and with previous brain MRI examinations funded by R01-HL70825 from the NHLBI.
Disclosure
The authors report no disclosures relevant to the manuscript. Go to Neurology.org/N for full disclosures.
References
- 1.Gorelick PB, Scuteri A, Black SE, et al. Vascular contributions to cognitive impairment and dementia: a statement for healthcare professionals from the American Heart Association/American Stroke Association. Stroke 2011;42:2672–2713. [DOI] [PMC free article] [PubMed] [Google Scholar]
- 2.Knopman DS, Mosley TH, Catellier DJ, Sharrett AR; Atherosclerosis Risk in Communities Study. Cardiovascular risk factors and cerebral atrophy in a middle-aged cohort. Neurology 2005;65:876–881. [DOI] [PubMed] [Google Scholar]
- 3.Smith EE, O'Donnell M, Dagenais G, et al. Early cerebral small vessel disease and brain volume, cognition, and gait. Ann Neurol 2015;77:251–261. [DOI] [PMC free article] [PubMed] [Google Scholar]
- 4.Bryan RN, Cai J, Burke G, et al. Prevalence and anatomic characteristics of infarct-like lesions on MR images of middle-aged adults: the Atherosclerosis Risk in Communities study. AJNR Am J Neuroradiol 1999;20:1273–1280. [PMC free article] [PubMed] [Google Scholar]
- 5.Longstreth WT, Jr., Arnold AM, Beauchamp NJ, Jr., et al. Incidence, manifestations, and predictors of worsening white matter on serial cranial magnetic resonance imaging in the elderly: the Cardiovascular Health Study. Stroke 2005;36:56–61. [DOI] [PubMed] [Google Scholar]
- 6.Mosley TH, Jr., Knopman DS, Catellier DJ, et al. Cerebral MRI findings and cognitive functioning: the Atherosclerosis Risk in Communities study. Neurology 2005;64:2056–2062. [DOI] [PubMed] [Google Scholar]
- 7.Mungas D, Harvey D, Reed BR, et al. Longitudinal volumetric MRI change and rate of cognitive decline. Neurology 2005;65:565–571. [DOI] [PMC free article] [PubMed] [Google Scholar]
- 8.The Atherosclerosis Risk in Communities (ARIC) study: design and objectives: the ARIC investigators. Am J Epidemiol 1989;129:687–702. [PubMed] [Google Scholar]
- 9.Bryan RN, Manolio TA, Schertz LD, et al. A method for using MR to evaluate the effects of cardiovascular disease on the brain: the Cardiovascular Health Study. AJNR Am J Neuroradiol 1994;15:1625–1633. [PMC free article] [PubMed] [Google Scholar]
- 10.Yue NC, Arnold AM, Longstreth WT, Jr., et al. Sulcal, ventricular, and white matter changes at MR imaging in the aging brain: data from the Cardiovascular Health Study. Radiology 1997;202:33–39. [DOI] [PubMed] [Google Scholar]
- 11.Manolio TA, Kronmal RA, Burke GL, et al. Magnetic resonance abnormalities and cardiovascular disease in older adults: the Cardiovascular Health Study. Stroke 1994;25:318–327. [DOI] [PubMed] [Google Scholar]
- 12.Knopman DS, Gottesman RF, Sharrett AR, et al. Mild cognitive impairment and dementia prevalence: the Atherosclerosis Risk in Communities Neurocognitive Study (ARIC-NCS). Alzheimers Dement (Amst) 2016;2:1–11. [DOI] [PMC free article] [PubMed] [Google Scholar]
- 13.Welsh KA, Breitner JCS, Magruder-Habib KM. Detection of dementia in the elderly using telephone screening of cognitive status. Cogn Behav Neurol 1993;6:103–110. [Google Scholar]
- 14.Knopman DS, Roberts RO, Geda YE, et al. Validation of the telephone interview for cognitive status-modified in subjects with normal cognition, mild cognitive impairment, or dementia. Neuroepidemiology 2010;34:34–42. [DOI] [PMC free article] [PubMed] [Google Scholar]
- 15.Kuller LH, Shemanski L, Manolio T, et al. Relationship between ApoE, MRI findings, and cognitive function in the Cardiovascular Health Study. Stroke 1998;29:388–398. [DOI] [PubMed] [Google Scholar]
- 16.Kuller LH, Lopez OL, Newman A, et al. Risk factors for dementia in the Cardiovascular Health Cognition Study. Neuroepidemiology 2003;22:13–22. [DOI] [PubMed] [Google Scholar]
- 17.Prins ND, van Dijk EJ, den Heijer T, et al. Cerebral white matter lesions and the risk of dementia. Arch Neurol 2004;61:1531–1534. [DOI] [PubMed] [Google Scholar]
- 18.Vermeer SE, Prins ND, den Heijer T, Hofman A, Koudstaal PJ, Breteler MM. Silent brain infarcts and the risk of dementia and cognitive decline. N Engl J Med 2003;348:1215–1222. [DOI] [PubMed] [Google Scholar]
- 19.Debette S, Beiser A, DeCarli C, et al. Association of MRI markers of vascular brain injury with incident stroke, mild cognitive impairment, dementia, and mortality: the Framingham Offspring Study. Stroke 2010;41:600–606. [DOI] [PMC free article] [PubMed] [Google Scholar]
Associated Data
This section collects any data citations, data availability statements, or supplementary materials included in this article.
Data Availability Statement
A public-use ARIC dataset is available through BioLINCC. More information on the data is available from the authors on reasonable request.


