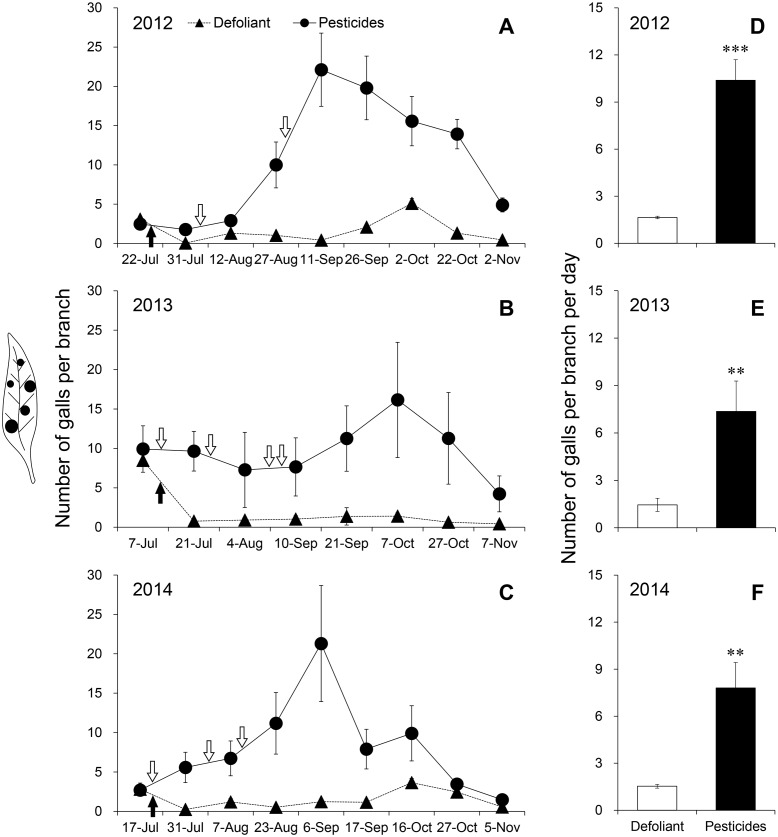
Figure 2. Dynamics of galls in the defoliant treatment and pesticide treatment in (A) 2012, (B) 2013 and (C) 2014. Number of galls per branch per day in (D) 2012, (E) 2013 and (F) 2014.
Black arrows indicate the time of defoliant application and white arrows with black outline indicate the time of pesticide application. Five replications were performed for each treatment, and 2 bushes were selected in each replication. Error bars are ±SE. ** and *** indicate significant differences between the defoliant and pesticide treatments, i.e., P < 0.01 and 0.001, respectively.

