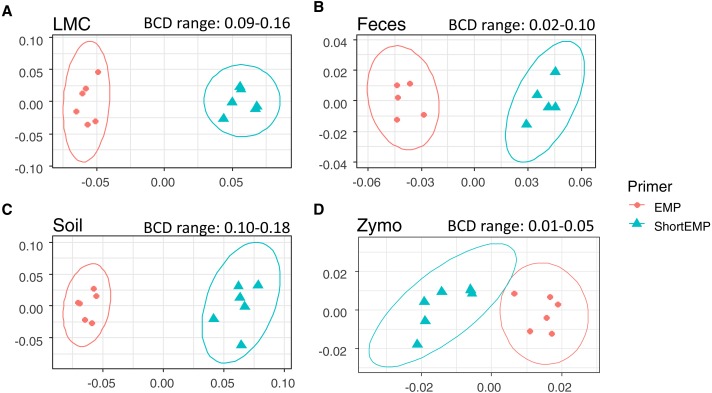
Figure 3. Effect of primer set on observed microbial communities in complex microbial samples.
Genus-level annotations of sequence data sequenced on an Illumina MiSeq instrument were visualized using mMDS ordination employing a distance matrix based on Bray–Curtis similarity. X-axes represent MDS axis 1 and y-axes represent MDS axis 2 for all sample types. Sequence data were rarefied to different depths for each sample type (Table S3). For each sample, six technical replicates were performed at optimal annealing temperatures of 45 °C (ShortEMP) and 50 °C (EMP). Small, but significant, shifts in microbial communities were observed between EMP and ShortEMP primers for (A) Lake Michigan sediment (LMC), ANOSIM R = 1, P = 0.0021, (B) rat feces (Feces), ANOSIM R = 1, P = 0.0027, (C) garden soil (Soil), ANOSIM R = 1, P = 0.0033, and ZymoBIOMICS Microbial Community DNA standard (Zymo), ANOSIM R = 1, P = 0.0019. The range of Bray–Curtis dissimilarity (BCD) between EMP and ShortEMP technical replicates is shown above each figure. Ellipses represent a 95% confidence interval around the centroid. Two outliers from the fecal analysis were removed (see Fig. S2).

