Abstract
Objective: To demonstrate the utility of rheoencephalography (REG) for measuring cerebral blood flow and fluid dynamics during different stages of sleep. Methods: Anteroposterior cranial electrical impedance was measured with concurrent polysomnography in a group of healthy subjects during sleep. Transcranial electrical impedance was characterized by measuring the peak-to-trough and envelope of the filtered pulsative REG signal as well as its frequency. The sensitivity of the REG amplitude to changes in cerebral blood flow (CBF) was confirmed by the analysis of the signal during breathing maneuvers with known effects on CBF. The mean amplitude and variability of the REG characteristic parameters were averaged across all participants and were compared between different stages of sleep. Results: Average transcranial impedance was significantly lower during non-REM stages N1 and N2, compared to other sleep stages, suggesting a decrease in CBF volume. Stage N3 showed the slowest frequency indicating a slow heart rate during this stage. N3 also had the lowest variability in frequency and peak-to-trough amplitude. Conclusion: Measurement of transcranial electrical conductivity may be a viable non-invasive method for monitoring any potential changes in intracranial fluid homeostasis. Clinical Impact: In the absence of other convenient non-invasive methods, using REG to track intracranial fluid dynamics during sleep can facilitate an improved understanding of pathogenesis in Alzheimer’s disease.
Keywords: Intracranial fluid homeostasis, rheoencephalography, sleep, transcranial impedance
This 6-month, controlled clinical study demonstrates patients' general acceptance of spectrally notched hearing aids and the data support the therapeutic advantage of tailored spectral notches in hearing-aid supported tinnitus treatment.
I. Introduction
Intracranial fluid homeostasis during sleep plays an important role in pathophysiology of neurodegenerative diseases such as Alzheimer’s. However, there is no direct, noninvasive method to easily and continuously measure cerebrospinal fluid (CSF) or cerebral blood flow (CBF) during sleep. Currently the most common non-invasive technique in measuring CBF in clinical practice is Transcranial Doppler sonography (TCD) [1] which measures CBF velocity [2]. TCD is not practical for sleep studies because the required equipment physically restricts sleep position. In addition, it requires a highly skilled operator onsite to both conduct the procedure and interpret the results.
In this paper, we describe the design and development of an inexpensive, non-invasive, portable, and wireless Rheoencephalography (REG) system and its use in monitoring CBF changes and fluid dynamics during sleep. REG is an impedance plethysmography technique ([3]–[7]) that indirectly measures the CBF changes by measuring the component of the transcranial impedance that corresponds to volume oscillations in intracranial arteries elicited by the cardiac cycle. The direct correlation between impedance and CBF is explained by the classical Nyboer model ([8] and references therein), [9] which states that the change in volume of the arterial blood pulse is directly proportional to the accompanying change of electrical impedance [8]. Moreover, at the same temperature and frequency, CSF has higher conductivity than blood [10]. Therefore, an increase in CBF (which will accompany a decrease in CSF) increases the resistivity and hence the intracranial impedance.
REG technology was first introduced in 1959 [6], [11], but its clinical applications remained limited, possibly due to its high sensitivity to movement artifacts or its potential for contamination by extracranial blood flow [12]. However, recent studies in animals and humans have convincingly demonstrated that the morphology of the REG waveform is sensitive to changes in CBF and stiffness of the cerebral arteries and arterioles [13]–[16]. Therefore, REG could also be used in monitoring autoregulation of CBF which is very critical in neurointensive care and prevention of stroke. The experimental and clinical conditions in which REG proved useful include CO2-inhalation, carotid clamping, controlled hemorrhage, and drug-induced vasospasm in animals [13]; hydrocephalus [44], trauma, intracranial hemorrhages, and cerebral atherosclerosis (e.g. [4], [13]–[16]) in patients.
The contribution of this paper is twofold. First, we used simultaneous REG and EEG recording of healthy volunteers to further establish the utility of REG in monitoring intracranial fluid homeostasis during sleep. We designed and implemented a REG system and validated it via controlled breathing maneuvers. Second, we conducted a study to measure CBF during sleep in order to better understand overall fluid homeostasis alterations during different stages of sleep. The significance of this study is in expanding our understanding of the role of sleep in the pathophysiology of neurodegenerative diseases.
II. Related Work
Recent sleep studies have described how cerebrospinal fluid (CSF) circulation during sleep can facilitate the fluid exchange between CSF and interstitial fluid (ISF) for the clearance of waste metabolites [17] such as  -amyloid [18] and Tau [19].
  -amyloid levels fluctuate during wake and sleep with higher levels reported during wake and lower levels during sleep [20]. In addition, it has been shown that sleep disruption can increase overall
  -amyloid levels [21]. However, in order to better understand these mechanisms it is necessary to measure the dynamics of intracranial fluids during sleep. There is an inverse relationship between changes in CSF and CBF, described by the revised Monroe Kellie hypothesis (i.e. the sum of the volumes of brain tissue, CSF, ISF and intracranial blood remains nearly constant) [22]. Therefore, any decrease/increase in one component should be compensated by an increase/decrease in another, respectively.
A number of studies have reported that global CBF is reduced during stable non-rapid eye movement (Non-REM) sleep [23]–[29], which is linked to a decrease in the metabolic demand of brain tissue. However, the picture is more complex when local blood flows are investigated across different brain regions during Non-REM sleep, with both increases and decreases reported for various brain structures in animals [30]–[32]. A substantial increase in ISF volume during slow-wave sleep and a decrease during REM sleep has also been reported in mice. These changes were documented with both impedance measurements [33] and contrast-enhanced MRI [34], [35]. The increase in ISF volume has been linked to the clearance of waste metabolites from the brain [36], [37], which, in turn is relevant to understanding the pathogenesis of Alzheimer’s disease [18], [38], [39]. Therefore further studies are needed in order to fully understand the dynamics of intracranial fluids during sleep in humans.
III. Materials and Methods
A. Hardware
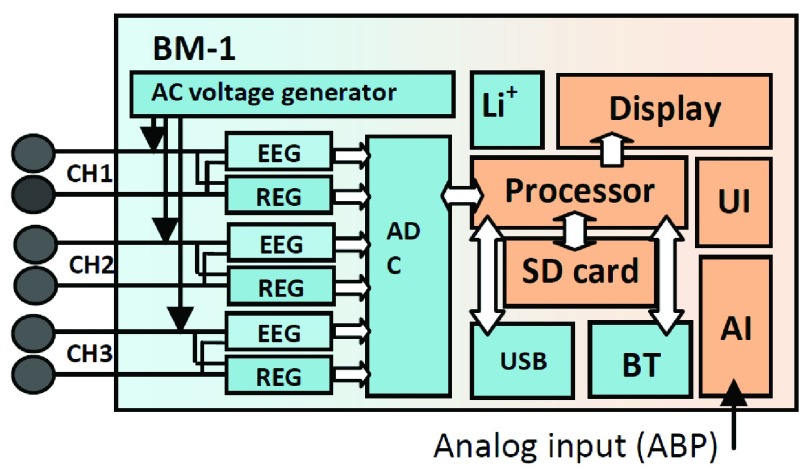
We designed and implemented a prototype REG device (X-REG). X-REG is a 3-channel, battery operated, and portable Rheoencephalography device that measures the transcranial electrical impedance by applying a square wave carrier signal (0 – 3.3 V) at 1MHz and measuring the corresponding current. Fig. 1 shows the overall schematic diagram of the main components of X-REG.
FIGURE 1.
Schematic diagram of the main components in X-REG including a microcontroller (Processor), voltage generator, A/D converter (ADC), Bluetooth module (BT), rechargeable battery (Li+), universal serial bus (USB), display unit and analog input unit (AI).
X-REG has a main processor, an ADC (16 bits), 4GB SD card, a micro USB port (USB 2.0, 3Mbps), a Bluetooth unit (Class2, v2.1+EDR, 3Mbps, 30ft), and a rechargeable battery (3.7V, 1300 mAh). The power consumption is less than 200 mW. It has 3 input channels (0.16–5 Hz bandwidth, 0.005  /LSB resolution and 85dB CMRR). Overall gain ranges from 100 to 10,000 adjusted by a programmable potentiometer. X-REG is approximately 3.5
  inches and weighs less than 4 oz. The carrier signal is a 1MHz 0–3.3V square wave generated by the microprocessor. Impedance is derived by measuring the current and converting it to voltage.
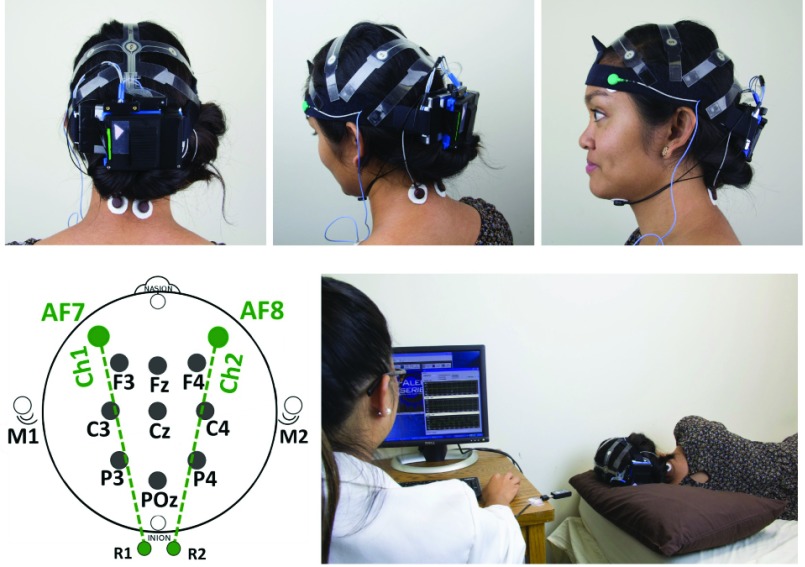
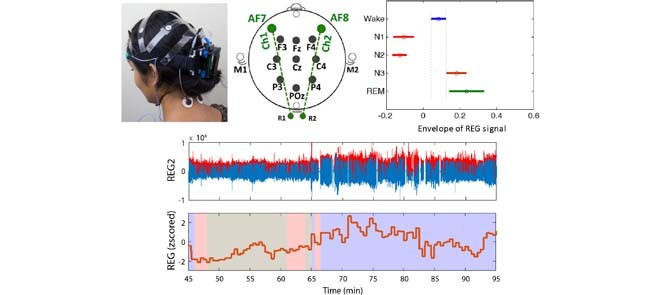
We used X-REG to measure transcranial impedance in the anterior-posterior direction (Fig. 2). There are two transcranial channels, one for the left hemisphere (AF7-R1) and one for the right hemisphere (AF8-R2). R1 and R2 are reference channels at the back of the neck. The third channel is used to acquire transthoracic impedance, with the electrode placed between 5th left inter-costal space (close to the heart apex). ABM’s X-10 EEG recorder (Advanced Brain Monitoring, Carlsbad, USA) was used, in parallel, to co-acquire EEG (9 channels), and chin electromyography (EMG).
FIGURE 2.
EEG and REG recording headset (X10 EEG mounted by X-REG), REG electrode sites (AF7-R1) and (AF8-R2) and the experimental setup.
Electrodes were placed in accordance with the American Academy of Sleep Medicine (AASM) guidelines [40]. Both devices sampled the signals at 256 Hz using a 16-bit A/D converter with 0.1uV/LSB and band-pass filtered all signals (0.1–65Hz). The X-REG device additionally digitally filtered the cranial and thoracic impedance signals using a 5Hz FIR filter prior to re-sampling them at 32Hz. All signals were transmitted in real time to a host PC using two independent Bluetooth links (one for X-REG, one for X-10) and dedicated software applications (B-Alert®Live for EEG and REGistER®for REG). The two data streams were synchronized at the level of the host PC, using its system clock to time-stamp the incoming data packages from both devices.
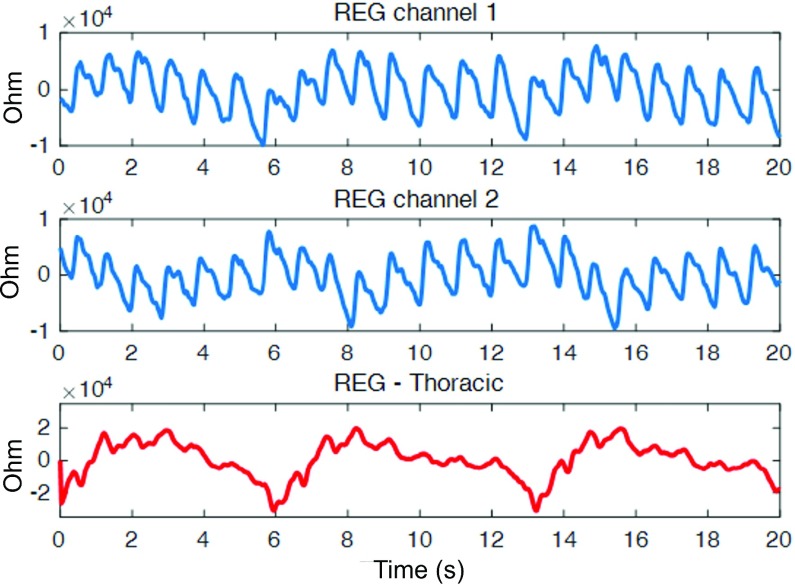
Fig. 3 shows an example of 20 seconds of artifact-free REG signal recorded by our system at left and right intracranial channels as well as a third thoracic channel. The strong cardiac component can be visibly detected along with dicrotic notches. There is a less prominent low frequency respiratory component that is expectedly much stronger in the thoracic channel
FIGURE 3.
A 20-second segment (subject 1504) of REG signals in left channel (top), right channel (middle) and thoracic channel (bottom). A strong cardiac (arterial) component (with characteristic dicrotic notches) that rides on top of a less prominent respiratory (venous) component is captured in the two transcranial signals (top and middle). As expected, the respiratory component is much stronger in the thoracic channel (bottom).
B. Subjects
Under IRB approval, twenty four healthy participants ages (22 – 78 years old, mean 46.54 ± 19.62 years) were enrolled into the study through recruitment using online ads. The subjects were screened using a series of computerized questionnaires to exclude conditions that may affect sleep architecture or CNS vasculature. The subjects were asked to wear wrist actigraphs and maintain sleep diaries for seven days prior to their experimental visit, and to avoid alcoholic beverages and caffeine for 24 hours before the experiment. The night before the experimental session the subjects were asked to undergo a standard sleep restriction procedure with only 2 hours of sleep allowed (between 2AM and 4AM). Outside of this time period (9PM to 2AM and 4AM to 1 hour prior to arrival time) the subjects were required to make phone calls to the ABM’s headquarters at 30 minute intervals to prove they stayed awake in compliance with the protocol. The sleep deprivation protocol was designed to ensure that the subjects would easily fall asleep and have extended periods of deep Non-REM sleep during the course of the experimental visit. However some participants, particularly elderly adults, were unable to adhere to sleep deprivation portion of the protocol (9 out of 24).
C. Methods
On the day of the experimental visit, the subjects reported to the ABM facility between 8AM and 10AM. The attending technician would first inspect the subjects’ sleep log for the night before and actigraphic recordings to look for unusual sleep patterns and/or non-compliance with the sleep restriction protocol. They were first set up with the EEG and REG equipment. The subjects were then escorted to a sound-proof, temperature controlled sleep room and allowed to take a nap for up to 5 hours (roughly equivalent to 3 sleep cycles). During the nap the light was off and the subjects were monitored using an infrared camera. The continuously recorded EEG and REG data were wirelessly transmitted to a PC station (located in the sleep room) in real time so that the technician could monitor the signal quality from an adjacent room. The technicians were instructed to enter the sleep room and troubleshoot any issue that affected the signal and did not self-correct in 3 minutes. This duration was empirically found in previous studies to offer an optimal balance between the minimization of data loss and maximization of the participant’s sleep quality.
Once the subjects woke up from the nap, they were seated in an upright position and asked to perform a sequence of four, 1-minute long breathing maneuvers known to affect the CBF (Table I). Each 4-minute sequence was repeated 2–3 times. These maneuvers, are similar in effort and consequences to what people often do when exercising; consequently, they posed a minimal risk to the study participants. These risks were further minimized through the exclusion criteria that eliminate the participants with acute or chronic illnesses who might be unable to safely complete the maneuvers. The participants were informed of the possibility for palpitations, dyspnea or dizziness to develop during the maneuvers, and were instructed to notify the attending research staff of any discomfort that they feel might be related to the exercises. The attending research staff were instructed to immediately terminate the experiment if the heart rate increased above 150bpm or if objective or subjective cardio-respiratory symptoms (e.g. shortness of breath, dizziness) developed.
TABLE 1. Breathing Maneuvers.
| Maneuver | Effect |
|---|---|
| Re-breathing* | CO2 ; CBF ; CBF
|
| Hyperventilation | CO2 ; CBF ; CBF
|
| Breath hold* | CO2 ; CBF ; CBF
|
| Modified Valsalva** | CO2 ; CBF ; CBF
|
Re-breathing into a sealed bag causes a gradual rise in inhaled CO2; the breath hold causes a more rapid decrease.
Modified Valsalva
D. Data Analysis Methods
1). REG Signals During Sleep
REG signals in both left and right channels were first band-pass filtered between 1.4 and 4 Hz using a 2nd order Butterworth filter. After detection of zero crossings, local maxima and minima of the filtered signal were computed. The resulting signal was divided into 30-second epochs. For each epoch of the filtered REG signal, the following measurements were defined and computed as described below.
REG Pulse ( ) is defined as the frequency of the first harmonic of the REG signal (cycles per minute). This represents an approximation of the heart rate. REG Pulse Variability (PV) is defined as standard deviation of the REG Pulse that approximates heart rate variability and defined as in (1) (refer to Fig. 4). Average peak-to-trough (PTmean) is defined in (2). Peak-to-trough variability (PTV) is defined as in (3):
 |
FIGURE 4.
Top-left: 3 seconds of the recorded REG signal, bottom-left and top-right: band-passed filtered REG signal and peak detection, (bottom-right) rectified filtered signal and detected envelopes.
The envelope of the REG signal was computed using two different methods. (a) A rectify and integrate method was used to integrate the absolute value of the filtered REG signal using a 1.5 sec rolling window [14]. The average value of the envelope within each 30-sec epoch was computed and defined as envRI. (b) Peak envelope was detected using a Spline interpolation over local maxima separated by 0.5 seconds. The average value of this envelope within each 30-sec epoch was computed and defined as envPK.
2). REG Signals During Breathing Maneuvers
The breathing maneuvers served to induce predictable changes in the caliber of the cerebral arteries and thereby demonstrate and validate the X-REG device’s sensitivity to the concurrent change in CBF. Data from this part of the experiment were reviewed to confirm the start and the end point of the respective maneuvers and label the sections heavily contaminated with motion or speech artifacts. The artifacts were, unfortunately, abundant during the re-breathing and Valsalva maneuvers. Therefore, only hyperventilation and breath-hold sections were used for analysis. Signal envelope was calculated across each hyperventilation and breath-hold segment using the aforementioned methods. The resulting time series was normalized by dividing it with the average envelope calculated over the interval starting 10s before and ending 10s after the onset of the breathing maneuver. This way, changes in the later parts of each maneuver can be easily interpreted as percent change with respect to the beginning of the maneuver. The artifact-free normalized envelopes were then averaged across participants.
3). EEG Signals and Sleep Analysis
EEG and EMG signals were imported into ABM’s EVA software and scored according to the AASM guidelines [40] assigning one of the five stages (Wake, REM, N1, N2 and N3) to each 30-second epoch. Since REG is a relative measure and may widely vary across individuals, the two time series for each participant (left and right channels) were first z-scored to allow for between-subject comparisons. All REG measurements in both cranial channels were then calculated as per the previous section and averaged for each 30-second epoch.
Next, average REG measurements were computed for each participant and subsequently examined to identify any systematic differences between the left and the right REG channel. Such differences were occasionally observed during the data acquisition in participants who slept on their side, possibly due to the pressure exerted by the pillow on one side of the head but not the other. Therefore, we excluded any portion of the signal where the difference between the left and right channels was greater than 3 times the standard deviation of the values in both channels. Finally, the effect of sleep stage on the REG amplitude was assessed using a 1-factor ANOVA, with sleep stage as a single, between-subject factor.
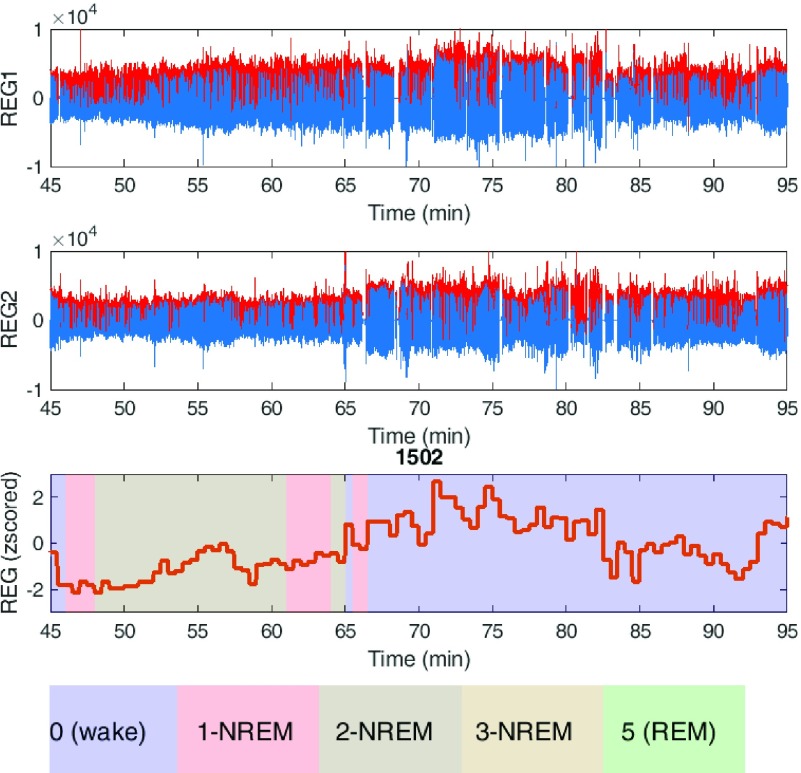
Fig. 5 shows an example of the REG signal in both channels (blue color) with the envelope superimposed (red color). The envelope of the average REG signals with corresponding sleep stage is also plotted for each 30-second epoch.
FIGURE 5.
REG signals recorded from subject 1502 in both channels left (REG1) and right (REG2) within a 50 min time frame with the envelope colored as red. The bottom figure shows the average of the detected envelope within each 30-sec epoch superimposed with sleep stages.
IV. Results
A. Breathing Maneuvers
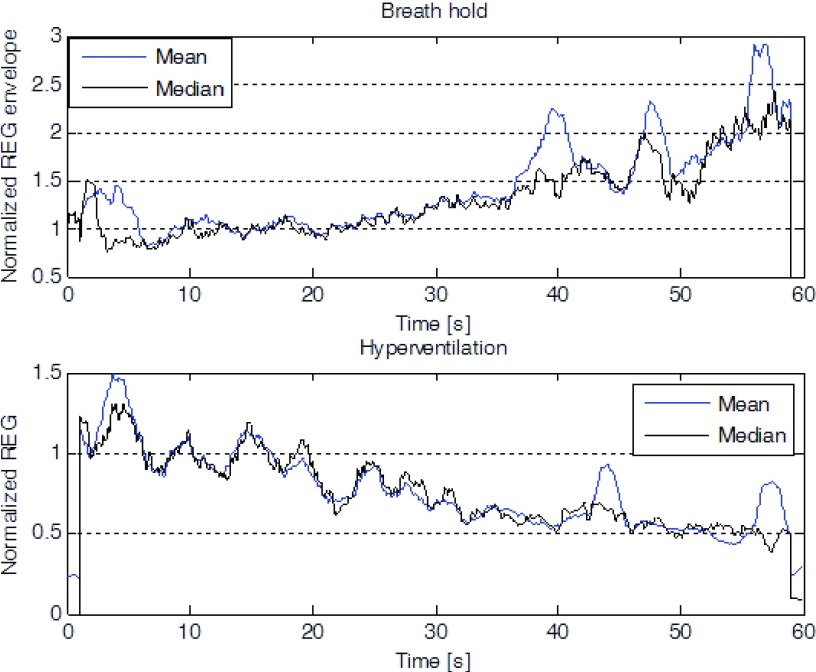
The group effects of hyperventilation and breath-holding on the REG envelope are shown in Fig. 6.
FIGURE 6.
Mean and median envelope (n = 6) of the normalized REG during the 1-minute breath-hold (Left) and subsequent hyperventilation (Right).
On average, hyperventilation resulted in a decrease in the REG envelope, whereas breath-holding had the opposite effect. The effect varied across the participants, being very prominent in some and virtually absent in others. Also, head movements, relatively frequent at the beginning of the hyperventilation and towards the end of the breath hold maneuver distorted the shape of the waveforms. Nonetheless, the results confirm that the X-REG device is sensitive to changes in the caliber of cerebral arteries and arterioles caused by changes in blood CO2 levels.
B. Sleep Data
A total of 71.1 hours of data from sleep sessions (8534 30-sec epochs) were analyzed. The average individual time-in-bed (TIB) amounted to 3.1 ± 0.5 hours. The proportion of sleep stages in the sample was as follows: Wake - 2439 epochs (28.6%), REM - 498 epochs (5.8%), N1 - 1249 epochs (14.6%), N2 - 2859 epochs (33.5%), and N3 - 1146 epochs (13.4%). The unusually high proportion of the Wake stage was largely a consequence of poor sleep quality of six participants who had difficulties falling asleep in our sleep laboratory. Table II shows the amount of sleep data recorded and used.
TABLE 2. Recorded and Available Sleep Data Collected and Scored.
| Total | Recorded | Remained after artifact removal and sleep staging |
|---|---|---|
| Wake min (%) | 1219 (%28) | 1060 (28%) |
| N1 min (%) | 624 (15%) | 569 (15%) |
| N2 min (%) | 1429 (33%) | 1343 (36%) |
| N3 min (%) | 573 (13%) | 557 (15%) |
| REM min (%) | 249 (6%) | 231 (6%) |
| Undetected min (%) | 213 (5%) | 0 (0%) |
| Total (Hours) | 71.1 | 62.7 |
The REG measurements described in the methods section were computed for the average of the z-scored signals of the left and right channels. Measurements during each sleep stage were averaged for all participants and are shown in Fig. 7, 8, and 9. On average and compared to waking state, REG pulse (P) was lower in deep sleep (N3) and higher in REM sleep. REG pulse variability (PV) was also significantly lower during N3 (Fig. 7). Assuming that PV in REG is correlated with heart rate variability (HRV), these findings are in agreement with the literature on HRV during early NREM sleep stages [41]–[43], [45], [46] indicating a decrease in heart rate variability (HRV) in N1 and N2 stages compared to wakefulness. However, the lower pulse variability (PV) in REM sleep is not consistent with the expected increase in HRV during REM. Further work may be needed to investigate possible reasons for this observation to identify if this difference is due to the nature of REG signal or due to circumstance of this study such as sleep deprivation or analysis methodology [47]. Analysis of the Peak-to-Trough (PT) for the normalized REG signal showed higher PT during both N3 and REM stages with the lowest variability (PTV) during N2 and N3 (Fig. 8). Lastly, amplitude analysis of the normalized REG signal through envelope detection using both the envRI (rectify and integrate) method and envPK (spline interpolation over local maxima) method showed lower amplitudes during Non-REM stages N1 and N2 but not N3 stage (Fig. 9).
FIGURE 7.
Group average z-scored Pulse ( ), on left and Pulse Variability (PV) on right of the average REG signal in each sleep stage. Error bars represent standard error of the mean.
  is the number of 30-second epochs used to compute the averages.
FIGURE 8.
Group average z-scored Peak-to-Trough (PT) on the left graph and the variability of the Peak-to-Trough (PVT), on right graph in each sleep stage. Error bars represent standard error of the mean.  is the number of 30-second epochs used to compute the averages.
FIGURE 9.
Group average z-scored envelope of the average REG signal using two methods Rectify-and-Integrate (envRI) and spline method (envPK) plotted for each sleep stage. Error bars represent standard error of the mean.  is the number of 30-sec epochs used to compute the averages.
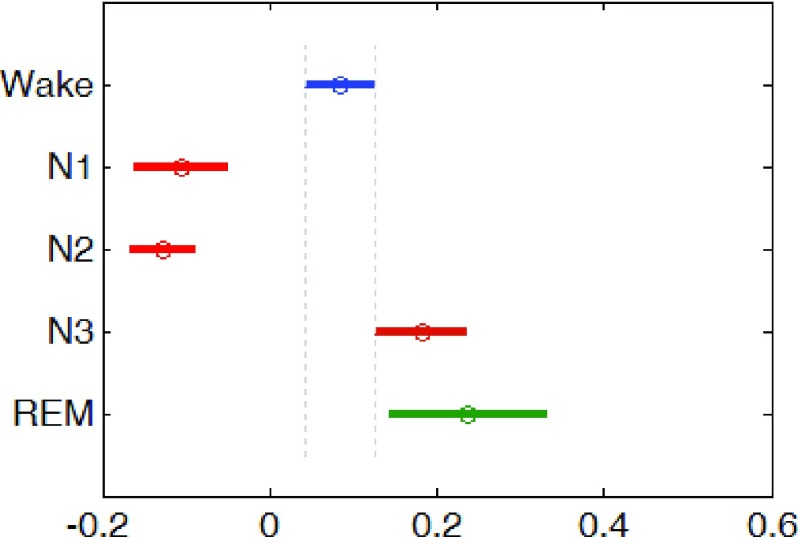
The ANOVA showed that sleep stages had a statistically significant effect on the average REG amplitude measured by envRI(F = 34.66; df = 4 p <0.001). Post-hoc comparisons (Tukey’s test) revealed that the REG amplitudes during both Non-REM N1 and N2 sleep stages were significantly lower than both wake and REM stages (see Fig. 10)
FIGURE 10.
Population marginal means of envRI measure of the REG amplitude for each sleep stage after post-hoc analysis.
V. Discussion and Conclusions
The results confirm that the X-REG impedance measurement device can detect changes in cerebral blood flow (CBF) during the systematic breathing maneuvers, and that CBF decreases during stable non-rapid eye movement (Non-REM) sleep as compared to wake or REM sleep (Fig. 9). The results are in agreement with prior investigations on the relationship between CBF and sleep in human subjects using non-invasive techniques for measuring CBF [23]–[29]. However, the results should be cautiously interpreted at this stage of the research because of the small sample size, the high sensitivity of REG to motion artifacts, and potential contamination by extracranial blood flow.
A. Feasibility, Safety and Comfort
The current work demonstrates the feasibility of using REG technology in sleep studies. REG is a special case of bioelectrical impedance analysis (BIA) with a demonstrable safety analysis. The REG device in this paper is battery operated (3.7V) with no possibility of leakage current from the mains. Consequently, the body/head will never be exposed to high voltages no matter what breakdown might occur in the device. This system has a certificate of compliance with IEC60601 standard for the safety of medical electrical equipment. The system does introduce high-frequency (1MHz) current (1mA nominal; limited to 3mA) to the brain/body. However this is considered safe as the allowable threshold of leakage current increases rapidly with frequency.
The current design is not currently optimized for comfort. The system could be redesigned by reducing its weight and size and changing the placement of the main unit (currently on the back of the head and difficult for supine sleeping). Also using a headband montage with fewer channels for EEG recording and sleep staging could improve the design and its comfort.
B. Significance of the Findings
The findings in this paper help in understanding brain fluid dynamics that may play a significant role in the normal physiology of tissue waste clearance [35]–[39]. Alterations in brain clearance mechanisms are currently hypothesized to play a role in the development of Alzheimer’s disease, which is characterized by the reduced clearance, and thus tissue accumulation, of aggregated proteins. We have shown that transcranial impedance, as measured via our simple REG technique, can non-invasively infer changes in cerebral fluid homeostasis during specific sleep states. The convenience and low cost of our approach can facilitate the study of this biology in normal health, disease states and clinical drug trials as well as regular sleep assessment procedures.
Funding Statement
This work was supported in part by the USA Med Research ACQ Agency under Contract W81XWH-10-C-0061 and Biogen Inc. under Contract 762747.
References
- [1].Sarkar S., Ghosh S., Ghosh S. K., and Collier A., “Role of transcranial Doppler ultrasonography in stroke,” Postgraduate Med. J., vol. 83, no. 985, pp. 683–689, 2007. [DOI] [PMC free article] [PubMed] [Google Scholar]
- [2].Sorond F. A., Hollenberg N. K., Panych L. P., and Fisher N. D. L., “Brain blood flow and velocity: Correlations between magnetic resonance imaging and transcranial Doppler sonography,” J. Ultrasound Med., vol. 29, no. 7, pp. 1017–1022, 2010. [DOI] [PMC free article] [PubMed] [Google Scholar]
- [3].Moskalenko Y. E. and Andreeva J. V., “Rheoencephalography: Past popularity, obvilion at present and optimistic furure,” Int. J. Adv. Life Sci. Technol., vol. 2, no. 1, pp. 1–15, 2015. [Google Scholar]
- [4].Lifshitz K., “Rheoencephalography: I. review of the technique,” J. Nervous Mental Dis., vol. 136, no. 4, pp. 388–398, 1963. [PubMed] [Google Scholar]
- [5].Seipel J. H., “The biophysical basis and clinical applications of rheoencephalography,” Neurology, vol. 17, no. 5, pp. 443–451, May 1967. [DOI] [PubMed] [Google Scholar]
- [6].Jenkner F. L., Clinical Rheoencephalography: A Non-invasive Method for Automatic Evaluation of Cerebral Hemodynamics. Vienna, Austria: ertldruck, 1986. [Google Scholar]
- [7].Bodo M., “Studies in rheoencephalography (REG),” J. Elect. Bioimpedance, vol. 1, pp. 18–40, Jan. 2010. [Google Scholar]
- [8].Jevning R., Fernando G., and Wilson A. F., “Evaluation of consistency among different electrical impedance indices of relative cerebral blood flow in normal resting individuals,” J. Biomed. Eng., vol. 11, no. 1, pp. 53–56, 1989. [DOI] [PubMed] [Google Scholar]
- [9].Perez J. J., Guijarro E., Ortiz P., and Pons J. M., “New Perspectives in Rheoencephalography,” in Proc. Encyclopedia Healthcare Inf. Syst. Harrisburg, PA, USA: IGI Global, 2008, pp. 990–997. [Google Scholar]
- [10].Gabriel C., Peyman A., and Grant E. H., “Electrical conductivity of tissue at frequencies below 1 MHz,” Phys. Med. Biol., vol. 54, no. 16, p. 4863, 2009. [DOI] [PubMed] [Google Scholar]
- [11].Jenkner F. L., “Rheoencephalography,” Stereotactic Funct. Neurosurg., vol. 19, no. 1, pp. 1–20, 1959. [Google Scholar]
- [12].Pérez J. J., Guijarro E., and Barcia J. A., “Influence of the scalp thickness on the intracranial contribution to rheoencephalography,” Phys. Med. Biol., vol. 49, no. 18, p. 4383, 2004. [DOI] [PubMed] [Google Scholar]
- [13].Bodo M.et al. , “Measurement of brain electrical impedance: Animal studies in rheoencephalography,” Aviation, Space, Environ. Med., vol. 74, no. 5, pp. 506–511, May 2003. [PubMed] [Google Scholar]
- [14].Bodo M., Pearce F. J., and Armonda R. A., “Cerebrovascular reactivity: Rat studies in rheoencephalography,” Physiol. Meas., vol. 25, no. 6, p. 1371, 2004. [DOI] [PubMed] [Google Scholar]
- [15].Bodo M.et al. , “Cerebrovascular involvement in liposome—Induced cardiopulmonary distress in pigs,” J. Liposome Res., vol. 15, nos. 1–2, pp. 3–14, 2005. [DOI] [PubMed] [Google Scholar]
- [16].Popovic D.et al. , “Assessment of cerebral blood flow autoregulation (CBF AR) with rheoencephalography (REG): Studies in animals,” J. Phys. Conf. Ser., vol. 434, no. 1, p. 012042, 2013. [Google Scholar]
- [17].Sakka L., Coll G., and Chazal J., “Anatomy and physiology of cerebrospinal fluid,” Eur. Ann. Otorhinolaryngol. Head Neck Diseases, vol. 128, no. 6, pp. 309–316, 2011. [DOI] [PubMed] [Google Scholar]
- [18].Tarasoff-Conway J. M.et al. , “Clearance systems in the brain—Implications for Alzheimer disease,” Nature Rev. Neurol., vol. 11, no. 8, pp. 457–470, Aug. 2015. [DOI] [PMC free article] [PubMed] [Google Scholar]
- [19].Kurz A.et al. , “Tau protein in cerebrospinal fluid is significantly increased at the earliest clinical stage of Alzheimer disease,” Alzheimer Disease Associated Disorders, vol. 12, no. 4, pp. 372–377, Dec. 1998. [DOI] [PubMed] [Google Scholar]
-
[20].Roh J. H.et al. , “Sleep-wake cycle and diurnal fluctuation of amyloid-
 as biomarkers of brain amyloid pathology,” Sci. Transl. Med., vol. 4, no. 150, p. 150ra122, 2012. [DOI] [PMC free article] [PubMed] [Google Scholar]
 -
[21].-El Y., Ju S.et al. , “Slow wave sleep disruption increases cerebrospinal fluid amyloid-
 levels,” Brain, vol. 140, no. 8, pp. 2104–2111, 2017. [DOI] [PMC free article] [PubMed] [Google Scholar]
 - [22].Mokri B., “The Monro-Kellie hypothesis: Applications in CSF volume depletion,” Neurology, vol. 56, no. 12, pp. 1746–1748, 2001. [DOI] [PubMed] [Google Scholar]
- [23].Townsend R. E., Prinz P. N., and Obrist W. D., “Human cerebral blood flow during sleep and waking,” J. Appl. Physiol., vol. 35, no. 5, pp. 620–625, Nov. 1973. [DOI] [PubMed] [Google Scholar]
- [24].Sakai F., Meyer J. S., Karacan I., Derman S., and Yamamoto M., “Normal human sleep: Regional cerebral hemodynamics,” Ann. Neurol., vol. 7, no. 5, pp. 471–478, May 1980. [DOI] [PubMed] [Google Scholar]
- [25].Madsen P. L.et al. , “Cerebral O2 metabolism and cerebral blood flow in humans during deep and rapid-eye-movement sleep,” J. Appl. Physiol. Bethesda Md, vol. 70, no. 6, pp. 2597–2601, Jun. 1991. [DOI] [PubMed] [Google Scholar]
- [26].Droste D. W., Berger W., Schuler E., and Krauss J. K., “Middle cerebral artery blood flow velocity in healthy persons during wakefulness and sleep: A transcranial Doppler study,” Sleep, vol. 16, no. 7, pp. 603–609, Oct. 1993. [PubMed] [Google Scholar]
- [27].Hajak G.et al. , “Relationship between cerebral blood flow velocities and cerebral electrical activity in sleep,” Sleep, vol. 17, no. 1, pp. 11–19, Feb. 1994. [DOI] [PubMed] [Google Scholar]
- [28].Kuboyama T., Hori A., Sato T., Mikami T., Yamaki T., and Ueda S., “Changes in cerebral blood flow velocity in healthy young men during overnight sleep and while awake,” Electroencephalogr. Clin. Neurophysiol., vol. 102, no. 2, pp. 125–131, Feb. 1997. [DOI] [PubMed] [Google Scholar]
- [29].Doust J. W. L. and Doust J. N. L., “Aspects of the cerebral circulation during non-REM sleep in healthy controls and psychiatric patients, as shown by rheoencephalography,” Psychophysiology, vol. 12, no. 5, pp. 493–498, Sep. 1975. [DOI] [PubMed] [Google Scholar]
- [30].Birzis L. and Tachibana S., “Local cerebral impedance and blood flow during sleep and arousal,” Exp. Neurol., vol. 9, no. 4, pp. 269–285, Apr. 1964. [DOI] [PubMed] [Google Scholar]
- [31].Adey W. R., Kado R. T., and Walter D. O., “Impedance characteristics of cortical and subcortical structures: Evaluation of regional specificity in hypercapnea and hypothermia,” Exp. Neurol., vol. 11, no. 2, pp. 190–216, 1965. [DOI] [PubMed] [Google Scholar]
- [32].Revich M., Isaacs G., Evarts E., and Kety S., “The effect of slow wave sleep and REM sleep on regional cerebral blood flow in cats,” J. Neurochem., vol. 15, no. 4, pp. 301–306, 1968. [DOI] [PubMed] [Google Scholar]
- [33].Ranck J. B., Jr., “Electrical impedance changes in many sites of brain in paradoxical sleep, anesthesia, and activity,” Express Neurol., vol. 27, no. 3, pp. 454–475, Jun. 1970. [DOI] [PubMed] [Google Scholar]
- [34].Xie L.et al. , “Sleep drives metabolite clearance from the adult brain,” Science, vol. 342, no. 6156, pp. 373–377, Oct. 2013. [DOI] [PMC free article] [PubMed] [Google Scholar]
- [35].Iliff J. J.et al. , “Brain-wide pathway for waste clearance captured by contrast-enhanced MRI,” J. Clin. Invest., vol. 123, no. 3, pp. 1299–1309, Mar. 2013. [DOI] [PMC free article] [PubMed] [Google Scholar]
-
[36].Iliff J. J.et al. , “A paravascular pathway facilitates CSF flow through the brain parenchyma and the clearance of interstitial solutes, including amyloid
 ,” Sci. Transl. Med., vol. 4, no. 147, p. 147ra111, Aug.
2012. [DOI] [PMC free article] [PubMed] [Google Scholar]
 - [37].Iliff J. J.et al. , “Cerebral arterial pulsation drives paravascular CSF-interstitial fluid exchange in the murine brain,” J. Neurosci., vol. 33, no. 46, pp. 18190–18199, 2013. [DOI] [PMC free article] [PubMed] [Google Scholar]
- [38].Zlokovic B. V. and Frangione B., “Transport-clearance hypothesis for Alzheimer’s disease and potential therapeutic implications,” Landes Biosci, Austin, TX, USA, 2013. [Google Scholar]
-
[39].Shibata M.et al. , “Clearance of Alzheimer’s amyloid-
 peptide from brain by LDL receptor–related protein-1 at the blood-brain barrier,” J. Clin. Invest., vol. 106, no. 12, pp. 1489–1499, Dec.
2000. [DOI] [PMC free article] [PubMed] [Google Scholar]
 - [40].Ancoli-Israel S.et al. , “The AASM manual for the scoring of sleep and associated events: Rules, terminology and technical specifications,” Amer. Acad. Sleep Med. Westchester, 2007. [Google Scholar]
- [41].Elsenbruch S., Harnish M. J., and Orr W. C., “Heart rate variability during waking and sleep in healthy males and females,” Sleep, vol. 22, no. 8, pp. 1067–1071, 1999. [DOI] [PubMed] [Google Scholar]
- [42].Berlad I., Shlitner A., Ben-Haim S., and Lavie P., “Power spectrum analysis and heart rate variability in Stage 4 and REM sleep: Evidence for state-specific changes in autonomic dominance,” J. Sleep Res., vol. 2, no. 2, pp. 88–90, 1993. [DOI] [PubMed] [Google Scholar]
- [43].Vanoli E., Adamson P. B., Pinna G. D., Lazzara R., and Orr W. C., “Heart rate variability during specific sleep stages: A comparison of healthy subjects with patients after myocardial infarction,” Circulation, vol. 91, no. 7, pp. 1918–1922, 1995. [DOI] [PubMed] [Google Scholar]
- [44].Grasso G.et al. , “Assessment of human brain water content by cerebral bioelectrical impedance analysis: A new technique and its application to cerebral pathological conditions,” Neurosurgery, vol. 50, no. 5, pp. 1064–1074, May 2002. [DOI] [PubMed] [Google Scholar]
- [45].Van de Borne P., Nguyen H., Biston P., Linkowski P., and Degaute J. P., “Effects of wake and sleep stages on the 24-h autonomic control of blood pressure and heart rate in recumbent men,” Amer. J. Physiol.-Heart Circulatory Physiol., vol. 266, no. 2, pp. H548–H554, 1994. [DOI] [PubMed] [Google Scholar]
- [46].Boudreau P.et al. , “Circadian variation of heart rate variability across sleep stages,” Sleep, vol. 36, no. 12, pp. 1919–1928, 2013. [DOI] [PMC free article] [PubMed] [Google Scholar]
- [47].Herzig D.et al. , “Reproducibility of heart rate variability is parameter and sleep stage dependent,” Frontiers Physiol., vol. 8, p. 1100, Jan. 2018. [DOI] [PMC free article] [PubMed] [Google Scholar]


