

Abstract
Background
There is no drug therapy for abdominal aortic aneurysm (AAA). FAME‐2 (Fenofibrate in the Management of Abdominal Aortic Aneurysm 2) was a placebo‐controlled randomized trial designed to assess whether administration of 145 mg of fenofibrate/d for 24 weeks favorably modified circulating markers of AAA.
Methods and Results
Patients with AAAs measuring 35 to 49 mm and no contraindication were randomized to fenofibrate or identical placebo. The primary outcome measures were the differences in serum osteopontin and kallistatin concentrations between groups. Secondary analyses compared changes in the circulating concentration of AAA‐associated proteins, and AAA growth, between groups using multivariable linear mixed‐effects modeling. A total of 140 patients were randomized to receive fenofibrate (n=70) or placebo (n=70). By the end of the study 3 (2.1%) patients were lost to follow‐up and 18 (12.9%) patients had ceased trial medication. A total of 85% of randomized patients took ≥80% of allocated tablets and were deemed to have complied with the medication regimen. Patients’ allocated fenofibrate had expected reductions in serum triglycerides and estimated glomerular filtration rate, and increases in serum homocysteine. No differences in serum osteopontin, kallistatin, or AAA growth were observed between groups.
Conclusions
Administering 145 mg/d of fenofibrate for 24 weeks did not significantly reduce serum concentrations of osteopontin and kallistatin concentrations, or rates of AAA growth in this trial. The findings do not support the likely benefit of fenofibrate as a treatment for patients with small AAAs.
Clinical Trial Registration
URL: http://www.anzctr.org.au. Unique identifier: ACTRN12613001039774.
Keywords: abdominal aortic aneurysm, biomarkers, clinical trial, Fenofibrate
Subject Categories: Biomarkers, Clinical Studies
Clinical Perspective
What Is New?
Prior preclinical research has suggested that fenofibrate might limit the progression of abdominal aortic aneurysm (AAA).
This placebo‐controlled randomized trial examined the effects of 6 months fenofibrate therapy on circulating biomarkers of AAA.
Patients randomized to fenofibrate exhibited expected reductions in circulating triglyceride concentrations but no significant changes in AAA biomarkers or AAA diameter by comparison to controls.
What Are the Clinical Implications?
This trial suggests that fenofibrate treatment is unlikely to have beneficial effects on AAA pathology or growth.
Abdominal aortic aneurysm (AAA) is a progressive weakening and dilatation of the infrarenal aorta that affects ≈2% of men and ≈1% of women over the age of 65 years.1, 2, 3 The most common complication of AAA is aortic rupture, and the risk is greater at larger AAA diameters.4, 5 Currently AAAs are managed surgically; however, several large clinical trials have demonstrated that surgical repair does not reduce mortality for patients with AAAs measuring <55 mm.6, 7, 8, 9, 10 Accordingly, surgical intervention is only recommended for symptomatic, or large (>54 mm in men and >52 mm in women) asymptomatic AAAs.11, 12 The majority of AAAs detected through screening programs or incidental abdominal imaging are asymptomatic and of small diameter, and therefore are simply monitored by repeat imaging and clinical assessment.13, 14 Up to 70% of small AAAs eventually become symptomatic or grow to a size at which surgical intervention is indicated.15 Effective medical therapies would enable treatment of AAAs when first identified in order to prevent or limit AAA growth and rupture.
Fenofibrate (Lipidil) is a peroxisome proliferator activated receptor‐α ligand that is used therapeutically as a lipid‐modifying agent.16 Previous rodent model studies have demonstrated that administration of fenofibrate reduces the severity of experimental AAA.17, 18 These studies suggested that this effect likely resulted from downregulation of concentrations of the pro‐aneurysmal protein osteopontin within the aortas paralleled by reduced aortic inflammation and matrix remodeling.17, 18 Mice receiving fenofibrate also had improvements in circulating lipid profiles.17 Findings from other experimental and clinical studies suggest that fenofibrate may also influence AAA pathology through a range of other mechanisms including downregulation of matrix metalloproteinase‐9 (MMP‐9) and resistin (discussed in reference 13). Finally, recent human and experimental data from our laboratory suggested that fenofibrate may also be able to inhibit AAA pathology by upregulating the serine proteinase inhibitor kallistatin (article currently under review). Collectively, these data suggested that administration of fenofibrate to patients with small AAAs may block several pathological processes implicated in AAA progression. The FAME‐2 (Fenofibrate in the Management of Abdominal Aortic Aneurysm 2) trial was designed to test this hypothesis by randomizing patients with AAAs measuring 35 to 49 mm to receive 145 mg of fenofibrate, or an identical placebo per day for 24 weeks.19 The efficacy of fenofibrate was primarily assessed by measuring its impact on circulating concentrations of osteopontin and kallistatin. Secondary outcome measures included changes in circulating lipoprotein concentrations and blood concentrations of several proteins previously implicated in AAA (MMP‐9, D‐dimer, resistin, and osteoprotegerin).20, 21, 22, 23 Finally, we assessed whether 24 weeks of fenofibrate reduced AAA growth as measured by ultrasound imaging.
Methods
Requests for access to data, analytic methods, and study materials should be made to the corresponding author.
Study Design
The full trial protocol has been previously published.19 In brief, FAME‐2 was a randomized, double‐blind, multicenter, parallel, and placebo‐controlled clinical trial in which participants were allocated to receive capsules containing fenofibrate (145 mg Lipidil), or inert cellulose powder (placebo) once daily for 24 weeks. The appearance of the capsules and associated packaging were identical for intervention and placebo. The study included men and women aged 60 years and above who had an AAA measuring 35 to 49 mm on computed tomography or ultrasound, and no anticipated requirement for AAA repair within 12 months of recruitment. Participants were excluded if they already took fenofibrate or related fibrates; had a known contraindication to fenofibrate, had previous abdominal aortic surgery, had a mycotic AAA, or if they were currently enrolled in any other drug trial. Patients were randomized to treatment or placebo groups on a 1:1 ratio using a computer‐generated randomization list. Patient randomization was stratified according to recruitment site and initial AAA diameter (35–39, 40–44, and 45–49 mm). All patients and investigators were blinded to treatment allocation. The study was approved by The Prince Charles Hospital Human Research and Ethics Committee (13/QPCH/16), the Therapeutic Goods Administration (Trial number 2013/0415) and was registered with the Australian and New Zealand Clinical Trial Registry before commencing recruitment (ANZCTR12613001039774). All participants provided written informed consent and the trial was conducted with appropriate institutional ethics approvals.
Clinical Risk Factors and Medications
Baseline characteristics collected for each patient included sex, age, history of hypertension, diabetes mellitus, coronary heart disease (CHD), and prescribed medications. Diabetes mellitus and hypertension were defined based on a previous diagnosis and/or treatment for these conditions. Smoking history was classified as never smoker, current smoker, or ex‐smoker (ie not having smoked within 1 month of recruitment). CHD diagnosis was based on a history of angina, myocardial infarction, or coronary artery revascularization. Height and weight were measured in accordance with the guidelines of the International Society for the Advancement of Kinanthropometry. Body mass index was calculated as the body mass in kilograms divided by the square of height in meters.
Quality Assurance
Fenofibrate has an established ability to reduce circulating triglyceride concentrations and is currently prescribed for this indication.16, 24 The effect of fenofibrate on triglyceride concentration was used in addition to capsule counting as measures of drug compliance. For the purposes of the current study, patients were considered compliant if they had taken ≥80% of allocated capsules.
Outcome Measures
The primary outcome of the trial was the difference in circulating concentrations of osteopontin and kallistatin between groups during follow‐up. Secondary outcomes included differences in circulating concentrations of lipids (high density lipoprotein‐cholesterol, low‐density lipoprotein‐cholesterol, very low‐density lipoprotein‐cholesterol, and total cholesterol), MMP‐9, resistin, osteoprotegerin, and D‐dimer. A tertiary outcome was AAA diameter.20, 23, 25
Blood Tests
Blood samples were collected from participants at entry, week 3, and week 24. Circulating concentrations of MMP‐9, resistin, osteoprotegerin, D‐dimer, and kallistatin were measured by commercial ELISA according to manufacturers’ instructions (R&D Systems, Minneapolis, MN and Technozym, Vienna, Austria). Reproducibility for these assays was excellent (intraclass correlation 0.84–1.00) in accordance with accepted guidelines.26 Serum concentrations of triglycerides, high‐density lipoprotein‐cholesterol (HDL‐C), low‐density lipoprotein (LDL)‐C, homocysteine, and creatinine were measured by hospital pathology departments using automated assays as previously described.27, 28 Very low‐density lipoprotein cholesterol (VLDL‐C) concentrations were estimated using the formula total cholesterol—(HDL‐C+LDL‐C) as previously described.27 Estimated glomerular filtration rate (eGFR) was calculated using the Chronic Kidney Disease‐Epidemiology Collaboration group (CKD‐EPI).29
Measurement of AAA Diameter
AAAs were imaged by ultrasound at entry and 24 weeks by an experienced sonographer using a published standard protocol.30 Orthogonally oriented cross‐sectional static images of the infrarenal aorta obtained in the anterior–posterior plane were acquired from the site of maximum AAA diameter. All images were measured at the central coordinating center by 2 independent experienced readers blinded to patient allocation using a standard protocol. For each image, 3 measurements were made: (1) inner aortic wall to inner aortic wall; (2) leading edge to leading edge; and (3) outer aortic wall to outer aortic wall. The intraobserver reproducibility of the 2 observers was assessed by repeatedly measuring scans from 50 randomly selected patients at least 24 hours apart, with blinding to the original readings as previously described.31 Intrarater repeatability coefficients for both readers were <3 mm for each measurement type.
Adverse Events
Adverse events (AEs) and serious adverse events (SAEs) were defined based on guidelines published by the Australian National Health and Medical Research Council.32 AEs and SAEs were ascertained at 3‐ and 12‐week phone calls and a 24‐week visit. All AEs were recorded by the trial coordinators and reviewed by site principal investigators. All SAEs were reported to the Human Research Ethics Committee and study sponsor.
Sample Size
Sample size calculations for this trial were determined in line with the anticipated effects of fenofibrate on the primary outcome measures. Previous data suggest that fenofibrate reduces aortic osteopontin expression by ≈95%, and that patients receiving fibrates for 28 days exhibit an ≈30% reduction in circulating osteopontin concentrations.18, 33 Collectively, this led us to anticipate that 24 weeks of fenofibrate therapy would reduce serum osteopontin concentration by at least 30%. Pilot in vitro data led us to hypothesize that serum kallistatin concentrations would increase by 30% in patients allocated to fenofibrate (manuscript under review). These effect sizes were also considered to represent a clinically significant reduction in AAA pathology. It was hypothesized that serum osteopontin and kallistatin concentrations would remain unchanged in patients allocated to placebo. Assuming a dropout rate of 20%, sample size calculations indicated that 60 patients per group were required to demonstrate anticipated biomarker differences with 90% power. Since there were 2 primary outcome measures, a 2‐tailed α of 0.025 was used in these calculations to account for multiple testing. In May 2015 (after ≈50% of the planned participants had completed the protocol), drug compliance was assessed by capsule counting. This assessment suggested that 22% of the patients had taken fewer than 95% of the allocated tablets, or had withdrawn from the study. In view of this, the study sample size was increased by 20 participants (10/group) to minimize the risk of underpowering.
Statistical Analyses
Skewness and kurtosis tests indicated that many continuous variables collected at baseline were not normally distributed. Continuous baseline data are therefore presented as median and interquartile range, and were compared between groups using the Mann–Whitney U test. Nominal variables were compared between groups using the χ2 test (SPSS v22; IBM). Any baseline variable with a P<0.100 following these tests was considered to be a potential confounder. Changes in the circulating concentrations of blood tests and AAA diameter were initially compared between groups using random‐intercept unadjusted linear mixed effects (LME) models (R car and nlme packages) as previously described.34, 35, 36, 37, 38 In all models, time (as a factorial variable) and allocation were treated as fixed effects, and patients as random effects. Differences in blood markers and AAA growth between groups were further assessed in multivariable LME models including CHD and prescriptions of statins, β‐blockers, and antiplatelet and anticoagulant medications (because of potential confounding) as additional fixed effects.
For all LME models, fit was assessed through inspection of standardized residual distribution and q‐q norm plots. The response variables were natural‐log transformed to conform to model assumptions where necessary. For all LME analyses, a significant interaction (P<0.025) between time and treatment allocation was considered to denote a difference between groups. For some variables, residual plots suggested the presence of potentially influential outliers, which may have driven positive associations. Where this was the case, subset analyses were performed to exclude the impact of such outliers (defined as observations with a residual >2 standard deviations away from the mean of model residuals) on observed findings. Significant differences were accepted to be true if the interaction between time and allocation was upheld in these subset analyses. Exploratory analyses of the primary outcome measures revealed no difference in biomarker responses between recruitment centers, suggesting that there was minimal study site bias in the current study.
All analyses were conducted by an intention‐to‐treat approach using all available data. According to the study protocol, participants were to provide 3 blood samples (baseline and after 3 and 24 weeks), meaning a total of 420 samples were expected for analysis. Of these, 8 (1.9%) samples were unavailable for measurements of osteopontin, kallistatin, D‐dimer, MMP‐9, and resistin; and 11 (2.6%) samples were unavailable for assessment of serum concentrations of cholesterol, triglycerides, homocysteine, C‐reactive protein, and creatinine. AAA diameter measurements were unable to be performed on 3 (2.1%) patients at 24 weeks because of their death or withdrawal from the study (Figure 1). Missing data were not imputed because they were not randomly distributed throughout the population, and we have highlighted actual numbers included within both groups at each time point. All data analyses were audited by several authors to ensure accuracy before submission.
Figure 1.
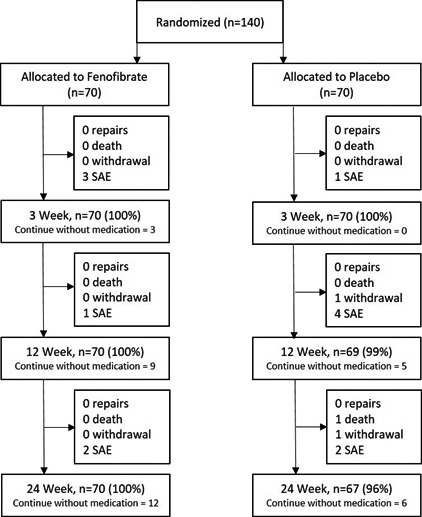
Consolidated Standards of Reporting Trials diagram showing the flow of patients for the current trial. SAE indicates serious adverse event.
Results
Patient Flow
A total of 140 patients were randomized to fenofibrate or placebo (n=70/group; Figure 1). Thirteen serious adverse events (SAEs) were reported throughout the trial, and were evenly distributed between groups (6 [8.6%] versus 7 [10.0%]; P=0.771, Table 1). Only 1 SAE was considered to relate to the trial medication, which was a clinically significant decrease in eGFR within 3 weeks of starting fenofibrate. The drug was stopped and eGFR increased. All patients allocated fenofibrate were followed through to the end of the trial, although 12 (17.1%) had stopped taking the allocated intervention. Three (4.3%) patients allocated placebo did not complete the trial (2 withdrawals and 1 death), and an additional 6 (8.6%) had stopped taking trial medication. In total, 137 (97.9%) of the randomized patients were followed to the end of the trial, and 122 (87.1%) remained on trial medication for the duration of the study. There were no protocol violations during the trial.
Table 1.
Baseline Characteristics of FAME2 Participants, Separated According to Group Allocation
| Characteristic | Whole Cohort (n=140) | Fenofibrate Group (n=70) | Placebo Group (n=70) | P Valuea |
|---|---|---|---|---|
| AAA, mm | ||||
| Inner‐inner (observer 1) | 34.7 (31.9–38.4) | 34.5 (31.7–38.4) | 34.8 (32.2–38.4) | 0.973 |
| Inner‐inner (observer 2) | 35.1 (32.3–39.0) | 35.1 (32.0–39.0) | 35.1 (32.5–39.0) | 0.960 |
| Leading edge‐leading edge (obs 1) | 37.0 (34.0–40.6) | 37.0 (34.0–41.0) | 37.1 (34.3–40.3) | 0.877 |
| Leading edge‐leading edge (obs 2) | 37.6 (34.1–40.8) | 37.6 (34.1–41.3) | 37.5 (34.0–40.8) | 0.861 |
| Outer‐outer (observer 1) | 39.7 (36.5–43.2) | 39.7 (36.5–43.5) | 39.4 (36.3–43.1) | 0.856 |
| Outer‐outer (observer 2) | 39.7 (36.0–43.1) | 40.0 (36.3–43.4) | 39.4 (35.7–42.8) | 0.845 |
| AAA risk factors and comorbidities | ||||
| Age | 76.6 (70.1–80.6) | 77.1 (69.7–81.0) | 76.5 (70.6–80.1) | 0.965 |
| Male sex | 117 (83.6%) | 59 (84.3%) | 58 (82.9%) | 0.820 |
| BMI | 27.0 (24.0–31.0) [1] | 28.0 (24.5–32.0) [1] | 27.0 (24.0–31.0) | 0.447 |
| Waist–hip ratio | 0.99 (0.94–1.03) [1] | 0.99 (0.95–1.05) [1] | 0.98 (0.92–1.02) | 0.294 |
| Prior stroke | 20 (14.3%) | 12 (17.1%) | 8 (11.4%) | 0.334 |
| eGFR, mL/min per 1.73 m2 | 72.5 (61.0–87.0) | 69.5 (60.0–88.0) | 73.5 (63.5–86.3) | 0.809 |
| Never smoker | 18 (12.9%) | 8 (11.4%) | 10 (14.3%) | 0.649b |
| Current smoker | 23 (16.4%) | 10 (14.3%) | 13 (18.6%) | |
| Ex‐smoker | 99 (70.7%) | 52 (74.3%) | 47 (67.1%) | |
| Hypertension | 130 (92.9%) | 66 (94.3%) | 64 (91.4%) | 0.512 |
| Diabetes mellitus | 41 (29.3%) | 23 (32.9%) | 18 (25.7%) | 0.353 |
| Dyslipidemia | 120 (85.7%) | 57 (81.4%) | 63 (90.0%) | 0.147 |
| CHD | 63 (45.0%) | 24 (34.3%) | 39 (55.7%) | 0.011c |
| Peripheral artery disease | 43 (30.7%) | 18 (25.7%) | 25 (35.7%) | 0.200 |
| Prescription for | ||||
| Aspirin | 86 (61.4%) | 37 (52.9%) | 49 (70.0%) | 0.037c |
| Other antiplatelet drugs | 24 (17.1%) | 7 (10.0%) | 17 (24.3%) | 0.025c |
| Anticoagulants | 19 (13.6%) | 14 (20.0%) | 5 (7.1%) | 0.026c |
| β‐Blockers | 56 (40.0%) | 20 (28.6%) | 36 (51.4%) | 0.006c |
| Calcium channel blockers | 48 (34.3%) | 25 (35.7%) | 23 (32.9%) | 0.722 |
| Furosemide | 6 (4.3%) | 3 (4.3%) | 3 (4.3%) | 1.000 |
| Other diuretic drugs | 29 (20.7%) | 12 (17.1%) | 17 (24.3%) | 0.297 |
| ACE inhibitors | 73 (52.1%) | 37 (52.9%) | 36 (51.4%) | 0.866 |
| Angiotensin receptor blockers | 52 (37.1%) | 25 (35.7%) | 27 (38.6%) | 0.726 |
| Other antihypertensive drugs | 8 (5.7%) | 3 (4.3%) | 5 (7.1%) | 0.466 |
| Statins | 112 (80.0%) | 50 (71.4%) | 62 (88.6%) | 0.011c |
| Metformin | 27 (19.3%) | 16 (22.9%) | 11 (15.7%) | 0.284 |
| Other oral hypoglycemic drugs | 17 (12.1%) | 10 (14.3%) | 7 (10.0%) | 0.438 |
| Insulin | 3 (2.1%) | 0 (0.0%) | 3 (4.3%) | 0.080 |
| Trial details | ||||
| Taken ≥80% allocated medication | 119 (85.0%) | 57 (81.4%) | 62 (88.6%) | 0.237 |
| Serious adverse events | 13 (9.3%) | 6 (8.6%) | 7 (10.0%) | 0.771 |
Continuous data are presented as median (interquartile range); nominal variables are presented as count and percent. Numbers in square brackets denote number of missing data points. AAA indicates abdominal aortic aneurysm; ACE, angiotensin‐converting enzyme; BMI, body mass index; CHD, coronary heart disease; eGFR, estimated glomerular filtration rate; FAME2, Fenofibrate in the Management of Abdominal Aortic Aneurysm trial.
P value refers to comparisons between treatment groups using the Mann–Whitney U test (continuous variables), or χ2 test (nominal variables).
P value refers to χ2 comparison of all smoking categories.
Potential confounders (P < 0.100 on statistical comparisons between groups).
Patient Characteristics
The demographic characteristics of the randomized patients are shown in Table 1. In accordance with the study design, patients in both groups were matched for initial AAA diameter at recruitment (Table 1). Patients in the placebo group were more likely to have CHD and be prescribed aspirin, other antiplatelet medications, β‐blockers, and statins, and less likely to be prescribed oral anticoagulants. Baseline concentrations of total cholesterol and LDL‐C were slightly lower in the placebo group compared with those allocated fenofibrate (Table 2). No other differences in cardiovascular risk factors or prescribed medications were observed between groups.
Table 2.
Biochemical Characteristics of FAME2 Participants Separated by Group Allocation
| Characteristic | Whole Cohort (n=140) | Fenofibrate Group (n=70) | Placebo Group (n=70) | P Valuea |
|---|---|---|---|---|
| Characteristics at baseline | ||||
| Total cholesterol, mmol/L | 4.2 (3.6–5.0) | 4.3 (3.7–5.1) | 4.0 (3.4–4.7) | 0.053 |
| HDL‐C, mmol/L | 1.2 (1.0–1.4) | 1.2 (1.0–1.4) | 1.1 (0.9–1.3) | 0.369 |
| LDL‐C, mmol/L | 2.2 (1.8–2.8) [1] | 2.3 (1.9–3.1) [1] | 2.1 (1.8–2.6) | 0.090 |
| VLDL‐C, mmol/L | 0.7 (0.5–0.9) [1] | 0.7 (0.5–0.9) [1] | 0.6 (0.5–0.9) | 0.309 |
| Triglyceride, mmol/L | 1.4 (1.0–1.9) | 1.4 (1.1–1.9) | 1.3 (1.0–1.9) | 0.217 |
| Creatinine, μmol/L | 85.0 (72.3–100.0) | 84.5 (71.8–103.3) | 85.5 (74.5–98.5) | 0.851 |
| CRP, mg/L | 2.0 (0.9–4.0) | 3.0 (1.0–4.2) | 2.0 (0.9–3.0) | 0.059 |
| Homocysteine, μmol/L | 12.7 (10.7–15.0) | 12.9 (10.7–15.7) | 12.1 (10.4–14.9) | 0.479 |
| Osteoprotegerin, ng/mL | 2.3 (1.8–3.1) | 2.4 (1.8–3.1) | 2.3 (1.9–3.0) | 0.756 |
| Osteopontin, ng/mL | 62.4 (51.1–84.1) | 62.1 (50.9–84.2) | 62.5 (52.0–84.2) | 0.654 |
| MMP9, ng/mL | 67.1 (44.0–92.7) | 66.9 (47.5–91.4) | 67.9 (37.5–96.1) | 0.726 |
| Kallistatin, μg/mL | 11.8 (10.0–13.7) | 12.0 (10.2–13.8) | 11.8 (9.7–13.5) | 0.717 |
| Resistin, ng/mL | 15.6 (10.1–21.0) | 16.5 (9.5–22.4) | 15.2 (10.6–20.0) | 0.352 |
| D‐dimer, μg/mL | 158.7 (103.9–262.9) | 143.3 (98.1–221.0) | 192.7 (115.8–292.8) | 0.084 |
Continuous data are presented as median (interquartile range). Numbers in square brackets denote number of missing data points. CRP indicates C‐reactive protein; FAME‐2, Fenofibrate in the Management of Abdominal Aortic Aneurysm 2 trial; HDL‐C, high‐density lipoprotein cholesterol; LDL‐C, low‐density lipoprotein cholesterol; MMP9, matrix metalloproteinase 9; VLDL, very low‐density lipoprotein cholesterol.
P value refers to comparisons between treatment groups using the Mann–Whitney U test.
Compliance
Capsule‐counting data suggested that 119 (85%) patients had adhered to the medication regimen. No significant difference in compliance rate was observed between groups (81.4% compliant in the fenofibrate group versus 88.6% in the placebo group; P=0.237, Table 1). Serum triglyceride concentrations decreased in participants allocated fenofibrate, and were significantly different between groups at 3 and 24 weeks (interaction between time and allocation P<0.001 for both time‐points following LME). eGFR was significantly lower, and circulating homocysteine concentration higher, in patients randomized to fenofibrate compared with those on placebo 3 and 24 weeks after starting the allocated drug (Figure 2 and Table S1).
Figure 2.
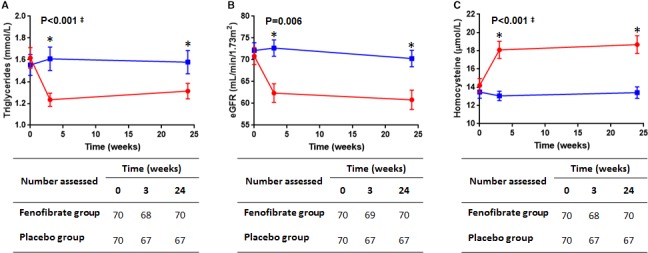
Serum triglyceride (A), estimated glomerular filtration rate (eGFR, B), and circulating homocysteine concentrations (C) in patients allocated fenofibrate (red circles) or placebo (blue squares) at recruitment, and after 3 and 24 weeks. Numbers of participants assessed at each time point for each marker are shown in the respective tables. P values refer to the interaction between time and drug allocation for the follow‐up period as determined using unadjusted linear mixed effects (LME) analysis. ‡Natural log‐transformed data assessed in LME. *Significant differences between groups for that time point as assessed by LME.
Effect of Fenofibrate on Serum Osteopontin and Kallistatin Concentrations
Serum osteopontin concentrations were comparable between groups at the time of recruitment and fluctuated over time for all participants, although no difference in these trends was observed between groups (Figure 3A). No difference in circulating kallistatin concentrations were observed between groups during follow‐up (Figure 3B). Inclusion of other covariates to adjust for potential confounders did not change these findings (Table S1).
Figure 3.
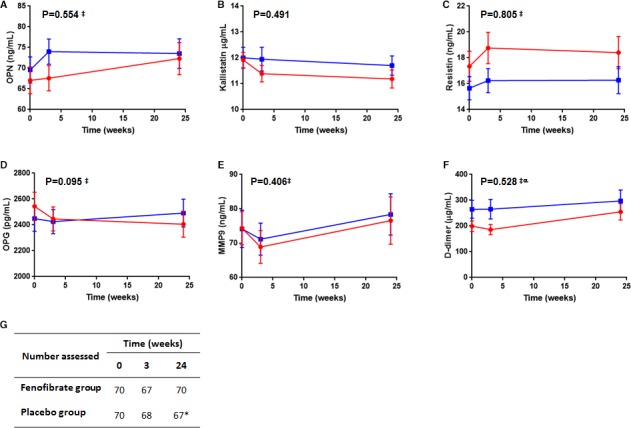
Circulating concentrations of osteopontin (OPN A), kallistatin (B), resistin (C), osteoprotegerin (OPG D), matrix metalloproteinase‐9 (MMP‐9 E), and D‐dimer (F) in patients allocated fenofibrate (red circles) or placebo (blue squares) at recruitment, and after 3 and 24 weeks. The number of patients included at each time point for the markers is detailed in (G) (*D‐dimer was assessed for 66 patients in the placebo group at 24 weeks). P values refer to the interaction between time and drug allocation for the follow‐up period as determined using unadjusted linear mixed effects (LME) analysis. ‡Natural log‐transformed data assessed in LME. αReported P value refers to analysis of data normalized to baseline levels to account for observed differences between groups at recruitment.
Effect of Fenofibrate on Other Circulating Markers and AAA Diameter
No differences in circulating concentrations of MMP‐9, resistin, or D‐dimer were found between groups (Figure 3, Table S1). Serum osteoprotegerin concentrations appeared to decrease over time in patients allocated fenofibrate by comparison to those in the placebo group, although this was not statistically significant (P=0.095 for interaction between time and treatment; Figure 3, Table S1). Fenofibrate reduced serum concentrations of total cholesterol and very low‐density lipoprotein cholesterol, and these reductions remained robust after adjusting for potential confounders and excluding outliers (Figure 4, Table S1). Serum LDL‐C and high‐density lipoprotein‐cholesterol concentrations during follow‐up were similar between groups. No significant difference in AAA growth rate was observed between groups using any of the assessed measurements (Figure 5, Table S2).
Figure 4.

Serum concentrations of total cholesterol (A), high‐density lipoprotein cholesterol (HDL‐C, B), low‐density lipoprotein cholesterol (LDL‐C, C), and very low‐density lipoprotein cholesterol (VLDL‐C, D) in patients allocated fenofibrate (red circles) or placebo (blue squares) at recruitment, and after 3 and 24 weeks. The number of patients included at each time point is detailed in the corresponding tables. P values refer to the interaction between time and drug allocation for the follow‐up period as determined using unadjusted linear mixed effects analysis. All data were natural log‐transformed for analysis. αReported P value refers to analysis of data normalized to baseline levels to account for observed differences between groups at recruitment.
Figure 5.
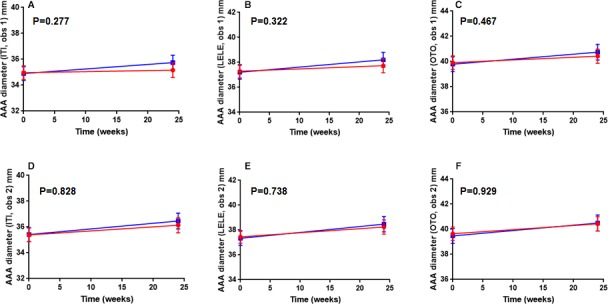
AAA (abdominal aortic aneurysm) growth in participants allocated fenofibrate (red circles) or placebo (blue squares) over 24 weeks. AAA diameters were read by 2 observers and assessed by measuring from inner wall to inner wall (ITI, A and D), leading edge to leading edge (LELE, B and E), and outer wall to outer wall (OTO, C and F). Baseline data were available for all recruited patients; however, 3 participants in the placebo group did not undergo imaging at 24 weeks because of study withdrawal or death (n=67 at for the placebo group at 24 weeks). P values relate to the interaction between time and treatment allocation as assessed by unadjusted linear mixed effects analysis.
Discussion
The main finding of this study is that 24 weeks of fenofibrate therapy did not significantly influence the circulating concentrations of the AAA‐associated proteins that were assessed. As would be expected from previous studies, patients allocated fenofibrate had reductions in circulating triglyceride concentrations and eGFR, and an increase in serum homocysteine.16 Similarly, patients allocated fenofibrate experienced significant reductions in circulating concentrations of total cholesterol and very low‐density lipoprotein cholesterol. These findings indicate that patients adhered to the trial protocol and that fenofibrate exerted anticipated pharmacological effects. Examination of graphs suggested that the serum osteoprotegerin concentration differed between groups, although this did not reach statistical significance. Two previous studies have investigated the effect of fenofibrate on circulating osteoprotegerin concentrations, although results from these reports were contradictory.39, 40 Syversen and colleagues reported that plasma osteoprotegerin concentrations in rats receiving fenofibrate were comparable to controls.40 In contrast, Celinska‐Lowenhoff et al reported that plasma osteoprotegerin concentrations significantly increased in response to 1 month of fenofibrate treatment in patients with CHD.39 Findings of the current study suggest that the trial may have been underpowered to examine the efficacy of fenofibrate in reducing serum osteoprotegerin concentration.
The findings of this trial must be considered in light of its limitations. Since AAA diameter was a tertiary outcome, it was not the focus of the sample size calculation and the trial was likely underpowered to assess this outcome. Despite this, sample sizes in each treatment group of the current study were comparable to the recently completed AARDVARK (Aortic Aneurysmal Regression of Dilation: Value of ACE‐Inhibition on Risk) trial, in which the primary outcome was the rate of AAA growth over 2 years.41 The possibility that fenofibrate administration may reduce AAA growth cannot therefore be completely dismissed and a larger trial with longer follow‐up would be required to definitively assess this. Secondly, outcomes from this study assessed the effects of fenofibrate on AAA pathology using concentrations of biomarkers. It is possible that important changes in aortic wall pathology may occur without altering these biomarkers. A previous rodent study demonstrated that mice receiving fenofibrate exhibited markedly fewer macrophages infiltrating the aorta and a more preserved ultrastructure than controls.17 The possibility that fenofibrate administration leads to a reduction in aortic inflammation and matrix remodeling is currently being examined in the FAME trial. This randomized control trial will assess the effects of short‐term fenofibrate therapy on pathological markers within aortic wall biopsies collected from patients undergoing open AAA repair.42 Finally, the possibility that a higher dose of fenofibrate might have been effective in this trial must be considered. Participants in the large FIELD (Fenofibrate Intervention and Event Lowering in Diabetes) trial were allocated to receive 200 mg of micronized fenofibrate per day. However, this has been demonstrated to be bioequivalent to the 145 mg per day dose used in the current study.43, 44 Additionally, patients allocated to fenofibrate in the current study exhibited expected biochemical responses (eg reductions in serum triglyceride concentrations). Collectively, this suggests that administering 145 mg per day of fenofibrate in this trial was an appropriate and therapeutic dose.
In conclusion, this randomized trial found that administration of 145 mg per day of fenofibrate did not lead to reduction in the serum concentrations of the pro‐inflammatory protein osteopontin or promote an increase in the serum concentrations of the anti‐aneurysmal protein kallistatin. Fenofibrate also had no significant effect on other AAA biomarkers and AAA growth. The findings do not support the efficacy of fenofibrate as a therapy for patients with a small AAA.
Sources of Funding
This trial was supported by grants from the Australian National Health and Medical Research Council (NHMRC, IDs 1079369 and 1000967) and The Townsville Hospital Private Practice Trust Fund. Golledge holds a practitioner Fellowship from the NHMRC (1117061) and a Senior Clinical Research Fellowship from the Queensland Government. Moxon is supported by an Advance Queensland Fellowship from the Queensland Government, Australia. The funders played no role in study design, conduct, data collection, analysis and interpretation, and did not assist in preparation or review of this article.
Disclosures
None.
Supporting information
Table S1. Summary of Outcome Assessments Comparing Circulating Biomarker Concentration Between Groups in Unadjusted and Adjusted LME Analyses
Table S2. Summary of Models Assessing Differences in AAA Growth Between Treatment Groups Using Unadjusted and Adjusted LME Analyses
Acknowledgments
This article is dedicated to the memory of Professor Phillip J Walker, a leading academic vascular surgeon who was instrumental in the design and funding of the study. Professor Walker sadly passed away in 2014 before the conclusion of the FAME‐2 trial and preparation of the current article.
(J Am Heart Assoc. 2018;7:e009866 DOI: 10.1161/JAHA.118.009866.)
References
- 1. Lederle FA, Johnson GR, Wilson SE, Chute EP, Littooy FN, Bandyk D, Krupski WC, Barone GW, Acher CW, Ballard DJ. Prevalence and associations of abdominal aortic aneurysm detected through screening. Aneurysm Detection and Management (ADAM) Veterans Affairs Cooperative Study Group. Ann Intern Med. 1997;126:441–449. [DOI] [PubMed] [Google Scholar]
- 2. Wanhainen A, Hultgren R, Linne A, Holst J, Gottsater A, Langenskiold M, Smidfelt K, Bjorck M, Svensjo S. Outcome of the Swedish nationwide abdominal aortic aneurysm screening program. Circulation. 2016;134:1141–1148. [DOI] [PubMed] [Google Scholar]
- 3. Svensjo S, Mani K, Bjorck M, Lundkvist J, Wanhainen A. Screening for abdominal aortic aneurysm in 65‐year‐old men remains cost‐effective with contemporary epidemiology and management. Eur J Vasc Endovasc Surg. 2014;47:357–365. [DOI] [PubMed] [Google Scholar]
- 4. Khosla S, Morris DR, Moxon JV, Walker PJ, Gasser T, Golledge J. Meta‐analysis of peak wall stress in ruptured, symptomatic and intact abdominal aortic aneurysms. Br J Surg. 2014;101:1350–1357. [DOI] [PubMed] [Google Scholar]
- 5. Moxon JV, Parr A, Emeto TI, Walker P, Norman PE, Golledge J. Diagnosis and monitoring of abdominal aortic aneurysm: current status and future prospects. Curr Probl Cardiol. 2010;35:512–548. [DOI] [PMC free article] [PubMed] [Google Scholar]
- 6. Cao P; CAESAR Trial Collaborators . Comparison of surveillance vs aortic endografting for small aneurysm repair (CAESAR) trial: study design and progress. Eur J Vasc Endovasc Surg. 2005;30:245–251. [DOI] [PubMed] [Google Scholar]
- 7. Lederle FA, Wilson SE, Johnson GR, Reinke DB, Littooy FN, Acher CW, Ballard DJ, Messina LM, Gordon IL, Chute EP, Krupski WC, Busuttil SJ, Barone GW, Sparks S, Graham LM, Rapp JH, Makaroun MS, Moneta GL, Cambria RA, Makhoul RG, Eton D, Ansel HJ, Freischlag JA, Bandyk D; Aneurysm Detection and Management Veterans Affairs Cooperative Study Group . Immediate repair compared with surveillance of small abdominal aortic aneurysms. N Engl J Med. 2002;346:1437–1444. [DOI] [PubMed] [Google Scholar]
- 8. Ouriel K. The PIVOTAL study: a randomized comparison of endovascular repair versus surveillance in patients with smaller abdominal aortic aneurysms. J Vasc Surg. 2009;49:266–269. [DOI] [PubMed] [Google Scholar]
- 9. Mortality results for randomised controlled trial of early elective surgery or ultrasonographic surveillance for small abdominal aortic aneurysms. Lancet. 1998;352:1649. [PubMed] [Google Scholar]
- 10. UK Small Aneurysm Trial Participants . Long‐term outcomes of immediate repair compared with surveillance of small abdominal aortic aneurysms. N Engl J Med. 2002;346:1445–1452. [DOI] [PubMed] [Google Scholar]
- 11. Chaikof EL, Dalman RL, Eskandari MK, Jackson BM, Lee WA, Mansour MA, Mastracci TM, Mell M, Murad MH, Nguyen LL, Oderich GS, Patel MS, Schermerhorn ML, Starnes BW. The Society for Vascular Surgery practice guidelines on the care of patients with an abdominal aortic aneurysm. J Vasc Surg. 2018;67:2–77.e72. [DOI] [PubMed] [Google Scholar]
- 12. Erbel R, Aboyans V, Boileau C, Bossone E, Bartolomeo RD, Eggebrecht H, Evangelista A, Falk V, Frank H, Gaemperli O, Grabenwoger M, Haverich A, Iung B, Manolis AJ, Meijboom F, Nienaber CA, Roffi M, Rousseau H, Sechtem U, Sirnes PA, Allmen RS, Vrints CJ. 2014 ESC guidelines on the diagnosis and treatment of aortic diseases: document covering acute and chronic aortic diseases of the thoracic and abdominal aorta of the adult. The Task Force for the diagnosis and treatment of aortic diseases of the European Society of Cardiology (ESC). Eur Heart J. 2014;35:2873–2926. [DOI] [PubMed] [Google Scholar]
- 13. Rowbotham SE, Krishna SM, Moran CS, Golledge J. Fenofibrate and telmisartan in the management of abdominal aortic aneurysm. Curr Drug Targets. 2017. Available at: http://www.eurekaselect.com/158698/article. Accessed August 24, 2018. [DOI] [PubMed] [Google Scholar]
- 14. Norman PE, Jamrozik K, Lawrence‐Brown MM, Le MT, Spencer CA, Tuohy RJ, Parsons RW, Dickinson JA. Population based randomised controlled trial on impact of screening on mortality from abdominal aortic aneurysm. BMJ. 2004;329:1259. [DOI] [PMC free article] [PubMed] [Google Scholar]
- 15. Golledge J, Norman PE. Current status of medical management for abdominal aortic aneurysm. Atherosclerosis. 2011;217:57–63. [DOI] [PubMed] [Google Scholar]
- 16. Filippatos TD, Florentin M, Georgoula M, Elisaf MS. Pharmacological management of diabetic dyslipidemia. Expert Rev Clin Pharmacol. 2017;10:187–200. [DOI] [PubMed] [Google Scholar]
- 17. Krishna SM, Seto SW, Moxon JV, Rush C, Walker PJ, Norman PE, Golledge J. Fenofibrate increases high‐density lipoprotein and sphingosine 1 phosphate concentrations limiting abdominal aortic aneurysm progression in a mouse model. Am J Pathol. 2012;181:706–718. [DOI] [PubMed] [Google Scholar]
- 18. Golledge J, Cullen B, Rush C, Moran CS, Secomb E, Wood F, Daugherty A, Campbell JH, Norman PE. Peroxisome proliferator‐activated receptor ligands reduce aortic dilatation in a mouse model of aortic aneurysm. Atherosclerosis. 2010;210:51–56. [DOI] [PMC free article] [PubMed] [Google Scholar]
- 19. Rowbotham SE, Bourke B, Bourke M, Jaeggi R, Jenkins J, Moxon JV, Pinchbeck J, Reid C, Velu R, Golledge J. Fenofibrate in the management of abdominal aortic aneurysm (FAME)‐2: the study protocol for a randomized, placebo‐controlled trial. Int J Clin Trials. 2016;3:217–224. [Google Scholar]
- 20. Golledge J, Muller R, Clancy P, McCann M, Norman PE. Evaluation of the diagnostic and prognostic value of plasma D‐dimer for abdominal aortic aneurysm. Eur Heart J. 2011;32:354–364. [DOI] [PubMed] [Google Scholar]
- 21. Golledge J, Clancy P, Jamrozik K, Norman PE. Obesity, adipokines, and abdominal aortic aneurysm: Health in Men Study. Circulation. 2007;116:2275–2279. [DOI] [PubMed] [Google Scholar]
- 22. Satoh K, Maniwa T, Oda T, Matsumoto K. Proteomic profiling for the identification of serum diagnostic biomarkers for abdominal and thoracic aortic aneurysms. Proteome Sci. 2013;11:27. [DOI] [PMC free article] [PubMed] [Google Scholar]
- 23. Acosta‐Martin AE, Panchaud A, Chwastyniak M, Dupont A, Juthier F, Gautier C, Jude B, Amouyel P, Goodlett DR, Pinet F. Quantitative mass spectrometry analysis using pacific for the identification of plasma diagnostic biomarkers for abdominal aortic aneurysm. PLoS One. 2011;6:e28698. [DOI] [PMC free article] [PubMed] [Google Scholar]
- 24. Wierzbicki AS. Fibrates in the treatment of cardiovascular risk and atherogenic dyslipidaemia. Curr Opin Cardiol. 2009;24:372–379. [DOI] [PubMed] [Google Scholar]
- 25. Golledge J, Tsao PS, Dalman RL, Norman P. Circulating markers of abdominal aortic aneurysm presence and progression. Circulation. 2008;118:2382–2392. [DOI] [PMC free article] [PubMed] [Google Scholar]
- 26. Cicchetti DV. Guidelines, criteria and rules of thumb for evaluating normed and standardized assessment instruments in psychology. Psychol Assess. 1994;6:284–290. [Google Scholar]
- 27. Moxon JV, Liu D, Wong G, Weir JM, Behl‐Gilhotra R, Bradshaw B, Kingwell BA, Meikle PJ, Golledge J. Comparison of the serum lipidome in patients with abdominal aortic aneurysm and peripheral artery disease. Circ Cardiovasc Genet. 2014;7:71–79. [DOI] [PubMed] [Google Scholar]
- 28. Smith RK, Quigley F, Tosenovsky P, Velu R, Bradshaw B, Buettner P, Golledge J. Serum homocysteine is associated with the severity of primary chronic venous disease. Phlebology. 2016;31:409–415. [DOI] [PubMed] [Google Scholar]
- 29. Golledge J, Ewels C, Muller R, Walker PJ. Association of chronic kidney disease categories defined with different formulae with major adverse events in patients with peripheral vascular disease. Atherosclerosis. 2014;232:289–297. [DOI] [PubMed] [Google Scholar]
- 30. Ferguson CD, Clancy P, Bourke B, Walker PJ, Dear A, Buckenham T, Norman P, Golledge J. Association of statin prescription with small abdominal aortic aneurysm progression. Am Heart J. 2010;159:307–313. [DOI] [PMC free article] [PubMed] [Google Scholar]
- 31. Morris DR, Singh TP, Moxon JV, Smith A, Stewart F, Jones RE, Golledge J. Assessment and validation of a novel angiographic scoring system for peripheral artery disease. Br J Surg. 2017;104:544–554. [DOI] [PubMed] [Google Scholar]
- 32. National Health and Medical Research Council . Guidance: safety monitoring and reporting in clinical trials involving therapeutic goods. 2016;EH59. ISBN: 978‐971‐925129‐925168‐925127
- 33. Nakamachi T, Nomiyama T, Gizard F, Heywood EB, Jones KL, Zhao Y, Fuentes L, Takebayashi K, Aso Y, Staels B, Inukai T, Bruemmer D. Ppar alpha agonists suppress osteopontin expression in macrophages and decrease plasma levels in patients with type 2 diabetes. Diabetes. 2007;56:1662–1670. [DOI] [PubMed] [Google Scholar]
- 34. Moxon JV, Jones RE, Norman PE, Clancy P, Flicker L, Almeida OP, Hankey GJ, Yeap BB, Golledge J. Plasma ferritin concentrations are not associated with abdominal aortic aneurysm diagnosis, size or growth. Atherosclerosis. 2016;251:19–24. [DOI] [PubMed] [Google Scholar]
- 35. Moxon JV, Ng E, Lazzaroni SM, Boult M, Velu R, Fitridge RA, Golledge J. Circulating biomarkers are not associated with endoleaks after endovascular repair of abdominal aortic aneurysms. J Vasc Surg. 2018;67:770–777. [DOI] [PubMed] [Google Scholar]
- 36. Golledge J, Moxon J, Pinchbeck J, Anderson G, Rowbotham S, Jenkins J, Bourke M, Bourke B, Dear A, Buckenham T, Jones R, Norman PE. Association between metformin prescription and growth rates of abdominal aortic aneurysms. Br J Surg. 2017;104:1486–1493. [DOI] [PubMed] [Google Scholar]
- 37. Fox J, Weisberg S. An R Companion to Applied Regression. 2nd ed Thousand Oaks, CA: Sage; 2011. [Google Scholar]
- 38. Pinheiro J, Bates D, DebRoy S, Sarkar D; Team RDC . Nlme: linear and nonlinear mixed effects models. R package version 3.1‐111. 2013.
- 39. Celinska‐Lowenhoff M, Lowenhoff T, Undas A, Gluszko P. Effects of hypolipemic drugs on the osteoprotegerin—sRANKL system in patients with coronary artery disease. Thromb Haemost. 2007;97:868–870. [PubMed] [Google Scholar]
- 40. Syversen U, Stunes AK, Gustafsson BI, Obrant KJ, Nordsletten L, Berge R, Thommesen L, Reseland JE. Different skeletal effects of the peroxisome proliferator activated receptor (PPAR)alpha agonist fenofibrate and the PPAR gamma agonist pioglitazone. BMC Endocr Disord. 2009;9:10. [DOI] [PMC free article] [PubMed] [Google Scholar]
- 41. Bicknell CD, Kiru G, Falaschetti E, Powell JT, Poulter NR. An evaluation of the effect of an angiotensin‐converting enzyme inhibitor on the growth rate of small abdominal aortic aneurysms: a randomized placebo‐controlled trial (AARDVARK). Eur Heart J. 2016;37:3213–3221. [DOI] [PMC free article] [PubMed] [Google Scholar]
- 42. Rowbotham SE, Cavaye D, Jaeggi R, Jenkins JS, Moran CS, Moxon JV, Pinchbeck JL, Quigley F, Reid CM, Golledge J. Fenofibrate in the management of abdominal aortic aneurysm (FAME): study protocol for a randomised controlled trial. Trials. 2017;18:1. [DOI] [PMC free article] [PubMed] [Google Scholar]
- 43. Keech A, Simes RJ, Barter P, Best J, Scott R, Taskinen MR, Forder P, Pillai A, Davis T, Glasziou P, Drury P, Kesaniemi YA, Sullivan D, Hunt D, Colman P, d'Emden M, Whiting M, Ehnholm C, Laakso M. Effects of long‐term fenofibrate therapy on cardiovascular events in 9795 people with type 2 diabetes mellitus (the FIELD study): randomised controlled trial. Lancet. 2005;366:1849–1861. [DOI] [PubMed] [Google Scholar]
- 44. Ling H, Luoma JT, Hilleman D. A review of currently available fenofibrate and fenofibric acid formulations. Cardiol Res. 2013;4:47–55. [DOI] [PMC free article] [PubMed] [Google Scholar]
Associated Data
This section collects any data citations, data availability statements, or supplementary materials included in this article.
Supplementary Materials
Table S1. Summary of Outcome Assessments Comparing Circulating Biomarker Concentration Between Groups in Unadjusted and Adjusted LME Analyses
Table S2. Summary of Models Assessing Differences in AAA Growth Between Treatment Groups Using Unadjusted and Adjusted LME Analyses