

Abstract
Background
Cardiovascular risk factors have differential effects on various manifestations of cardiovascular disease, but to date direct formal comparisons are scarce, have been conducted primarily in men, and include only traditional risk factors.
Methods and Results
Using data from the multi‐ethnic Women's Health Initiative Observational Study, we used a case–cohort design to compare 1731 women with incident cardiovascular disease during follow‐up to a cohort of 1914 women. The direction of effect of all 24 risk factors (including various apolipoproteins, hemoglobin A1c, high‐sensitivity C‐reactive protein, N‐terminal pro‐brain natriuretic peptide, and tissue plasminogen activator antigen) was concordant for coronary heart disease (CHD, defined as myocardial infarction and CHD death) and ischemic stroke; however, associations were generally stronger with CHD. Significant differences for multiple risk factors, including blood pressure, lipid levels, and measures of inflammation, were observed when comparing the effects on hemorrhagic stroke with those on ischemic outcomes. For instance, multivariable adjusted hazard ratios per standard deviation increase in non–high‐density lipoprotein cholesterol were 1.16 (95% confidence interval, 1.06–1.28) for CHD, 0.97 (0.88–1.07) for ischemic stroke, and 0.76 (0.63–0.91) for hemorrhagic stroke (P<0.05 for equal association). Model discrimination was better for models predicting CHD or ischemic stroke than for models predicting hemorrhagic stroke or a combined end point.
Conclusions
Cardiovascular risk factors have largely similar effects on incidence of CHD and ischemic stroke in women, although the magnitude of association varies. Determinants of ischemic and hemorrhagic stroke substantially differ, underscoring their distinct biology. Cardiovascular disease risk may be more accurately reflected when combined cardiovascular disease or cerebrovascular outcomes are broken down into different first manifestations, or when restricted to ischemic outcomes.
Keywords: cardiovascular disease, competing risks, coronary heart disease, epidemiology, population science, stroke
Subject Categories: Risk Factors, Etiology, Women, Primary Prevention, Epidemiology
Clinical Perspective
What Is New?
Cardiovascular risk factors have differential effects on various manifestations of cardiovascular disease, but to date direct formal comparisons have been conducted primarily in men and include only traditional risk factors.
Traditional and newer cardiovascular risk factors have largely similar effects on the incidence of coronary heart disease and ischemic stroke in women, although the magnitude of association differs.
Determinants of ischemic and hemorrhagic stroke substantially differ, underscoring their distinct biology.
Model discrimination was better for models predicting coronary heart disease or ischemic stroke risk than for models predicting hemorrhagic stroke risk or a combined cardiovascular disease end point.
What Are the Clinical Implications?
Risk prediction models combining ischemic and hemorrhagic stroke into a single composite outcome have a poorer ability to identify individuals at increased risk of all stroke types combined because of the differences in risk factor profiles of ischemic and hemorrhagic stroke.
Global cardiovascular disease risk can be more accurately estimated when combined cardiovascular or cerebrovascular outcomes are broken down into different first manifestations, or when a composite end point is restricted to ischemic outcomes only.
Introduction
In many studies, cardiovascular disease (CVD) incidence represents the first manifestation among a variety of events combined into a composite end point. This is done under the assumption that cardiovascular risk factors contribute in a similar fashion to the development of different manifestations of CVD. Previous work, however, has shown that CVD manifests differentially in men and women. CVD is more likely to manifest with stroke in women, whereas with coronary heart disease (CHD) in men.1 Less is known with regard to cardiovascular risk factors in relation to CVD manifestations. This is important, since hypertension appears to be preferentially associated with incidence of stroke, whereas hypercholesterolemia may play a more important role in the development of CHD.2, 3, 4 Consistent divergent associations between total cholesterol and high‐density lipoprotein (HDL) cholesterol with risk of ischemic stroke and intracerebral hemorrhage have been reported,4, 5 which likely explains the overall lack of association between lipid levels and combined stroke outcomes in many populations. Overall, direct formal comparisons of the effects of cardiovascular risk factors on the development of various first manifestations of CVD are scarce, were done in men only, and included only traditional risk factors.6, 7 Besides a single report on only 468 events,3 none of the studies to date have reported on the differential impact of cardiovascular risk factors on multiple vascular territories in women.2, 4
Differential effects of risk factors may have implications for causative and prognostic research, as well as for identifying high‐risk individuals and subsequent preventive treatment in clinical practice. Therefore, we sought to directly examine differences in effects of traditional and newer cardiovascular risk factors—representative of a wide spectrum of pathophysiological pathways—for various first common CVD manifestations in a multi‐ethnic cohort of women.
Methods
Availability of Data, Analytic Methods, and Study Materials
The statistical code is available from the corresponding author or lead author upon reasonable request for purposes of reproducing the results or replicating the procedure (npaynter@partners.org or m.leening@erasmusmc.nl, respectively). WHI‐OS (The Women's Health Initiative Observational Study) case–cohort data will not be made publicly available for purposes of reproducing the results. Procedures to requests access to the WHI‐OS data by qualified researchers can be found online.8
Study Design, Setting, and Population
The WHI‐OS includes 93 676 ethnically diverse postmenopausal women aged 50 to 79 years at enrollment.9 Women were recruited at 40 clinical centers throughout the United States between 1994 and 1998 and followed through 2005. Additional follow‐up was collected through the WHI Extension Study. Of the WHI‐OS participants, 71 872 had no history of hard CVD (defined as myocardial infarction [MI], stroke, revascularization procedures, or peripheral vascular disease), venous thromboembolism, or cancer at baseline. Baseline blood specimens and risk factor information were available on 60 890 of these women.
A prospective case–cohort design was used (Figure 1).10 Selected cases included all cases of major first CVD (defined as MI, stroke, and cardiovascular death) for blacks/African Americans (n=200), Hispanics/Latinos (n=53), Asians/Pacific Islanders (n=55), and women of other or unknown ethnicity (n=55). For reasons of efficiency, the remaining 1637 of 2000 cases were randomly sampled from the 2370 cases among non‐Hispanic white women. A reference subcohort of 2000 women comprised controls selected using the same eligibility criteria and stratified to match cases by race/ethnicity and 5‐year age categories. After further exclusion for 1 or more missing laboratory measurements (n=88), white blood cell count >15 000/μL (n=8),11 lack of follow‐up (n=8), or baseline history of other CVD (n=381; defined as angina, transient ischemic attack, vascular surgery, heart failure, or resuscitated cardiac arrest), there were 1731 cases and a subcohort of 1914 women (of whom 130 were also included in the cases because of the case–cohort design) available for analysis.
Figure 1.
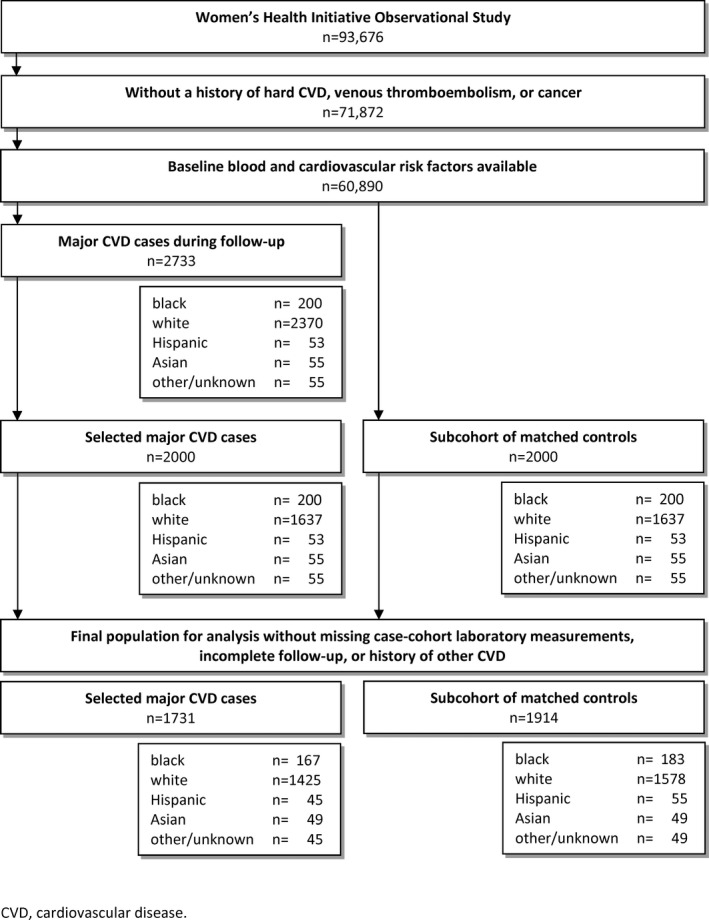
Flowchart for selection of participants in the case–cohort design. CVD indicates cardiovascular disease.
Ethical Approval
All participants of the WHI‐OS provided informed consent using materials approved by Institutional Review Boards at each of the 40 participating centers. This project was approved by the Institutional Review Board at the Brigham and Women's Hospital, Boston, MA.
Assessment of CVD Outcomes
Self‐reported outcome data through September 2008 were confirmed centrally through medical record review by trained physicians.12 MI and coronary death were combined for the CHD outcome. Medical records, ECGs, and cardiac enzyme and troponin levels were used for confirmation. Stroke was defined as sudden‐onset persistent neurologic deficit with neuro‐imaging correlate or lasting >24 hours, and compatible with obstruction or rupture of the cerebral vascular system in the absence of other causes. Strokes were classified as ischemic or hemorrhagic based on neuro‐imaging reports in all but 91 women. We analyzed those 91 strokes as part of the ischemic stroke outcome based on the greater prior probability of these events to be ischemic. Deaths were classified on the basis of death certificates, medical records, and autopsy reports. In 13 women, MI and stroke were diagnosed on the same date. These women were considered as CHD cases in the present analyses.
Assessment of Cardiovascular Risk Factors
Personal and family medical history were collected by questionnaire at baseline, including self‐reported diabetes mellitus (both treated and untreated),13 family history of a premature MI (defined as MI before age 55 years in men and 65 years in women), and smoking. Participants were asked to bring current medications to clinic visits to assess medication use. Resting blood pressure, weight, height, waist circumference, and hip circumference were all measured at the baseline visit.9 Waist circumference was measured at the natural waist over nonbinding undergarments at the end of exhalation. Body mass index was calculated as weight in kilograms divided by height in meters squared. Alcohol consumption was collected using the WHI food frequency questionnaire. The food frequency questionnaire was compared with means of four 24‐hour dietary recalls and a 4‐day food record and were found to have high reliability.14 Alcohol use was categorized as nondrinking, light drinking (<7 drinks per week), and moderate to heavy drinking (7 drinks per week or more). Nondrinking was considered the reference in all analyses. Physical activity was assessed by self‐administered questionnaire of recreational activity types. The energy expenditure associated with each activity was calculated using reported frequency and duration multiplied by intensity in metabolic equivalent hours from standardized classifications.15 Energy expenditure from all recreational physical activity was combined into a weekly total score.16 The physical activity questions were repeated for a subset of participants and the total expenditure in metabolic equivalent hours was found to have a weighted κ of 0.77.9
Plasma samples collected at study baseline were stored at −70°C and sent to a central laboratory certified by the Centers for Disease Control–National Heart Lung and Blood Institute Lipid Standardization Program. Details regarding the following measurements are provided in Data S1: total cholesterol, high‐density lipoprotein (HDL) cholesterol, apolipoprotein A‐I (Apo A‐I), apolipoprotein B100, lipoprotein (a), glycated hemoglobin A1c (among diabetics), high‐sensitivity C‐reactive protein (hs‐CRP), lipoprotein‐associated phospholipase A2 mass concentration, lipoprotein‐associated phospholipase A2 activity, N‐terminal pro‐brain natriuretic peptide (NT‐proBNP), and human tissue plasminogen activator antigen. A white blood cell count was obtained by local laboratories at each study site at the time of the baseline clinic visit.
Statistical Analysis
We estimated median levels and proportions for cardiovascular risk factors among cases and the subcohort of controls, both crude and after reweighting to reflect the total WHI‐OS cohort. Our method of stratified sampling from the known distribution in the full WHI‐OS cohort enabled us to estimate the characteristics of the full sample by reweighting using the sampling frequency in this case–cohort design.17, 18 Because of skewed distributions, we used the natural log of metabolic equivalent hours of physical activity, lipoprotein (a), white blood cell count, hs‐CRP, NT‐proBNP, and tissue plasminogen activator antigen levels. For continuous variables, SDs were derived from the subcohort. Pearson correlations were computed incorporating the sampling weights.
We examined the relation between cardiovascular risk factors and the separate first CVD manifestations using previously described methods for proportional hazards regression in case–cohort studies with appropriate weighting of the observations.19 We used weighted Cox regression to compute hazard ratios,20 and we computed asymptotic variance estimates.21 Results are presented for models that were adjusted for age and race/ethnicity. In a separate model, we additionally adjusted for the following traditional risk factors at baseline: treated and untreated systolic blood pressure, total and HDL cholesterol levels, diabetes mellitus, and smoking status.22 In order to avoid issues with co‐linearity of predictors, we specified a separate multivariable model for apolipoprotein A‐I and apolipoprotein B100 in which we did not adjust for total and HDL cholesterol. In addition, we used forward selection to fit models for each outcome separately to identify individual factors with the strongest statistically significant effects.
When studying first manifestations of CVD, the occurrence of 1 manifestation precludes consideration of any subsequent CVD event in the setting of primary prevention of CVD since follow‐up is censored at the occurrence of a first event. Such preclusion of disease‐specific outcomes by other outcomes is referred to as competing risks.23, 24 We used the data augmentation proposed by Lunn and McNeil to enable direct comparisons between the effect estimates of risk factors on specific first CVD manifestations by Cox regression.20, 21, 25 This allows inference on the difference between cause‐specific hazard ratios of individual risk factors for particular competing first CVD manifestations.24
We assessed the predictive ability of the risk markers in our study for the overall combined CVD outcome, CHD, and stroke types, separately. The fit of the models was evaluated using appropriate weighting. We quantified the discriminatory ability using a weighted version of the overall survival c‐statistic.26 Confidence intervals were quantified with 1000 bootstrap repetitions. Age and race/ethnicity were forced into all the models because of the sampling of the case–cohort data. All other selected predictors in the final multivariate models remained statistically significant at the P<0.05 level.
We used a level of significance of P<0.05. All measures of association are presented with 95% confidence intervals (95% CI). Data were analyzed using SAS version 9.3 (SAS Institute Inc, Cary, NC) and the mstate package in R version 3.1.1.27
Results
The baseline characteristics of the women in the subcohort and the CVD cases are described in Table 1. The average age was 67.7 (SD 6.7) years, 4.4% of the subcohort was diagnosed with diabetes mellitus, 25.7% used blood pressure–lowering drugs, 8.1% used statins, and 21.4% used aspirin. Table S1 includes reweighted characteristics to reflect the sampling from the underlying WHI‐OS population.
Table 1.
Baseline Characteristics of the Case–Cohort Sample of the WHI Observational Study Stratified by First CVD Manifestation
| Subcohort | CHD | Ischemic Stroke | Hemorrhagic Stroke | Other CVD Death | |
|---|---|---|---|---|---|
| n=1914 | n=703 | n=714 | n=157 | n=157 | |
| Age, y | 69 (63–73) | 68 (63–73) | 69 (64–73) | 68 (61–72) | 70 (64–74) |
| Race/ethnicity | |||||
| Black | 183 (9.6) | 65 (9.3) | 69 (9.7) | 18 (11.5) | 15 (9.6) |
| White | 1578 (82.5) | 584 (83.1) | 587 (82.2) | 125 (79.6) | 129 (82.2) |
| Hispanic | 55 (2.9) | 15 (2.1) | 19 (2.7) | 6 (3.8) | 5 (3.2) |
| Asian | 49 (2.6) | 14 (2.0) | 25 (3.5) | 4 (2.6) | 6 (3.8) |
| Other/unknown | 49 (2.6) | 25 (3.6) | 14 (2.0) | 4 (2.6) | 2 (1.3) |
| Family history of premature MI | 331 (17.3) | 173 (24.6) | 148 (20.7) | 26 (16.6) | 34 (21.7) |
| Smoking | |||||
| Never | 1019 (53.2) | 319 (45.4) | 371 (52.0) | 79 (50.3) | 68 (43.3) |
| Past | 809 (42.3) | 321 (45.7) | 289 (40.5) | 67 (42.7) | 67 (42.7) |
| Current | 86 (4.5) | 63 (9.0) | 54 (7.6) | 11 (7.0) | 22 (14.0) |
| Alcohol use | |||||
| Nondrinking | 561 (29.3) | 246 (35.0) | 235 (32.9) | 45 (28.7) | 58 (36.9) |
| Light drinking | 1095 (57.2) | 357 (50.8) | 385 (53.9) | 93 (59.2) | 80 (51.0) |
| Moderate/heavy drinking | 258 (13.5) | 100 (14.2) | 94 (13.2) | 19 (12.1) | 19 (12.1) |
| Physical activity, METs/wk | 10 (4–20) | 8 (2–17) | 8 (3–18) | 11 (4–22) | 6 (1–17) |
| Body mass index, kg/m2 | 25.8 (23.2–29.4) | 26.9 (23.8–31.0) | 26.3 (23.6–30.1) | 26.4 (23.2–29.3) | 27.0 (24.1–31.3) |
| Waist circumference, cm | 82 (75–92) | 86 (77–96) | 85 (77–95) | 82 (75–90) | 87 (77–97) |
| Waist–hip ratio | 0.80 (0.76–0.85) | 0.82 (0.77–0.88) | 0.82 (0.77–0.87) | 0.80 (0.76–0.85) | 0.83 (0.78–0.88) |
| Systolic blood pressure, mm Hg | 128 (117–140) | 132 (121–147) | 135 (123–149) | 131 (120–145) | 132 (121–143) |
| Diastolic blood pressure, mm Hg | 74 (68–80) | 75 (69–82) | 76 (70–82) | 78 (70–82) | 76 (70–82) |
| Use of blood pressure–lowering medication | 491 (25.7) | 264 (37.6) | 266 (37.3) | 46 (29.3) | 57 (36.3) |
| Total cholesterol, mg/dL | 225 (200–257) | 229 (200–260) | 221 (197–248) | 216 (193–240) | 231 (200–256) |
| HDL cholesterol, mg/dL | 55 (45–67) | 49 (40–60) | 48 (39–59) | 52 (43–65) | 51 (42–62) |
| Apo A‐I, mg/dL | 176 (152–206) | 167 (145–192) | 172 (149–200) | 169 (150–200) | 167 (150–196) |
| Apo B100, mg/dL | 97 (82–116) | 102 (87–123) | 98 (82–114) | 92 (75–106) | 101 (84–121) |
| Lp(a), mg/dL | 12.4 (5.2–30.9) | 12.6 (5.1–38.5) | 11.2 (5.0–32.6) | 12.5 (4.4–31.5) | 13.2 (6.3–33.4) |
| Use of statins | 155 (8.1) | 55 (7.8) | 55 (7.7) | 9 (5.7) | 9 (5.7) |
| Use of aspirin | 409 (21.4) | 180 (25.6) | 175 (24.5) | 41 (26.1) | 30 (19.1) |
| Diabetes mellitus | 84 (4.4) | 85 (12.1) | 66 (9.2) | 6 (3.8) | 12 (7.6) |
| HbA1c (if diabetic), % | 7.0 (6.3–8.0) | 7.4 (6.7–8.6) | 7.7 (6.9–9.6) | 6.9 (5.5–8.4) | 8.0 (7.1–8.8) |
| White blood cell count, 103/μL | 5.6 (4.8–6.7) | 6.1 (5.0–7.2) | 6.0 (5.0–7.2) | 5.6 (4.5–6.8) | 6.3 (5.2–7.5) |
| hs‐CRP, mg/L | 2.27 (1.03–4.86) | 3.12 (1.42‐6.02) | 2.98 (1.34–6.19) | 1.99 (0.98–4.02) | 3.51 (1.76–6.70) |
| Lp‐PLA2 activity, mmol/min per mL | 182 (150–214) | 195 (164–227) | 183 (153–217) | 177 (152–206) | 196 (166–226) |
| Lp‐PLA2 mass concentration, ng/mL | 482 (396–587) | 512 (428–628) | 524 (427–622) | 489 (411–592) | 502 (410–605) |
| NT‐proBNP, pg/mL | 101 (60–173) | 109 (65–191) | 130 (70–239) | 117 (70–181) | 151 (87–311) |
| tPA antigen, ng/mL | 6.27 (3.44–11.37) | 6.61 (3.74–13.42) | 6.24 (3.33–10.81) | 5.03 (3.21–9.19) | 7.02 (3.69–15.18) |
Values are counts (percentages) or medians (25th–75th percentile). See Table S1 for baseline characteristics reweighted to the full WHI population. Apo indicates apolipoprotein; CHD, coronary heart disease; CVD, cardiovascular disease; HbA1c, glycated hemoglobin A1c; HDL, high‐density lipoprotein; hs‐CRP, high‐sensitivity C‐reactive protein; Lp(a), lipoprotein (a); Lp‐PLA2, lipoprotein‐associated phospholipase A2; METs, metabolic equivalent hours; MI, myocardial infarction; NT‐proBNP, N‐terminal pro‐brain natriuretic peptide; tPA, tissue plasminogen activator; WHI, Women's Health Initiative.
Among the 1784 women in the subcohort who did not develop CVD, the median (25th–75th percentile) follow‐up time was 9.9 (8.7–11.8) years. Of the 1731 first CVD cases, 703 were CHD (526 clinical nonfatal MIs and 177 CHD deaths), 871 were strokes (714 ischemic and 157 hemorrhagic) and 157 other cardiovascular deaths. Of the 714 ischemic strokes, 623 were confirmed and 91 were probable ischemic but underlying cause could not be definitively adjudicated.
Nonlaboratory Risk Factors
All nonlaboratory risk factors were significantly associated with both CHD and ischemic stroke after adjustment for age and race/ethnicity (Table S2 and Figure S1). Measures of obesity, diabetes mellitus, and family history of premature MI were not predictive of hemorrhagic stroke. Further, although differences were not statistically significant, all other nonlaboratory risk factors were less predictive for hemorrhagic stroke as compared with the atherosclerotic outcomes.
In the multivariable models adjusted for traditional cardiovascular risk factors, physical activity and measures of obesity were no longer predictive of CHD (Figure 2A and Table 2). Age and systolic blood pressure were the only nonlaboratory predictors that significantly related to both types of stroke. In addition, diabetes mellitus and smoking were associated with ischemic stroke, whereas diastolic blood pressure was preferentially associated with hemorrhagic stroke. The difference in β coefficients between the 2 stroke types and CHD is shown in Figure 2B. Dots to the left of the vertical line indicate a less harmful association for the stroke type compared with CHD, while dots to the right of the line indicate a more harmful association for the stroke type compared with CHD. Generally, larger differences were seen when comparing risk factor associations for CHD with those for hemorrhagic stroke, than for the comparisons of CHD to ischemic stroke. Systolic blood pressure had a significantly stronger effect on the development of ischemic stroke as compared with CHD, whereas diastolic blood pressure had a much stronger effect on hemorrhagic stroke as compared with CHD or ischemic stroke. Effect estimates of diabetes mellitus and family history of premature MI were significantly lower, in fact inverse, for hemorrhagic stroke as compared with CHD. The pattern of risk factor associations for other CVD death resembled that of CHD, with notable greater effects for measures of obesity and current smoking. Patterns were similar for white and black women (Table S3).
Figure 2.
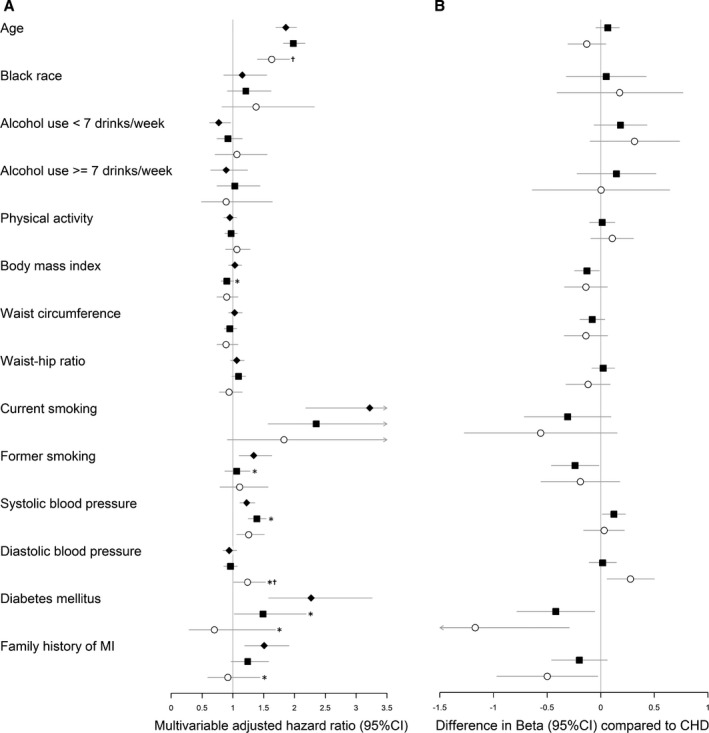
Multivariable adjusted hazard ratios and differences in multivariable adjusted β‐estimates between coronary heart disease and stroke hazards for nonlaboratory risk factors on the incidence of first cardiovascular manifestations. A, Values are multivariable‐adjusted cause‐specific hazard ratios of CHD (closed diamonds), ischemic stroke (closed squares), and hemorrhagic stroke (open circles). Hazard ratios are expressed per 1 (log‐transformed) SD increase for continuous risk factors. See Table 2 for corresponding cause‐specific hazard ratios. B, Values are differences in multivariable‐adjusted β‐estimates25 between hazards of CHD and ischemic stroke (closed squares), and between CHD and hemorrhagic stroke (open circles). Estimates are expressed per 1 (log‐transformed) SD increase for continuous risk factors. Differences in β‐estimates >0 represent greater hazards (or less protective). CHD hazards are considered the reference. Estimates (95% CIs) were adjusted for age, race/ethnicity, treated and untreated systolic blood pressure, total and HDL cholesterol levels, diabetes mellitus, and smoking status. CHD indicates coronary heart disease; CIs, confidence intervals; MI, myocardial infarction. *P<0.05 for equal association with CHD.25 † P<0.05 for equal association with ischemic stroke.25
Table 2.
Multivariable Adjusted Hazard Ratios for Nonlaboratory Risk Factors on the Incidence of First Cardiovascular Manifestations
| Risk Marker | CVD | CHD | Ischemic Stroke | Hemorrhagic Stroke | Other CVD Death |
|---|---|---|---|---|---|
| n=1731 | n=703 | n=714 | n=157 | n=157 | |
| Age (per SD) | 1.92 (1.81–2.05) | 1.86 (1.70–2.03) | 1.98 (1.82–2.17) | 1.63 (1.40–1.92)a | 2.32 (1.95–2.76)b , c |
| Black race (vs white) | 1.20 (0.98–1.48) | 1.15 (0.85–1.55) | 1.21 (0.91–1.62) | 1.38 (0.82–2.32) | 1.29 (0.73–2.28) |
| Light alcohol consumption | 0.84 (0.71–1.00) | 0.77 (0.62–0.96) | 0.92 (0.74–1.15) | 1.06 (0.71–1.56) | 0.66 (0.45–0.97) |
| Moderate to heavy alcohol consumption | 0.91 (0.70–1.19) | 0.89 (0.64–1.24) | 1.03 (0.74–1.44) | 0.89 (0.49–1.64) | 0.60 (0.33–1.10) |
| Physical activity (per Ln SD) | 0.96 (0.88–1.04) | 0.95 (0.85–1.06) | 0.97 (0.87–1.07) | 1.06 (0.88–1.28) | 0.83 (0.69–1.01) |
| Body mass index (per SD) | 0.99 (0.91–1.07) | 1.03 (0.93–1.14) | 0.90 (0.81–1.01)b | 0.90 (0.74–1.08) | 1.23 (1.05–1.46)b , a , c |
| Waist circumference (per SD) | 1.00 (0.92–1.09) | 1.03 (0.93–1.15) | 0.95 (0.86–1.06) | 0.89 (0.74–1.08) | 1.23 (1.03–1.46)a , c |
| Waist–hip ratio (per SD) | 1.07 (0.99–1.16) | 1.06 (0.96–1.18) | 1.09 (0.98–1.21) | 0.94 (0.78–1.15) | 1.14 (0.98–1.34) |
| Current smoking | 2.87 (2.07–3.98) | 3.22 (2.18–4.76) | 2.35 (1.57–3.52) | 1.83 (0.91–3.67) | 5.59 (3.19–9.79)a , c |
| Former smoking | 1.19 (1.02–1.39) | 1.34 (1.10–1.63) | 1.06 (0.87–1.28)b | 1.11 (0.79–1.57) | 1.33 (0.93–1.90) |
| Systolic blood pressure (per SD) | 1.29 (1.18–1.40) | 1.23 (1.11–1.36) | 1.39 (1.25–1.54)b | 1.26 (1.06–1.51) | 1.17 (0.98–1.40) |
| Diastolic blood pressure (per SD) | 0.98 (0.89–1.07) | 0.94 (0.84–1.06) | 0.96 (0.85–1.07) | 1.24 (1.01–1.53)b , a | 1.02 (0.83–1.25) |
| Diabetes mellitus | 1.71 (1.25–2.35) | 2.27 (1.58–3.26) | 1.49 (1.02–2.19)b | 0.70 (0.29–1.69)b | 1.40 (0.71–2.72) |
| Family history of premature MI | 1.33 (1.09–1.61) | 1.51 (1.19–1.91) | 1.24 (0.97–1.58) | 0.92 (0.59–1.44)b | 1.36 (0.89–2.06) |
Hazard ratios (95% CIs) were adjusted for age, race/ethnicity, treated and untreated systolic blood pressure, total and HDL cholesterol levels, diabetes mellitus, and current smoking. CHD, coronary heart disease; CIs, confidence intervals; CVD, cardiovascular disease; HDL, high‐density lipoprotein; Ln, natural log‐transformed; MI, myocardial infarction.
P<0.05 for equal association with ischemic stroke.25
P<0.05 for equal association with CHD.25
P<0.05 for equal association with hemorrhagic stroke.25
Laboratory‐Based Risk Factors
With the exception of lipoprotein (a), all laboratory‐based risk factors were predictive of CHD after adjustment for demographic factors (Table S4). Most laboratory markers were predictive of ischemic stroke. Non‐HDL cholesterol, the apolipoproteins, and NT‐proBNP stood out as significantly different from CHD (Figure S2). Directions of effect were largely similar for CHD and ischemic stroke. Increasing levels of non‐HDL cholesterol and apolipoprotein B100 were associated with a significantly lower risk of developing hemorrhagic stroke. Markers of inflammation and diabetes mellitus control were not predictive of hemorrhagic stroke. Levels of tissue plasminogen activator were not associated with either form of stroke and its risk estimates were significantly different from that for CHD.
In order to determine the effect of a small number of women with NT‐proBNP and hs‐CRP levels that could be considered in pathologically high ranges, these women were excluded from analysis (Data S1). The effect estimates did not materially change, and therefore the findings were not driven by a small number of CVD cases in women with extremely high levels of these risk factors.
Adjustment for other CVD risk factors generally lowered the effect estimates of the laboratory markers across all outcomes (Figure 3A and Table 3). Higher lipid levels remained associated with lower risk of hemorrhagic stroke. Both lipoprotein‐associated phospholipase A2 mass and NT‐proBNP remained significantly associated with all outcomes under study. The effect estimates of inflammatory markers were inverse for hemorrhagic stroke than for all other outcomes (Figure 3B). We observed similar patterns for white and black women (Table S5).
Figure 3.
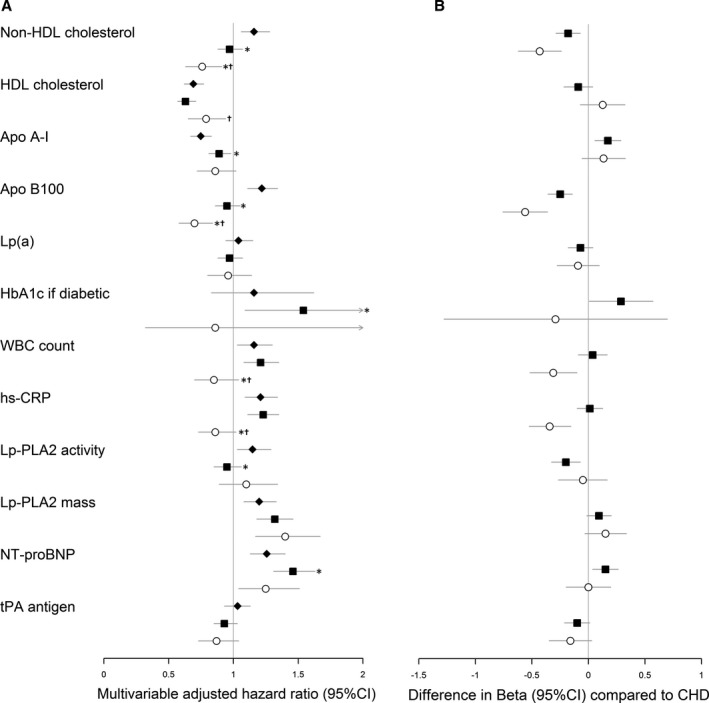
Multivariable adjusted hazard ratios and differences in β‐estimates between coronary heart disease and stroke hazards for laboratory‐based risk factors on the incidence of first cardiovascular manifestations. A, Values are multivariable adjusted cause‐specific hazard ratios of CHD (closed diamonds), ischemic stroke (closed squares), and hemorrhagic stroke (open circles). Hazard ratios are expressed per 1 (log‐transformed) SD increase. See Table 3 for corresponding cause‐specific hazard ratios. B, Values are differences in multivariable adjusted β‐estimates25 between hazards of CHD and ischemic stroke (closed squares), and between CHD and hemorrhagic stroke (open circles). Estimates are expressed per 1 (log‐transformed) SD increase. Differences in β‐estimates >0 represent greater hazards (or less protective). CHD hazards are considered the reference. Estimates (95% CIs) were adjusted for age, race/ethnicity, treated and untreated systolic blood pressure, total and HDL cholesterol levels, diabetes mellitus, and smoking status. Apo indicates apolipoprotein; CHD, coronary heart disease; HbA1c, glycated hemoglobin A1c; HDL, high‐density lipoprotein; hs‐CRP, high‐sensitivity C‐reactive protein; Lp(a), lipoprotein (a); Lp‐PLA2, lipoprotein‐associated phospholipase A2; NT‐proBNP, N‐terminal pro‐brain natriuretic peptide; tPA, tissue plasminogen activator; WBC, white blood cell. *P<0.05 for equal association with CHD.25 † P<0.05 for equal association with ischemic stroke.25
Table 3.
Multivariable Adjusted Hazard Ratios for Laboratory‐Based Risk Factors on the Incidence of First Cardiovascular Manifestations
| Risk Marker | CVD | CHD | Ischemic Stroke | Hemorrhagic Stroke | Other CVD Death |
|---|---|---|---|---|---|
| n=1731 | n=703 | n=714 | n=157 | n=157 | |
| Non‐HDL cholesterol (per SD) | 1.04 (0.97–1.12) | 1.16 (1.06–1.28) | 0.97 (0.88–1.07)a | 0.76 (0.63–0.91)a , b | 1.11 (0.94–1.31)c |
| HDL cholesterol (per SD) | 0.68 (0.63–0.74) | 0.69 (0.62–0.77) | 0.63 (0.57–0.71) | 0.79 (0.65–0.94)b | 0.75 (0.62–0.91) |
| Apo A‐I (per SD)d | 0.82 (0.76–0.89) | 0.75 (0.67–0.83) | 0.89 (0.81–0.98)a | 0.86 (0.72–1.02) | 0.85 (0.71–1.01) |
| Apo B100 (per SD)d | 1.05 (0.97–1.13) | 1.22 (1.11–1.34) | 0.95 (0.86–1.05)a | 0.70 (0.58–0.84)a , b | 1.15 (0.97–1.35)b , c |
| Lp(a) (per Ln SD) | 1.01 (0.93–1.09) | 1.04 (0.94–1.15) | 0.97 (0.88–1.07) | 0.96 (0.80–1.14) | 1.08 (0.91–1.29) |
| HbA1c if diabetic (per SD) | 1.33 (0.98–1.81) | 1.16 (0.83–1.62) | 1.54 (1.09–2.18)a | 0.86 (0.32–2.33) | 1.48 (0.87–2.54) |
| White blood cell count (per Ln SD) | 1.16 (1.06–1.27) | 1.16 (1.03–1.30) | 1.21 (1.08–1.35) | 0.85 (0.70–1.04)a , b | 1.34 (1.10–1.64)c |
| hs‐CRP (per Ln SD) | 1.20 (1.11–1.30) | 1.21 (1.09–1.34) | 1.23 (1.11–1.35) | 0.86 (0.73–1.02)a , b | 1.50 (1.26–1.80)a , b , c |
| Lp‐PLA2 activity (per SD) | 1.07 (0.97–1.17) | 1.15 (1.03–1.29) | 0.95 (0.85–1.06)a | 1.10 (0.89–1.34) | 1.24 (1.01–1.52)b |
| Lp‐PLA2 mass (per SD) | 1.25 (1.15–1.36) | 1.20 (1.08–1.33) | 1.32 (1.18–1.46) | 1.40 (1.17–1.67) | 1.08 (0.90–1.29)b , c |
| NT‐proBNP (per Ln SD) | 1.40 (1.29–1.53) | 1.26 (1.13–1.40) | 1.46 (1.31–1.63)a | 1.25 (1.04–1.51) | 1.99 (1.67–2.38)a , b , c |
| tPA antigen (per Ln SD) | 0.98 (0.91–1.06) | 1.03 (0.93–1.13) | 0.93 (0.85–1.03) | 0.87 (0.73–1.04) | 1.13 (0.96–1.33)b , c |
Hazard ratios (95% CIs) were adjusted for age, race/ethnicity, treated and untreated systolic blood pressure, total and HDL cholesterol levels, diabetes mellitus, and smoking status. Apo indicates apolipoprotein; CHD, coronary heart disease; CIs, confidence intervals; CVD, cardiovascular disease; HbA1c, glycated hemoglobin A1c; HDL, high‐density lipoprotein; hs‐CRP, high‐sensitivity C‐reactive protein; Ln, natural log‐transformed; Lp(a), lipoprotein (a); Lp‐PLA2, lipoprotein‐associated phospholipase A2; NT‐proBNP, N‐terminal pro‐brain natriuretic peptide; tPA, tissue plasminogen activator.
P<0.05 for equal association with CHD.25
P<0.05 for equal association with ischemic stroke.25
P<0.05 for equal association with hemorrhagic stroke.25
Apo A‐I and Apo B100 substituted non‐HDL cholesterol and HDL cholesterol.
Multivariable Models
HDL cholesterol, lipoprotein‐associated phospholipase A2 mass, and NT‐proBNP were the only markers that were highly predictive of all outcomes in the multivariable models (Table 4). Current smoking, systolic blood pressure, and hs‐CRP only contributed to identifying the atherosclerotic outcomes, whereas diastolic blood pressure was the only risk factor specific to predicting hemorrhagic stroke. Selection of the most predictive markers for each of the outcomes resulted in higher c‐statistics for CHD (0.788; 95% CI, 0.771–0.793) and ischemic stroke (0.810; 95% CI, 0.795–0.826) than for the overall combined CVD end point (0.782; 95% CI, 0.771–0.793). The discriminatory ability of the hemorrhagic stroke‐specific model was somewhat lower with a c‐statistic of 0.754 (95% CI, 0.721–0.788).
Table 4.
β‐Estimates and P Values for Significant Cardiovascular Risk Factors on the Incidence of First Cardiovascular Manifestations in Final Models Based on Forward Selection of Predictors
| Risk Marker | CVD | CHD | Ischemic Stroke | Hemorrhagic Stroke |
|---|---|---|---|---|
| n=1731 | n=703 | n=714 | n=157 | |
| Forced predictors | ||||
| Age (per SD) | 0.547, <0.0001 | 0.574, <0.0001 | 0.550, <0.0001 | 0.437, <0.0001 |
| Race/ethnicity (black vs white) | 0.404, 0.001 | 0.265, 0.10 | 0.334, 0.056 | 0.482, 0.074 |
| Race/ethnicity (other vs white) | 0.236, 0.0474 | 0.161, 0.34 | 0.180, 0.28 | 0.098, 0.74 |
| Nonlaboratory–based risk factors | ||||
| Light alcohol consumption | ··· | −0.208, 0.038 | ··· | ··· |
| Moderate/heavy alcohol consumption | ··· | ··· | ··· | ··· |
| Physical activity (per Ln SD) | ··· | ··· | ··· | ··· |
| Body mass index (per SD) | ··· | ··· | ··· | ··· |
| Waist circumference (per SD) | ··· | ··· | ··· | ··· |
| Waist‐hip ratio (per SD) | 0.112, 0.0074 | ··· | 0.140, 0.006 | ··· |
| Current smoking | 0.874, <0.0001 | 1.015, <0.0001 | 0.707, 0.0008 | ··· |
| Former smoking | ··· | 0.223, 0.030 | ··· | ··· |
| Systolic blood pressure (per SD) | 0.239, <0.0001 | 0.227, <0.0001 | 0.301, <0.0001 | ··· |
| Diastolic blood pressure (per SD) | ··· | ··· | ··· | 0.284, 0.0009 |
| Diabetes mellitus | 0.573, 0.0008 | 0.884, <0.0001 | ··· | ··· |
| Family history of premature MI | 0.266, 0.0082 | 0.398, 0.001 | ··· | ··· |
| Laboratory‐based risk factors | ||||
| Non‐HDL cholesterol (per SD) | ··· | ··· | ··· | ··· |
| HDL cholesterol (per SD) | −0.375, <0.0001 | −0.366, <0.0001 | −0.454, <0.0001 | −0.264, 0.005 |
| Apo A‐I (per SD) | ··· | ··· | ··· | ··· |
| Apo B100 (per SD) | ··· | ··· | −0.241, <0.0001 | −0.553, <0.0001 |
| Lp(a) (per Ln SD) | ··· | ··· | ··· | ··· |
| HbA1c if diabetic (per SD) | ··· | ··· | 0.414, 0.0015 | ··· |
| White blood cell count (per Ln SD) | ··· | ··· | ··· | ··· |
| hs‐CRP (per Ln SD) | 0.169, <0.0001 | 0.224, <0.0001 | 0.210, <0.0001 | ··· |
| Lp‐PLA2 activity (per SD) | ··· | ··· | ··· | ··· |
| Lp‐PLA2 mass (per SD) | 0.214, <0.0001 | 0.230, <0.0001 | 0.330, <0.0001 | 0.369, <0.0001 |
| NT‐proBNP (per Ln SD) | 0.341, <0.0001 | 0.197, 0.0004 | 0.380, <0.0001 | 0.235, 0.012 |
| tPA antigen (per Ln SD) | ··· | ··· | −0.104, 0.048 | ··· |
| C‐statistic (95% CI) | 0.782 (0.771–0.793) | 0.788 (0.771–0.805) | 0.810 (0.795–0.826) | 0.754 (0.721–0.788) |
Age and race/ethnicity were forced into the models because these were the sampling parameters for the selection in the case–cohort design. In order to avoid co‐linearity, we only allowed for waist–hip ratio, waist circumference, or body mass index; either non‐HDL cholesterol or Apo B100; either HDL cholesterol or Apo A‐I; and either Lp‐PLA2 activity or Lp‐PLA2 mass concentration. Apo indicates apolipoprotein; CI, confidence interval; CVD, cardiovascular disease; HbA1c, glycated hemoglobin A1c; HDL, high‐density lipoprotein; hs‐CRP, high‐sensitivity C‐reactive protein; Ln, natural log‐transformed; Lp(a), lipoprotein (a); Lp‐PLA2, lipoprotein‐associated phospholipase A2; MI, myocardial infarction; NT‐proBNP, N‐terminal pro‐brain natriuretic peptide; tPA, tissue plasminogen activator.
The overall combined CVD model had only slightly lower discriminative ability when applied to predict CHD only (c‐statistic 0.782; 95% CI, 0.766–0.799) and ischemic stroke only (c‐statistic 0.802; 95% CI, 0.786–0.817) as compared with the respective outcome‐specific models. The performance of the combined CVD model was markedly worse when applied to predict hemorrhagic stroke (c‐statistic 0.694; 95% CI, 0.656–0.735) as compared with the hemorrhagic stroke‐specific model.
Cardiovascular and Noncardiovascular Mortality
During follow‐up 50 women in the subcohort died of CVD and 131 of non‐CVD causes. In an additional 448 women, their sampled CVD event resulted in death within 28 days. This resulted in a total of 498 deaths caused by CVD in the mortality analyses. When looking at the specificity of CVD risk factors to differentiate between CVD and non‐CVD mortality, we noted that almost all risk factors were predictive of CVD mortality, with hs‐CRP and NT‐proBNP showing the strongest associations (Table S6). Hazard ratios were generally lower for non‐CVD mortality, with only current smoking and apolipoprotein A‐I reaching the level of statistical significance. Measures of obesity, blood pressure, hs‐CRP, and NT‐proBNP were preferentially associated with CVD death as compared with non‐CVD death.
Discussion
We used long‐term follow‐up data from a multi‐ethnic cohort of women to study a variety of putative cardiovascular risk factors. This is the largest study to date on this subject and, thereby, facilitated direct comparison of risk markers with each other and across different first CVD manifestations within a single population. Our results indicate that cardiovascular risk factors generally have largely similar associations with risk of CHD and ischemic stroke; however, the effect sizes varied. We noted prominent differences in risk factor profiles for hemorrhagic stroke, which resulted in a diminished ability to identify women at increased overall CVD risk.
Context
Previous studies on differential effects of risk factors were done in men or only included traditional risk factors.4, 6, 7 The studies in men compared CHD and stroke, but did not differentiate between ischemic and hemorrhagic stroke.6, 7 Therefore, it is challenging to compare the results of these studies with our findings. A consistent finding across all studies is the markedly stronger association of age with stroke and other CVD death as compared with CHD. This is in line with the observation that CHD as a first manifestation of CVD occurs relatively more frequently in younger individuals, whereas older women who experience a first CVD event are more likely to be diagnosed with stroke or other CVD death.1
NT‐proBNP was the strongest biomarker in our study related to overall CVD risk and was significantly associated with each CVD manifestation under study. NT‐proBNP is a marker of cardiac wall stress and as such is introduced into clinical practice as a diagnostic and prognostic biomarker for heart failure. However, population studies have not only identified NT‐proBNP as a strong predictor of heart failure, but also other CVD events in healthy individuals.28, 29, 30 Elucidating the underlying mechanism for the stronger effect of NT‐proBNP on stroke as compared with CHD requires further work. Subclinical atrial fibrillation and ventricular dysfunction have been recently postulated as mechanisms through which NT‐proBNP affects stroke risk.31, 32 NT‐proBNP and CRP have previously been identified as the 2 strongest biomarkers, among 30 others, for CVD risk prediction in 2 European populations.33 Notably, we found that both these biomarkers are also among the few that are very CVD‐specific when we compared their effects on different causes of death. Such specificity is relevant for potential risk stratification, especially in elderly who are at substantial risk of death from non‐CVD causes.
Prediction of each end point separately led to slightly better discrimination in our analysis when we allowed β coefficients for the risk factors to vary for CHD and stroke. This strategy of decomposing overall CVD risk prediction has previously been shown to improve the accuracy of risk models.34, 35 Another advantage of this approach is that it can provide clinicians and patients with information on how the CVD risk is built up.34 Information on whether an individuals’ overall CVD risk is driven by either coronary risk or stroke risk may matter for individualized preventive treatment. For instance, in a large meta‐analysis, statin use may confer a greater risk reduction on CHD than on stroke (relative risk 0.76 for CHD versus 0.85 for ischemic stroke, and nonsignificant increased risk with hemorrhagic stroke),36 whereas a number of blood pressure–lowering agents confer a greater relative risk reduction on stroke than CHD.37 The preferential association of lipids with CHD and of blood pressure with stroke we observe is therefore in line with the data from these intervention studies.
Hemorrhagic Stroke
In large population studies and trials, multiple cardiovascular manifestations are often combined into a composite CVD end point in order to increase statistical power. This is done under reasonable assumptions that cardiovascular risk factors (or interventions modifying cardiovascular risk factor levels) contribute in a similar fashion to the occurrence of various types of CVD. Our results confirm that risk factor patterns for CHD and ischemic stroke are largely similar with congruent directions of effect. However, we noted clear differences in the risk factor pattern for hemorrhagic stroke in both directionality and magnitude of effects. Non‐HDL cholesterol and apolipoprotein B100 were positively associated with CHD, but inversely associated with hemorrhagic stroke. In line with our results, the recent work in the EPIC‐Norfolk population study indicated increased risks of low‐density lipoprotein cholesterol on CHD and to a lesser extent ischemic stroke, but protective effects on hemorrhagic stroke.4 These results are also consistent with a previous analysis of 3 large prospective cohort studies, including >15 000 women, showing inverse associations of total cholesterol with the risk of hemorrhagic stroke.5 Also mirroring our results, this study found no relation between diabetes mellitus and hemorrhagic stroke. These differences in risk factor profiles highlight the distinct biology of hemorrhagic stroke from other atherosclerotic CVD manifestations. As a consequence, risk models combining ischemic and hemorrhagic stroke into a composite outcome have a poorer ability to identify individuals at increased risk of all stroke types combined.
Despite the different risk profile associated with hemorrhagic stroke, the global cardiovascular risk calculators advocated by the American College of Cardiology/American Heart Association and European Society of Cardiology to identify candidates for statin therapy do not distinguish between stroke types.35, 38 The addition of ischemic stroke to the previous CHD calculator was called for by several US research councils.39 This is relevant since statins and aspirin decrease the risk of ischemic stroke.36, 40 Yet, statins do not reduce the risk of hemorrhagic stroke (or might even increase hemorrhagic stroke risk),41 and aspirin is associated with increased risk of intracranial bleeding.40 For that reason, the most recent guidelines on aspirin use in primary prevention of CVD recommend to estimate bleeding risk and CVD risk separately in order to assess the anticipated net clinical benefit of long‐term aspirin use.42
We acknowledge that often it is difficult to make a clear distinction between ischemic and hemorrhagic stroke, given that the clinical syndrome is very similar. Limited clinical information or lack of neuro‐imaging poses a challenge for stroke typing in clinical research. In the present analysis, 10.4% of the strokes could not be further categorized. A common way to overcome this is to analyze unspecified strokes as if they were of ischemic origin based on prior probability,5, 43 rather than making no distinction at all and combine all strokes into a composite outcome.
Limitations
A number of limitations need to be considered. Our results were generated from a single cohort with baseline measures collected in a particular era of available treatments. This cohort included only women; thus, the generalizability of our findings is limited because of the sex differences in first manifestations of CVD.1 Similarly, previous work has shown that CVD manifests differently in whites and blacks.44 We did not observe major differences between white and black women in patterns for most risk factors; however, the number of cases available in nonwhites was limited. Second, previous work from the WHI trials has focused on the differential effects of hormone replacement therapy on stroke types in women.45, 46 Because of the observational nature of our study, we did not focus on differential effects of medication use, including hormone replacement therapy and statins, on the various CVD outcomes. The interpretation of effect estimates for medication use in observational data is complicated because it reflects a combination of pharmacological effects, confounding by indication, confounding by severity, and a selection bias related to a positive attitude towards prevention in general, which cannot be disentangled.47 Third, the CHD and stroke outcomes in our study included nonfatal and fatal events, whereas the other CVD outcome only included fatal events. This could have affected our comparison between the different first manifestations because relative risk estimates between fatal and nonfatal events may differ. Similarly, risk factor estimates may differ when strokes are divided into specific subtypes, such as based on infarct type or bleeding location. Fourth, we present a substantial number of statistical comparisons for equal association. Many of these comparisons are correlated or test the same hypothesis using different biomarkers. For instance, we included multiple correlated parameters for obesity, dyslipidemia, and inflammation. If we take a most conservative approach by assuming all comparisons are completely independent and hypothesis free, 9 comparisons in the fully adjusted models in Figure 3 would remain statistically significant at a Bonferroni threshold of P<0.00139. Next, data on repeated measurements of risk factors were unavailable for the majority of risk factors. Therefore, we used baseline measurements of biomarkers throughout the analyses. Last, for a number of outcomes, such as hemorrhagic stroke and non‐CVD mortality, we had a limited number of events available for analysis. This resulted in a limited statistical power to detect small differences in effect estimates.
Conclusions
In summary, in middle‐aged and older women free of CVD, both traditional and newer cardiovascular risk factors have largely similar effects on the incidence of atherosclerotic CVD manifestations, although the magnitude of associations may vary. However, determinants of ischemic and hemorrhagic stroke substantially differ, underscoring their distinct biology. Our findings suggest that CVD risk may be more accurately reflected when combined CVD or cerebrovascular outcomes are broken down into different first manifestations, or when the composite end point is restricted to ischemic outcomes only.
Sources of Funding
This project was supported by the National Heart, Lung, and Blood Institute (NHLBI; HHSN268200960011C). The WHI program is funded by the NHLBI; the National Institutes of Health (NIH); and the U.S. Department of Health and Human Services (N01‐WH‐22110; 24152; 32100‐2; 32105‐6; 32108‐9; 32111‐13; 32115; 32118‐9; 32122; 42107‐26; 42129‐32; 44221; HHSN268201100046C, HHSN268201100001C, HHSN268201100002C, HHSN268201100003C, HHSN268201100004C, and HHSN271201100004C). Dr Leening is supported by a Prins Bernhard Cultuurfonds Fellowship (30140588); the De Drie Lichten Foundation (04/14); and the Erasmus University Trustfonds. None of the funders had any role in design and conduct of the study; collection, management, analysis, and interpretation of the data; and preparation, review, or approval of the manuscript.
Disclosures
Dr Franco works in ErasmusAGE, a center for aging research across the life course funded by Nestlé Nutrition (Nestec Ltd); Metagenics Inc; and AXA. Dr Leira receives salary support from the NIH National Institute of Neurological Disorders and Stroke. Dr Robinson has received research grants paid to institution from Amarin; Amgen; AstraZeneca; Eli Lilly; Esai; Glaxo‐Smith Kline; Merck; Pfizer; Regeneron/Sanofi; and Takeda. Dr Robinson has acted as a consultant for Akcea/Ionis; Amgen; Eli Lilly; Esperion; Merck; Pfizer; and Regeneron/Sanofi. Dr Ridker has received research support from AstraZeneca; Pfizer, and Novartis. The remaining authors have no disclosures to report.
Supporting information
Data S1. Assessment of Blood Biomarkers.
Table S1. Reweighted Baseline Characteristics of the Case–Cohort Sample of the Women's Health Initiative Observational Study Stratified by First CVD Manifestation
Table S2. Hazard Ratios for Nonlaboratory Risk Factors on the Incidence of First Cardiovascular Manifestations
Table S3. Multivariable Adjusted Hazard Ratios for Nonlaboratory Risk Factors on the Incidence of First Cardiovascular Manifestations in White and Black Women
Table S4. Hazard Ratios for Laboratory‐Based Risk Factors on the Incidence of First Cardiovascular Manifestations
Table S5. Multivariable Adjusted Hazard Ratios for Laboratory‐Based Risk Factors on the Incidence of First Cardiovascular Manifestations in White and Black Women
Table S6. Hazard Ratios for Cardiovascular Risk Factors on the Incidence of Cardiovascular and Noncardiovascular Death
Figure S1. Differences in β‐estimates between coronary heart disease and stroke hazards for nonlaboratory risk factors on the incidence of first cardiovascular manifestations.
Figure S2. Differences in β‐estimates between coronary heart disease and stroke hazards for laboratory‐based risk factors on the incidence of first cardiovascular manifestations.
Acknowledgments
We thank the WHI participants, staff, and investigators for their dedication and commitment. A full listing of WHI investigators can be found at https://www.whi.org/researchers/Documents%20%20Write%20a%20Paper/WHI%20Investigator%20Long%20List.pdf. We thank Eunjung Kim for her valuable statistical support.
(J Am Heart Assoc. 2018;7:e007514 DOI: 10.1161/JAHA.117.007514.)
References
- 1. Leening MJG, Ferket BS, Steyerberg EW, Kavousi M, Deckers JW, Nieboer D, Heeringa J, Portegies MLP, Hofman A, Ikram MA, Hunink MGM, Franco OH, Stricker BHCh, Witteman JCM, Roos‐Hesselink JW. Sex differences in lifetime risk and first manifestations of cardiovascular disease: prospective population based cohort study. BMJ. 2014;349:g5992. [DOI] [PMC free article] [PubMed] [Google Scholar]
- 2. Anderson KM, Odell PM, Wilson PWF, Kannel WB. Cardiovascular disease risk profiles. Am Heart J. 1991;121:293–298. [DOI] [PubMed] [Google Scholar]
- 3. Everett BM, Kurth T, Buring JE, Ridker PM. The relative strength of C‐reactive protein and lipid levels as determinants of ischemic stroke compared with coronary heart disease in women. J Am Coll Cardiol. 2006;48:2235–2242. [DOI] [PMC free article] [PubMed] [Google Scholar]
- 4. Stoekenbroek RM, Boekholdt SM, Luben R, Hovingh GK, Zwinderman AH, Wareham NJ, Khaw KT, Peters RJG. Heterogeneous impact of classic atherosclerotic risk factors on different arterial territories: the EPIC‐Norfolk prospective population study. Eur Heart J. 2016;37:880–889. [DOI] [PubMed] [Google Scholar]
- 5. Ferket BS, van Kempen BJH, Wieberdink RG, Steyerberg EW, Koudstaal PJ, Hofman A, Shahar E, Gottesman RF, Rosamond W, Kizer JR, Kronmal RA, Psaty BM, Longstreth WT Jr, Mosley T, Folsom AR, Hunink MGM, Ikram MA. Separate prediction of intracerebral hemorrhage and ischemic stroke. Neurology. 2014;82:1804–1812. [DOI] [PMC free article] [PubMed] [Google Scholar]
- 6. Glynn RJ, Rosner B. Methods to evaluate risks for composite end points and their individual components. J Clin Epidemiol. 2004;57:113–122. [DOI] [PubMed] [Google Scholar]
- 7. Glynn RJ, Rosner B. Comparison of risk factors for the competing risks of coronary heart disease, stroke, and venous thromboembolism. Am J Epidemiol. 2005;162:975–982. [DOI] [PubMed] [Google Scholar]
- 8. Women's Health Initiative—Researchers. Available at: http://www.whi.org/researchers/. Accessed August 15, 2018.
- 9. Langer RD, White E, Lewis CE, Kotchen JM, Hendrix SL, Trevisan M. The Women's Health Initiative Observational Study: baseline characteristics of participants and reliability of baseline measures. Ann Epidemiol. 2003;13:S107–S121. [DOI] [PubMed] [Google Scholar]
- 10. Cook NR, Paynter NP, Eaton CB, Manson JE, Martin LW, Robinson JG, Rossouw JE, Wassertheil‐Smoller S, Ridker PM. Comparison of the Framingham and Reynolds Risk scores for global cardiovascular risk prediction in the multiethnic Women's Health Initiative. Circulation. 2012;125:1748–1756, S1–S11. [DOI] [PMC free article] [PubMed] [Google Scholar]
- 11. Margolis KL, Manson JE, Greenland P, Rodabough RJ, Bray PF, Safford M, Grimm RH Jr, Howard BV, Assaf AR, Prentice R; for the Women's Health Initiative Research Group . Leukocyte count as a predictor of cardiovascular events and mortality in postmenopausal women: the Women's Health Initiative Observational Study. Arch Intern Med. 2005;165:500–508. [DOI] [PubMed] [Google Scholar]
- 12. Curb JD, McTiernan A, Heckbert SR, Kooperberg C, Stanford J, Nevitt M, Johnson KC, Proulx‐Burns L, Pastore L, Criqui M, Daugherty S; for the WHI Morbidity and Mortality Committee . Outcomes ascertainment and adjudication methods in the Women's Health Initiative. Ann Epidemiol. 2003;13:S122–S128. [DOI] [PubMed] [Google Scholar]
- 13. Margolis KL, Lihong Q, Brzyski R, Bonds DE, Howard BV, Kempainen S, Simin L, Robinson JG, Safford MM, Tinker LT, Phillips LS. Validity of diabetes self‐reports in the Women's Health Initiative: comparison with medication inventories and fasting glucose measurements. Clin Trials. 2008;5:240–247. [DOI] [PMC free article] [PubMed] [Google Scholar]
- 14. Patterson RE, Kristal AR, Tinker LF, Carter RA, Bolton MP, Agurs‐Collins T. Measurement characteristics of the Women's Health Initiative food frequency questionnaire. Ann Epidemiol. 1999;9:178–187. [DOI] [PubMed] [Google Scholar]
- 15. Ainsworth BE, Haskell WL, Whitt MC, Irwin ML, Swartz AM, Strath SJ, O'Brien WL, Bassett DR Jr, Schmitz KH, Emplaincourt PO, Jacobs DR Jr, Leon AS. Compendium of physical activities: an update of activity codes and MET intensities. Med Sci Sports Exerc. 2000;32:S498–S504. [DOI] [PubMed] [Google Scholar]
- 16. Manson JE, Greenland P, LaCroix AZ, Stefanick ML, Mouton CP, Oberman A, Perri MG, Sheps DS, Pettinger MB, Siscovick DS. Walking compared with vigorous exercise for the prevention of cardiovascular events in women. N Engl J Med. 2002;347:716–725. [DOI] [PubMed] [Google Scholar]
- 17. Borgan Ø, Langholz B, Samuelsen SO, Goldstein L, Pogoda J. Exposure stratified case‐cohort designs. Lifetime Data Anal. 2000;6:39–58. [DOI] [PubMed] [Google Scholar]
- 18. Horvitz DG, Thompson DJ. A generalization of sampling without replacement from a finite universe. J Am Stat Assoc. 1952;47:663–685. [Google Scholar]
- 19. Barlow WE. Robust variance estimation for the case‐cohort design. Biometrics. 1994;50:1064–1072. [PubMed] [Google Scholar]
- 20. Therneau TM, Li H. Computing the Cox model for case cohort designs. Lifetime Data Anal. 1999;5:99–112. [DOI] [PubMed] [Google Scholar]
- 21. Langholz B, LJiao J. Computational methods for case‐control studies. Comput Stat Data Anal. 2007;51:3737–3748. [Google Scholar]
- 22. D'Agostino RB Sr, Vasan RS, Pencina MJ, Wolf PA, Cobain M, Massaro JM, Kannel WB. General cardiovascular risk profile for use in primary care: the Framingham Heart Study. Circulation. 2008;117:743–753. [DOI] [PubMed] [Google Scholar]
- 23. Satagopan JM, Ben‐Porat L, Berwick M, Robson M, Kutler D, Auerbach AD. A note on competing risks in survival data analysis. Br J Cancer. 2004;91:1229–1235. [DOI] [PMC free article] [PubMed] [Google Scholar]
- 24. Putter H, Fiocco M, Geskus RB. Tutorial in biostatistics: competing risks and multi‐state models. Stat Med. 2007;26:2389–2430. [DOI] [PubMed] [Google Scholar]
- 25. Lunn M, McNeil D. Applying Cox regression to competing risks. Biometrics. 1995;51:524–532. [PubMed] [Google Scholar]
- 26. Pencina MJ, D'Agostino RB. Overall C as a measure of discrimination in survival analysis: model specific population value and confidence interval estimation. Stat Med. 2004;23:2109–2123. [DOI] [PubMed] [Google Scholar]
- 27. de Wreede LC, Fiocco M, Putter H. The mstate package for estimation and prediction in non‐ and semi‐parametric multi‐state and competing risks models. Comput Methods Programs Biomed. 2010;99:261–274. [DOI] [PubMed] [Google Scholar]
- 28. Di Angelantonio E, Chowdhury R, Sarwar N, Ray KK, Gobin R, Saleheen D, Thompson A, Gudnason V, Sattar N, Danesh J. B‐type natriuretic peptides and cardiovascular risk: systematic review and meta‐analysis of 40 prospective studies. Circulation. 2009;120:2177–2187. [DOI] [PubMed] [Google Scholar]
- 29. Everett BM, Berger JS, Manson JE, Ridker PM, Cook NR. B‐type natriuretic peptides improve cardiovascular disease risk prediction in a cohort of women. J Am Coll Cardiol. 2014;64:1789–1797. [DOI] [PMC free article] [PubMed] [Google Scholar]
- 30. Everett BM, Ridker PM, Cook NR, Pradhan AD. Usefulness of B‐type natriuretic peptides to predict cardiovascular events in women (from the Women's Health Study). Am J Cardiol. 2015;116:532–537. [DOI] [PMC free article] [PubMed] [Google Scholar]
- 31. Folsom AR, Nambi V, Bell EJ, Oluleye OW, Gottesman RF, Lutsey PL, Huxley RR, Ballantyne CM. Troponin T, N‐terminal pro‐B‐type natriuretic peptide, and incidence of stroke: the Atherosclerosis Risk in Communities Study. Stroke. 2013;44:961–967. [DOI] [PMC free article] [PubMed] [Google Scholar]
- 32. Portegies MLP, Kavousi M, Leening MJG, Bos MJ, van den Meiracker AH, Hofman A, Franco OH, Koudstaal PJ, Ikram MA. N‐terminal pro‐B‐type natriuretic peptide and the risk of stroke and transient ischaemic attack: the Rotterdam Study. Eur J Neurol. 2015;22:695–701. [DOI] [PubMed] [Google Scholar]
- 33. Blankenberg S, Zeller T, Saarela O, Havulinna AS, Kee F, Tunstall‐Pedoe H, Kuulasmaa K, Yarnell J, Schnabel RB, Wild PS, Münzel TF, Lackner KJ, Tiret L, Evans A, Salomaa V; for the Morgam Project . Contribution of 30 biomarkers to 10‐year cardiovascular risk estimation in 2 population cohorts: the MONICA, risk, genetics, archiving, and monograph (MORGAM) biomarker project. Circulation. 2010;121:2388–2397. [DOI] [PubMed] [Google Scholar]
- 34. van Kempen BJH, Ferket BS, Kavousi M, Leening MJG, Steyerberg EW, Ikram MA, Witteman JCM, Hofman A, Franco OH, Hunink MGM. Performance of Framingham cardiovascular disease (CVD) predictions in the Rotterdam Study taking into account competing risks and disentangling CVD into coronary heart disease (CHD) and stroke. Int J Cardiol. 2014;171:413–418. [DOI] [PubMed] [Google Scholar]
- 35. Conroy RM, Pyörälä K, Fitzgerald AP, Sans S, Menotti A, De Backer G, De Bacquer D, Ducimetière P, Jousilahti P, Keil U, Njølstad I, Oganov RG, Thomsen T, Tunstall‐Pedoe H, Tverdal A, Wedel H, Whincup P, Wilhelmsen L, Graham IM; on behalf of the SCORE project group . Estimation of ten‐year risk of fatal cardiovascular disease in Europe: the SCORE project. Eur Heart J. 2003;24:987–1003. [DOI] [PubMed] [Google Scholar]
- 36. Cholesterol Treatment Trialists’ (CTT) Collaborators . The effects of lowering LDL cholesterol with statin therapy in people at low risk of vascular disease: meta‐analysis of individual data from 27 randomised trials. Lancet. 2012;380:581–590. [DOI] [PMC free article] [PubMed] [Google Scholar]
- 37. Blood Pressure Lowering Treatment Trialists’ Collaboration . Effects of different blood‐pressure‐lowering regimens on major cardiovascular events: results of prospectively‐designed overviews of randomised trials. Lancet. 2003;362:1527–1535. [DOI] [PubMed] [Google Scholar]
- 38. Goff DC Jr, Lloyd‐Jones DM, Bennett G, Coady S, D'Agostino RB Sr, Gibbons R, Greenland P, Lackland DT, Levy D, O'Donnell CJ, Robinson JG, Schwartz JS, Shero ST, Smith SC Jr, Sorlie P, Stone NJ, Wilson PWF. 2013 ACC/AHA guideline on the assessment of cardiovascular risk: a report of the American College of Cardiology/American Heart Association Task Force on Practice Guidelines. Circulation. 2014;129:S49–S73. [DOI] [PubMed] [Google Scholar]
- 39. Lackland DT, Elkind MS, D'Agostino R Sr, Dhamoon MS, Goff DC Jr, Higashida RT, McClure LA, Mitchell PH, Sacco RL, Sila CA, Smith SC Jr, Tanne D, Tirschwell DL, Touzé E, Wechsler LR; on behalf of the American Heart Association Stroke Council, Council on Epidemiology and Prevention, Council on Cardiovascular Radiology and Intervention, Council on Cardiovascular Nursing, Council on Peripheral Vascular Disease, and Council on Quality of Care and Outcomes Research . Inclusion of stroke in cardiovascular risk prediction instruments: a statement for healthcare professionals from the American Heart Association/American Stroke Association. Stroke. 2012;43:1998–2027. [DOI] [PubMed] [Google Scholar]
- 40. Berger JS, Roncaglioni MC, Avanzini F, Pangrazzi I, Tognoni G, Brown DL. Aspirin for the primary prevention of cardiovascular events in women and men: a sex‐specific meta‐analysis of randomized controlled trials. JAMA. 2006;295:306–313. [DOI] [PubMed] [Google Scholar]
- 41. Hackam DG, Woodward M, Newby LK, Bhatt DL, Shao M, Smith EE, Donner A, Mamdani M, Douketis JD, Arima H, Chalmers J, MacMahon S, Tirschwell DL, Psaty BM, Bushnell CD, Aguilar MI, Capampangan DJ, Werring DJ, De Rango P, Viswanathan A, Danchin N, Cheng CL, Yang YH, Verdel BM, Lai MS, Kennedy J, Uchiyama S, Yamaguchi T, Ikeda Y, Mrkobrada M. Statins and intracerebral hemorrhage: collaborative systematic review and meta‐analysis. Circulation. 2011;124:2233–2242. [DOI] [PubMed] [Google Scholar]
- 42. Bibbins‐Domingo K; on behalf of the U. S. Preventive Services Task Force . Aspirin use for the primary prevention of cardiovascular disease and colorectal cancer: U.S. Preventive Services Task Force Recommendation Statement. Ann Intern Med. 2016;164:836–845. [DOI] [PubMed] [Google Scholar]
- 43. Hippisley‐Cox J, Coupland C, Brindle P. Derivation and validation of QStroke score for predicting risk of ischaemic stroke in primary care and comparison with other risk scores: a prospective open cohort study. BMJ. 2013;346:f2573. [DOI] [PMC free article] [PubMed] [Google Scholar]
- 44. Feinstein M, Ning H, Kang J, Bertoni A, Carnethon M, Lloyd‐Jones DM. Racial differences in risks for first cardiovascular events and noncardiovascular death: the Atherosclerosis Risk in Communities Study, the Cardiovascular Health Study, and the Multi‐Ethnic Study of Atherosclerosis. Circulation. 2012;126:50–59. [DOI] [PMC free article] [PubMed] [Google Scholar]
- 45. Wassertheil‐Smoller S, Hendrix SL, Limacher M, Heiss G, Kooperberg C, Baird A, Kotchen T, Curb JD, Black H, Rossouw JE, Aragaki A, Safford M, Stein E, Laowattana S, Mysiw WJ; for the WHI Investigators . Effect of estrogen plus progestin on stroke in postmenopausal women: the Women's Health Initiative: a randomized trial. JAMA. 2003;289:2673–2684. [DOI] [PubMed] [Google Scholar]
- 46. Hendrix SL, Wassertheil‐Smoller S, Johnson KC, Howard BV, Kooperberg C, Rossouw JE, Trevisan M, Aragaki A, Baird AE, Bray PF, Buring JE, Criqui MH, Herrington D, Lynch JK, Rapp SR, Torner J; for the WHI Investigators . Effects of conjugated equine estrogen on stroke in the Women's Health Initiative. Circulation. 2006;113:2425–2434. [DOI] [PubMed] [Google Scholar]
- 47. Salas M, Hofman A, Stricker BH. Confounding by indication: an example of variation in the use of epidemiologic terminology. Am J Epidemiol. 1999;149:981–983. [DOI] [PubMed] [Google Scholar]
Associated Data
This section collects any data citations, data availability statements, or supplementary materials included in this article.
Supplementary Materials
Data S1. Assessment of Blood Biomarkers.
Table S1. Reweighted Baseline Characteristics of the Case–Cohort Sample of the Women's Health Initiative Observational Study Stratified by First CVD Manifestation
Table S2. Hazard Ratios for Nonlaboratory Risk Factors on the Incidence of First Cardiovascular Manifestations
Table S3. Multivariable Adjusted Hazard Ratios for Nonlaboratory Risk Factors on the Incidence of First Cardiovascular Manifestations in White and Black Women
Table S4. Hazard Ratios for Laboratory‐Based Risk Factors on the Incidence of First Cardiovascular Manifestations
Table S5. Multivariable Adjusted Hazard Ratios for Laboratory‐Based Risk Factors on the Incidence of First Cardiovascular Manifestations in White and Black Women
Table S6. Hazard Ratios for Cardiovascular Risk Factors on the Incidence of Cardiovascular and Noncardiovascular Death
Figure S1. Differences in β‐estimates between coronary heart disease and stroke hazards for nonlaboratory risk factors on the incidence of first cardiovascular manifestations.
Figure S2. Differences in β‐estimates between coronary heart disease and stroke hazards for laboratory‐based risk factors on the incidence of first cardiovascular manifestations.