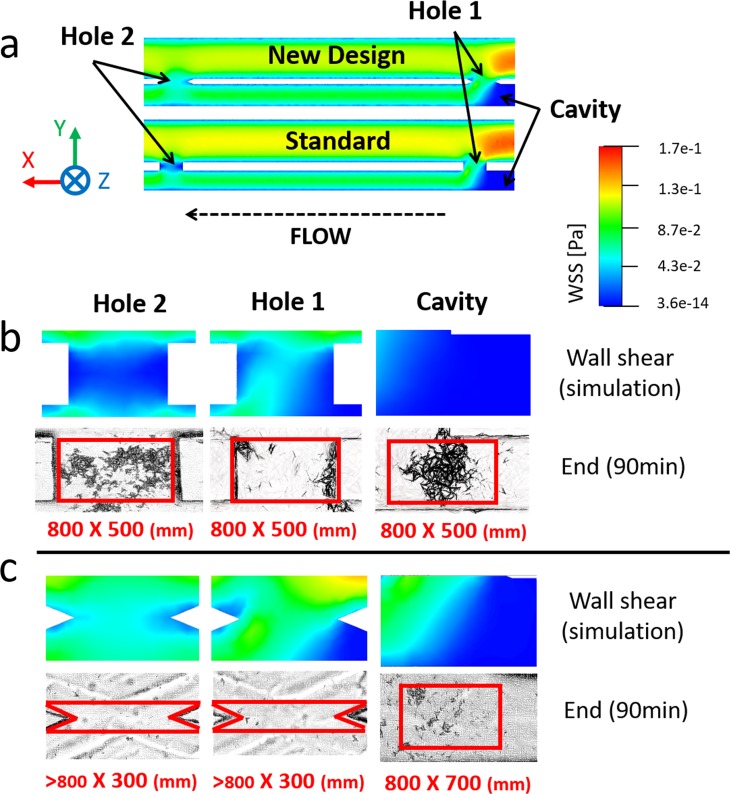
FIG. 12.
(a) Contours of WSS magnitude at the bottom plane of the SoC model, computed numerically for both standard design and optimised design. (b) and (c) Contours of WSS at three hydrodynamic regions within the model (Hole 1, Hole 2, and Cavity) and corresponding microscope images showing encrusting deposits, at an inlet flow rate of 1 ml/min and for both (b) standard shape (referred to as 0.5S) and (c) optimised design (referred to as 0.3N45). Images were taken at 90 min from the beginning of the experiment (n = 3). Red boxes (with their size reported underneath, as “width × height” in mm) correspond to the regions of interest over which the percentage area covered by encrustation was calculated.

