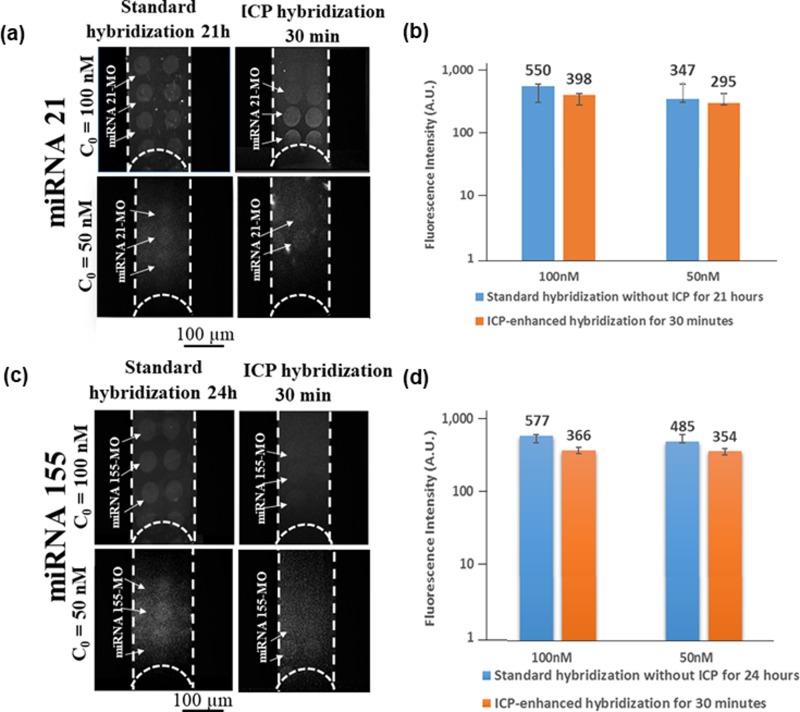
FIG. 3.
Comparison of fluorescence intensity with and without ICP enhancement for miRNA 21 and 155 at 50 nM and 100 nM. (a) Fluorescence micrographs for MO-miRNA 21 hybridization. Left column: hybridization without ICP and right column: hybridization with ICP. (b) Bar graph quantifying fluorescence intensity with and without ICP. After concentrating the target miRNA 21 on MO spots for 30 min, we could achieve a comparable fluorescence intensity to that realized without ICP after ∼21 h. (c) Fluorescence micrographs for MO-miRNA 155 hybridization under standard incubation and ICP-enhanced hybridization. (d) Quantification of fluorescence signal intensity between standard and ICP hybridization.

