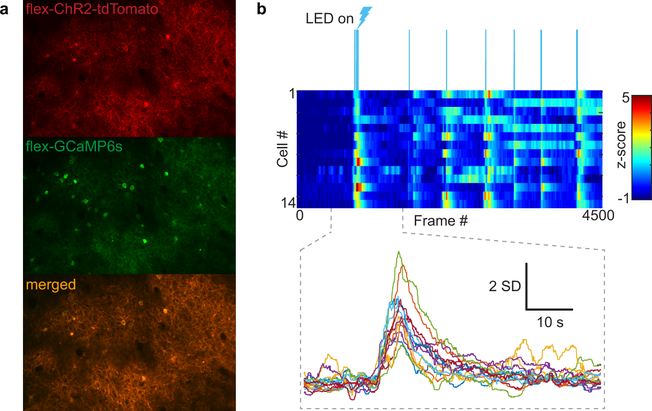
Extended Data Fig. 8 |. Verification of ChR2-driven SST activity in vivo.
a, SST cells expressing both ChR2-Tdtomato and GCaMP6s. b, Representative time series heat map of SST cell GCaMP6s responses to optogenetic stimulation. Z-scores from individual cells plotted per frame (15.5 fps); color scale is −1 to 5 z-scores. (Top) Blue bars denote LED light pulses. (Bottom) Inset showing z-scored traces and significant increase in GCaMP6 signal for 14 cells.

