

Abstract
Background
Cardiac hypertrophy is an adaptive remodeling event that may improve or diminish contractile performance of the heart. Physiologic and pathologic hypertrophy yield distinct outcomes, yet both are dependent on caspase‐directed proteolysis. This suggests that each form of myocardial growth may derive from a specific caspase cleavage event(s). We examined whether caspase 3 cleavage of the actin capping/severing protein gelsolin is essential for the development of pathologic hypertrophy.
Methods and Results
Caspase targeting of gelsolin was established through protein analysis of hypertrophic cardiomyocytes and mass spectrometry mapping of cleavage sites. Pathologic agonists induced late‐stage caspase‐mediated cleavage of gelsolin. The requirement of caspase‐mediated gelsolin cleavage for hypertrophy induction was evaluated in primary cardiomyocytes by cell size analysis, monitoring of prohypertrophy markers, and measurement of hypertrophy‐related transcription activity. The in vivo impact of caspase‐mediated cleavage was investigated by echo‐guided intramyocardial injection of adenoviral‐expressed gelsolin. Expression of the N‐terminal gelsolin caspase cleavage fragment was necessary and sufficient to cause pathologic remodeling in isolated cardiomyocytes and the intact heart, whereas expression of a noncleavable form prevents cardiac remodeling. Alterations in myocardium structure and function were determined by echocardiography and end‐stage cardiomyocyte cell size analysis. Gelsolin secretion was also monitored for its impact on naïve cells using competitive antibody trapping, demonstrating that hypertrophic agonist stimulation of cardiomyocytes leads to gelsolin secretion, which induces hypertrophy in naïve cells.
Conclusions
These results suggest that cell autonomous caspase cleavage of gelsolin is essential for pathologic hypertrophy and that cardiomyocyte secretion of gelsolin may accelerate this negative remodeling response.
Keywords: cardiac hypertrophy, cardiomyocyte hypertrophy, caspase‐3, cell signaling, cytoskeletal dynamics , gelsolin
Subject Categories: Myocardial Biology, Pathophysiology, Heart Failure, Hypertrophy
Clinical Perspective
What Is New?
This study demonstrates that the transition to pathologic hypertrophy requires caspase 3 targeting of the actin severing protein gelsolin.
The N‐terminal caspase cleavage fragment of gelsolin is both sufficient and necessary for negative hypertrophy remodeling of cardiomyocytes (and the myocardium).
Caspase targeting of gelsolin and the consequent actin polymerization are sufficient to induce the pathologic hypertrophy program, which includes the characteristic morphologic and transcription alterations.
What Are the Clinical Implications?
The observations from this study have implications for understanding the genesis of pathologic cardiac hypertrophy and how the heart rapidly transitions to failure.
Our work suggests that nonapoptotic targeting of a single caspase substrate is essential to the manifestation of the disease process in pathologic hypertrophy.
Muting or suppressing caspase activity and/or activity of its cognate substrate, gelsolin, may offer a novel therapeutic target to limit the development of pathologic hypertrophy and the transition to heart failure.
Cardiac hypertrophy can occur in response to biomechanical and neurohormonal stimuli, which promote growth of the intact heart.1, 2 Hypertrophy can be physiologic, such as the cardiac enlargement experienced during pregnancy or exercise.3, 4, 5 Physiologic hypertrophy matches myocardial growth to increased vascularity and normalizes increased tension and pressure in the cardiac chambers to minimize stress and meet systemic demands of the body. Pathologic cardiac hypertrophy is a consequence of disease‐inducing stimuli, such as hypertension; although initially adaptive, continued ventricular growth will lead to a decline in function, resulting in heart failure.2, 6 The transition from adaptive to maladaptive hypertrophy is accompanied by several distinct changes, including increased fibrosis, gross enlargement of cardiomyocytes, and prominent alterations in cytoskeletal/sarcomere assembly.7, 8
Despite the overt difference in physiologic and pathologic cardiac hypertrophy, the cardiomyocyte growth for each condition requires activation of the same signaling cascade. Specifically, both forms of hypertrophy depend on stimulation of the intrinsic‐mediated cell death pathway, culminating in activation of caspase 3.9, 10 Both physiologic and pathologic hypertrophy agonists, such as cardiotrophin 1 and phenylephrine, respectively, rapidly engage caspase 3. Once active, caspase 3 targets and cleaves Histone Deacetylase 3 (HDAC3) to relieve repression on myocyte enhancer factor 2 (MEF2), a key factor that controls hypertrophy‐dependent transcription events in cardiomyocytes.10 During physiologic hypertrophy, this pathway is rapidly curtailed through concurrent stimulation of casein kinase 2.9 Casein kinase 2 phosphorylates the cleavage site on caspase 3 and its substrates to render the pathway ineffective.
These observations suggest the critical step in transition to pathologic hypertrophy and heart failure is sustained caspase 3 activity. Herein, we sought to define the mechanism by which caspase 3 promotes adverse cardiomyocyte/cardiac hypertrophy and whether this is dependent on a unique enzyme substrate cleavage event. Caspase‐sensitive transcriptional responses are similar in physiologic and pathologic hypertrophy9; therefore, we focused our investigation on potential caspase substrates that may modify cytoskeletal/sarcomeric components. Inspection of literature and substrate databases suggested that the actin binding/severing protein gelsolin may be a pathologic conveyer of caspase 3 activity during late stages of hypertrophy. In apoptotic cells, the N‐terminal fragment of caspase‐cleaved gelsolin can dramatically alter actin structure.11, 12 In addition, gelsolin null mice have a blunted remodeling response in the post‐infarct heart, although this was attributed to a loss in the full‐length protein.13
Methods
The data, analytic methods, and study materials that support the findings of this study are available from the corresponding author on reasonable request.
All animal studies, including primary cardiomyocyte retrieval and in vivo analysis, were approved by the University of Ottawa Heart Institute and the University of Ottawa Animal Care Committee.
Cell Culture
Primary neonatal rat cardiomyocytes were isolated from hearts of 2‐day‐old Sprague‐Dawley rats (Charles River Canada). Hearts were placed in Joklik modified Eagle medium after excision, and ventricles were separated from the atria. Ventricles were minced and digested with 0.1% collagenase II (Worthington) in Joklik modified Eagle medium for 5 rounds of digestions (15 minutes each) at 37°C with agitation. Supernatants from collected cellular fractions were incubated with 10% (vol/vol) fetal bovine serum (Gibco), cellular fractions were spun at 100g for 5 minutes, and the resulting cell pellets were resuspended in DMEM/10% (vol/vol) fetal bovine serum/1% (vol/vol) penicillin‐streptomycin (Gibco). Noncardiomyocyte cells were removed via preplating incubations, and all nonadherent cells were seeded on adherent culture dishes or collagen‐coated 25‐mm glass coverslips for immunocytochemistry. Cells were allowed to recover for 24 hours in DMEM culture media at 37°C with 5% CO2. Medium was changed to serum‐free medium for 24 hours at 37°C with 5% CO2.
Immunoblotting
Cell lysates were obtained after green fluorescent protein (GFP)–adenovirus or p35‐adenovirus infection, followed by 0 to 24 hours of hypertrophy induced by treatment with hypertrophic agonist phenylephrine (100 μmol/L; Sigma). Staurosporine (2 μmol/L; 24 hours; dissolved in dimethyl sulfoxide; BioVision) and serum‐free treatments (phenylephrine, 0 hour) served as positive and negative controls for caspase activation, respectively. Briefly, cells were washed in PBS solution and harvested by centrifugation at 1500g for 7 minutes. Cells were lysed in lysis buffer supplemented with protease inhibitors (0.5 mol/L HEPES‐NaOH, pH 7.5; 5.0 mol/L NaCl; 80% [vol/vol] glycerol; 1% [vol/vol] Triton X‐100 (Tx‐100); 0.2 mol/L EGTA; 1 mol/L MgCl2; 20 mmol/L NaF; 10 mmol/L sodium pyrophosphate; 2.0 mmol/L sodium orthovanadate; and 200 μmol/L phenylmethylsulfonyl fluoride) and incubated at 4°C for 1 hour, followed by centrifugation at 20 800g for 10 minutes. Protein was separated by SDS/PAGE and transferred to polyvinylidene difluoride membranes. Membranes were blocked with 10 mmol/L Tris, pH 7.4, 150 mmol/L NaCl, 0.05% Tween‐20, and 5% (wt/vol) nonfat powdered milk; they were incubated with mouse anti‐gelsolin (No. ab55070; Abcam) overnight at 4°C, followed by incubation with horseradish peroxidase–conjugated goat anti‐mouse (No. 1706516; BioRad). The electrochemiluminescence detection kit (GE Healthcare) was used to detect protein expression. Primary cardiomyocytes were also treated with human cardiotrophin 1 (0.5 nmol/L), as previously described by Abdul‐Ghani et al,9 and analyzed by immunoblotting using an anti‐gelsolin antibody, as previously described.
In Vitro Cleavage Assay
Recombinant gelsolin protein (100 ng; Abnova) and recombinant active caspase 3 (3 units; Chemicon) or active caspase 7 (3 units; BioVision) were incubated for 3 hours at 37°C in cleavage assay buffer (50 mmol/L HEPES, pH 7.5; 0.1 mol/L NaCl; 10% [vol/vol] glycerol; 0.1% Chaps (3‐[(3‐cholamidopropyl)dimethylammonio]‐1‐propanesulfonate); and 10 mmol/L dithiothreitol) containing either dimethyl sulfoxide or the effector caspase peptide inhibitor N‐benzyloxycarbonyl‐Asp‐Glu‐Val‐Asp fluoromethyl ketone (BioVision; 20 μmol/L). Reactions were stopped by addition of Laemmli sample buffer and subjected to SDS/PAGE. Western blot analysis was performed using a gelsolin (Abcam) antibody.
Mass Spectrometry
To confirm caspase 3 and/or caspase 7 cleavage of gelsolin protein (2 μg), an in vitro cleavage reaction, performed as previously described, was subjected to SDS/PAGE, followed by silver stain using silver nitrate. The protein bands corresponding to the cleavage fragments were excised and processed for liquid chromatography–tandem mass spectrometry via trypsin digest. The results were analyzed by MASCOT 2.4 software (Matrix Science), and the identified peptides were mapped to either the N‐terminus or the C‐terminus of the gelsolin protein sequence (Figure 1D).
Figure 1.
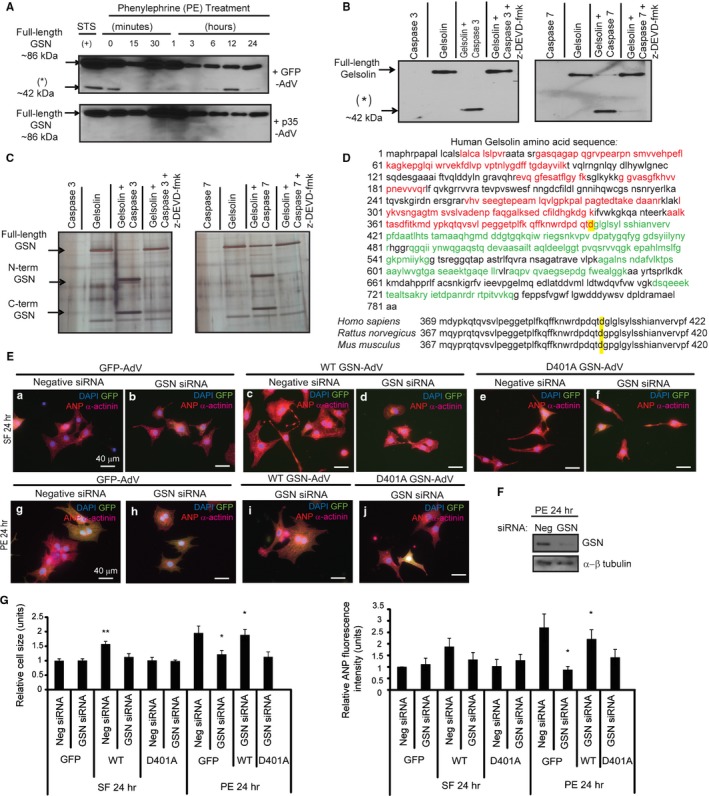
Gelsolin is an essential caspase cleavage substrate during cardiomyocyte hypertrophy. A, Cardiomyocytes infected with p35‐adenovirus or green fluorescent protein (GFP)–adenovirus were treated with phenylephrine and subjected to immunoblot using a C‐terminal gelsolin antibody. Gelsolin cleavage was observed with GFP‐adenovirus, whereas these fragments were not present with p35‐adenovirus. Treatment with 2 μmol/L staurosporine served as a positive (+) control. B, Gelsolin in vitro cleavage assays for caspase alone, gelsolin alone, gelsolin with caspase 3 or 7, or gelsolin with caspase and caspase inhibitor N‐benzyloxycarbonyl‐Asp‐Glu‐Val‐Asp fluoromethyl ketone (z‐DEVD‐fmk) were probed with a C‐terminal gelsolin antibody. A smaller molecular weight gelsolin fragment (asterisk) is observed when gelsolin is incubated with caspase 3/7 and is reduced with z‐DEVD‐fmk. C, Recombinant gelsolin was subjected to an in vitro cleavage reaction, followed by SDS/PAGE and silver staining. Protein fragments were isolated and processed by liquid chromatography–tandem mass spectrometry. D, Red peptides represent those from the N‐terminal fragment (44 kDa plus 26‐kDa N‐terminal gelsolin Glutathione S‐transferase (GST) tag). Green peptides represent those from the C‐terminal fragment (≈42 kDa). The aspartic acid targeted by caspase 3/7 is highlighted in yellow. Consensus of the targeted aspartic acid residues (highlighted in yellow) in Homo sapiens (D403; NP_000168.1), Rattus norvegicus (D401; NP_001004080.1), and Mus musculus (D401; NP_666232.2). Amino acid sequences were obtained from the National Center for Biotechnology Information. E, Cardiomyocytes transfected with scrambled negative control small interfering RNA (siRNA) or gelsolin siRNA, followed by infection with GFP‐adenovirus, wild‐type gelsolin‐adenovirus, or D401A gelsolin‐adenovirus (multiplicity of infection=1) during serum‐free or phenylephrine treatment. F, Gelsolin knockdown confirmed by Western blotting, where gelsolin siRNA led to reduced gelsolin levels compared with the negative scrambled siRNA. α‐ß Tubulin was the loading control. G, During serum‐free treatment, wild‐type gelsolin‐adenovirus infection after negative siRNA transfection led to increased cell size (n=4, **P<0.01), whereas mutant D401A gelsolin‐adenovirus infection did not. During phenylephrine treatment, gelsolin siRNA‐mediated knockdown led to a significant reduction in hypertrophy (n=4, *P<0.05). Wild‐type gelsolin‐adenovirus infection after gelsolin siRNA treatment rescued the hypertrophy response (n=4, *P<0.05). This hypertrophy rescue did not occur with the noncleavable D401A gelsolin‐adenovirus. Bar=40 μm. Error bars represent SEM. ANP indicates atrial natriuretic peptide; DAPI, 4’,6‐diamidino‐2‐phenylindole.
Immunofluorescence
Primary cardiomyocytes were seeded for fluorescent staining at a density of 2.7×10⁵ cells per collagen‐coated 25‐mm glass coverslip. Briefly, cells were washed in PBS solution and fixed with 4% (wt/vol) paraformaldehyde for 30 minutes after the indicated treatment. Cell permeabilization was completed by incubating in blocking buffer (1% BSA, 2% [wt/vol] normal goat serum, and 0.4% Tx‐100 in PBS solution) for 30 minutes. Cardiomyocytes were stained mouse anti–α‐actinin (No. A7811; Sigma) overnight at 4°C and then with goat anti‐mouse IgG Cy3 conjugate (No. AP124C; Millipore) for 1.5 hours. To detect hypertrophy induction, cardiomyocytes were stained with known hypertrophic marker atrial natriuretic peptide (ANP) using rabbit anti‐ANP (No. ab14348; Abcam), followed by detection by the Cy3 or Alexa 488 secondary antibody (No. A‐11008; Invitrogen). Nuclei were counterstained with 4’,6‐diamidino‐2‐phenylindole (No. D8417; Sigma), and cells were mounted onto microscope slides with DakoCytomation fluorescent mounting media (DakoCytomation). Fluorescent images were obtained using the Zeiss LSM510 (Carl Zeiss MicroImaging). Actin was visualized by Alexa Flour 555 phalloidin staining (No. 8953; Cell Signaling), and cardiomyocytes with visible striations and organized/parallel lines of sarcomeres were quantified to determine the percentage of cells with bundled actin. Hypertrophy was assessed by cardiomyocyte cell size analysis of α‐actinin–positive cells using ImageJ software. ANP fluorescence intensity was determined by integrated density quantification, also by using ImageJ software. Putinski et al10 and Abdul‐Ghani et al9 describe use of the previously noted antibodies, which are routinely used in our laboratory.
Construction of Gelsolin Adenoviruses
Recombinant gelsolin adenoviruses for gene delivery of wild‐type, N‐terminal gelsolin caspase cleavage fragment and C‐terminal gelsolin caspase cleavage fragment were constructed by use of the AdEasy XL Adenoviral Vector System (Agilent Technologies), according to the manufacturer's instructions. Primers were constructed on the basis of the full‐length gelsolin rat sequence and are detailed in the Table. All gelsolin adenoviruses are encoding cytoplasmic gelsolin, which starts at amino acid 50 within the Rattus norvegicus precursor gelsolin sequence (Figure S1; NP_001004080.1). Polymerase chain reactions were completed using full‐length gelsolin as a template (GE Healthcare). Correct insert ligation into the pShuttle‐IRES‐hrGFP‐2 vector (Agilent Technologies) was confirmed by sequencing (Applied Biosystems 3730 DNA Analyzer; StemCore Laboratories, Ottawa, ON, Canada), followed by analysis of sequencing data using Chromas software. Forward and reverse pShuttle‐IRES‐hrGFP‐2 primers, detailed in the Table, were used for sequencing, and additional internal primers were used to facilitate full sequencing coverage. Linearized plasmid DNA was transformed into BJ5183‐AD‐1 cells, which are pretransformed with pAdEasy‐1 plasmid (Agilent Technologies), followed by selection for kanamycin resistance. Positive recombinant adenovirus plasmids were transformed into XL10‐Gold ultracompetent cells (Agilent Technologies) and then transfected into AD‐293 cells, allowing for recombinant adenovirus plasmid DNA amplification. Once amplified, adenoviruses were purified by cesium chloride gradients using ultracentrifugation and quantified by spectrophotometry.
Table 1.
Primers Used for Gelsolin Adenovirus Construction and Sequencing
| Variable | Gelsolin Primer |
|---|---|
| Wild‐type |
Forward: 5′‐TTTGTCGACATGGTGGTGGAGCACCCCGAAGGG‐3′ Reverse: 5′‐TTCTCGAGGGCAGCCAGCTCAGCCAACC‐3′ |
| N‐terminal fragment |
Forward: 5′‐TTTGTCGACATGGTGGTGGAGCACCCCGAAGGG‐3′ Reverse: 5′‐TTCTCGAGGTCTGTCTGGTCTGGGTCCC‐3′ |
| C‐terminal fragment |
Forward: 5′‐TTTGTCGACATGGGCCCTGGCCTGAGCTACGGG‐3′ Reverse: 5′‐TTCTCGAGGGCAGCCAGCTCAGCCAACC‐3′ |
| D401A caspase cleavage mutant |
Forward: 5′‐CCAGACCAGACAGCCGGCCCTGGCCTG ‐3′ Reverse: 5′‐CAGGCCAGGGCCGGCTGTCTGGTCTGG‐3′ |
| pShuttle‐IRES‐hrGFP‐2 |
Forward: 5′‐CTCACGGGGATTTCCAAGTC 3′ Reverse: 5′‐ATGCAGTCGTCGAGGAATTG 3′ |
| Internal sequencing primers |
Wild‐type and N‐terminal fragment Forward: 5′‐GGACGCCGTGTAGTCCGTGCC‐3′ Wild‐type and C‐terminal fragment Reverse: 5′‐GGCGGCGGAGGGGGTTTTCAG‐3′ N‐terminal fragment Reverse: 5′‐GGTGCCCTGAGGCAGATCCGG‐3′ C‐terminal fragment Forward: 5′‐GTCGCTGCTTCAGCCATCCTG‐3′ |
Forward and reverse wild‐type, N‐terminal, and C‐terminal gelsolin adenovirus primers include Sal1 and Xhol restriction sites, respectively. Mutated site identified in bold italics.
Wild‐type gelsolin previously cloned, as previously detailed, into the pShuttle‐IRES‐hrGFP‐2 vector was used as a template to produce a single point mutation within the gelsolin caspase cleavage site using site‐directed mutagenesis. The polymerase chain reaction was performed using primers (Table) containing the mutated nucleotide sequence corresponding to a single amino acid change (D401A). The resulting mutated polymerase chain reaction products were then processed, as previously described, producing caspase cleavage site mutated gelsolin adenoviruses.
Correct gelsolin expression was further verified by Western blotting of lysates collected from adenovirus‐infected primary cardiomyocytes. Briefly, cells were washed in PBS solution and harvested by centrifugation at 1500g for 7 minutes. Whole cell lysates were obtained by cell lysis with lysis buffer supplemented with protease inhibitors (50 mmol/L Tris‐HCl, 150 mmol/L NaCl, 1 mmol/L EDTA, 1% [vol/vol] NP‐40, 1% [vol/vol] glycerol, 20 mmol/L NaF, 10 mmol/L sodium pyrophosphate, 2.0 mmol/L sodium orthovanadate, and 200 μmol/L phenylmethylsulfonyl fluoride) and incubated at 4°C for 1 hour, followed by centrifugation at 12 000g for 2 minutes. Protein was separated by SDS/PAGE and transferred to polyvinylidene difluoride membranes. Membranes were incubated with C‐terminal mouse anti‐gelsolin (No. ab55070; Abcam) or N‐terminal goat anti‐gelsolin (No. sc‐6406; Santa Cruz) overnight at 4°C, followed by incubation with horseradish peroxidase–conjugated goat anti‐mouse (No. 1706516; BioRad) or anti‐goat (No. 1721034; BioRad), respectively. The electrochemiluminescence detection kit (GE Healthcare) was used to detect protein expression (Figure S2).
Gelsolin Adenovirus Infection and Cardiomyocyte Treatments
Primary cardiomyocytes were infected with the control GFP‐adenovirus, wild‐type gelsolin‐adenovirus, N‐terminal gelsolin‐adenovirus, C‐terminal gelsolin‐adenovirus, or the noncaspase cleavable D401A gelsolin‐adenovirus (multiplicity of infection [MOI]=1) either in serum‐free media (24 or 48 hours) or during phenylephrine (100 μmol/L) hypertrophy induction (3 or 24 hours). Cardiomyocytes were paraformaldehyde fixed, and immunofluorescent analysis was completed with mouse anti–α‐actinin and rabbit anti‐ANP, followed by detection by the Cy3 and Alexa 647 secondary antibody (Invitrogen). Nuclei were counterstained with 4’,6‐diamidino‐2‐phenylindole, and cells were mounted onto microscope slides with DakoCytomation fluorescent mounting media. Fluorescent images were obtained using the Zeiss Observer Z1 (Zeiss AxioVision SE64 Imaging software). Hypertrophy was assessed by cardiomyocyte cell size analysis of α‐actinin–positive cells using ImageJ software. ANP fluorescence intensity was determined by integrated density quantification, also by using ImageJ software. All values were normalized to serum‐free plus GFP‐adenovirus infected control treatments.
Gelsolin Small Interfering RNA Knockdown and Gelsolin Reintroduction
Primary cardiomyocytes were transfected by using Lipofectamine 2000 (Invitrogen), serum‐free Opti‐MEM α (Gibco), and gelsolin small interfering RNA (siRNA) or negative control scrambled siRNA (Ambion) for 5 hours at 37°C with 5% CO2. The medium was replaced with serum‐free medium, and cells were incubated overnight at 37°C with 5% CO2. The next day, cardiomyocytes were infected with the control GFP‐adenovirus, wild‐type gelsolin‐adenovirus, or D401A caspase cleavage site mutant gelsolin‐adenovirus (MOI=1). Cardiomyocytes were then incubated in serum‐free (24 hours) or phenylephrine hypertrophy (24 hours) medium, and fresh siRNA was added. Cardiomyocytes were paraformaldehyde fixed, and immunofluorescence analysis and hypertrophy assessment were completed, as previously described. Gelsolin knockdown was confirmed by Western blotting using a gelsolin antibody (Abcam); gelsolin siRNA treatment led to reduced gelsolin levels during phenylephrine 24‐hour treatment compared with the negative scrambled control siRNA (Figure 1F). Equal loading is shown by α‐ß tubulin (Development Studies Hybridoma Bank).
Prohypertrophic Reporter Luciferase Assay
At a density of 0.7×10⁵ cells per well, primary cardiomyocytes were seeded onto 48‐well plates and, the following day, cells were transfected by using Lipofectamine 2000 (Invitrogen), serum‐free Opti‐MEM α (Gibco), 4 ng of internal Renilla luciferase internal control, and 200 ng of Firefly luciferase reporter DNA containing the gene of interest (reporters: ANP, B‐type natriuretic peptide, nuclear factor‐κB, MEF2, and serum response factor) for 5 hours at 37°C with 5% CO2. The medium was replaced with serum‐free medium containing GFP control adenovirus or wild‐type, N‐ or C‐terminal gelsolin‐adenovirus, or the D401A gelsolin‐adenovirus; and cells were incubated overnight at 37°C with 5% CO2. The next day, cardiomyocytes were incubated with serum‐free medium or phenylephrine (24 hours). Luciferase activity (prohypertrophic reporter activation) was measured by using the Dual Luciferase Assay System, per manufacturer's instructions (Promega). Luciferase values were normalized to Renilla luciferase internal control, empty pXP2 vector, and serum‐free medium plus GFP‐adenovirus.
Cardiomyocytes were also infected with adenoviruses and diluted in serum‐free medium, encoding the nuclear factor of activated T‐cells (NFAT)‐luciferase reporter or activated calcineurin (Seven Hills Bioreagents, JMAd‐10 and JMAd‐04) or the gelsolin‐adenoviruses (wild‐type, N‐terminal, C‐terminal, and D401A). GFP‐adenovirus was used as a control. NFAT‐adenovirus and activated calcineurin‐adenovirus were infected at an MOI of 20, and the gelsolin‐adenoviruses or GFP‐adenoviruses were infected at an MOI of 1. Cells were infected for 12 or 24 hours at 37°C, followed by Luciferase assay measurements using the Luciferase Assay System, as per manufacturer's instructions (Promega).
In Vivo Gelsolin Adenovirus Analysis
A total of 36 male Sprague‐Dawley rats (≈250 g at baseline) were allocated into 5 adenovirus groups at random with blinding (GFP, n=7; wild‐type, n=7; N‐terminus, n=7; C‐terminus, n=7; D401A, n=8). The rationale for using male rats was to provide basic in vivo confirmation (or not) of the in vitro observations (ie, future studies will examine whether sex‐based differences exist). Allocation concealment was used (ie, cages were numbered instead of treatment designations). Echocardiography (VisualSonics)–guided intramyocardial injections of GFP‐adenovirus, wild‐type gelsolin‐adenovirus, N‐terminal gelsolin‐adenovirus, C‐terminal gelsolin‐adenovirus, or D401A gelsolin‐adenovirus, diluted in 0.9% saline solution, at 3.75×10⁵ plaque‐forming units/μL, were completed on day 0 by using a staged microinjector under parasternal long‐axis view. Hypertrophy progression was monitored by transthoracic echocardiography at room temperature using echocardiography‐Doppler (Vevo 770 system; VisualSonics) with a probe, RMV707B (15–45 MHz). Measurements were taken on days 0, 14, 21, and 28. Herein, the rats were slightly anesthetized with 0.5% to 1% isoflurane in 100% O2. The 2‐dimensionally guided time motion mode recording of the left ventricle (LV) provided the following measurements: interventricular septal wall thickness in diastole, posterior wall thickness in systole, LV internal diameter during diastole, and LV internal diameter during systole. Percentage of LV fractional shortening was calculated as follows: fractional shortening=(LV internal diameter during diastole−LV internal diameter during systole)/LV internal diameter during diastole, multiplied by 100. Percentage of ejection fraction was calculated on the basis of LV volume during diastole and systole (μL), where ejection fraction=(LV volume during diastole−LV volume during systole)/LV volume during diastole, multiplied by 100. Percentage of cardiac output was calculated on the basis of heart rate measurements multiplied by stroke volume, where stroke volume was calculated by subtracting end‐systolic volume from end‐diastolic volume, multiplied by 100.
At 4 weeks, hearts were arrested in diastole by a tail‐vein injection of 2 mol/L KCl. Hearts were isolated and stored in 4% (wt/vol) paraformaldehyde and dehydrated with 25% (wt/vol) sucrose overnight at 4°C. Embedding and sectioning of hearts were completed by the Department of Pathology and Laboratory Medicine—Histology Core Facility (University of Ottawa, Ottawa, ON, Canada). Tissue sections were washed in PBS solution and fixed in 0.2% glutaraldehyde for 10 minutes at room temperature. Fluorescent staining was completed on the heart tissues in a rehydration chamber by using mouse anti–α‐actinin, goat anti‐mouse IgG Cy3 conjugate, anti‐GFP (Cell Signaling), goat anti‐rabbit Alexa 488, and 4’,6‐diamidino‐2‐phenylindole, as described earlier. Cell size analysis was completed on α‐actinin and GFP‐positive cardiomyocytes using ImageJ software. Negative no adenovirus control heart sections were imaged to demonstrate that green fluorescence levels were above autofluorescence (Figure S3). Additional frozen sections were thawed, then fixed with 1% formalin in PBS for 10 minutes, and then permeabilized with 0.3% Triton/PBS (10 minutes), followed by blocking with 5% fetal bovine serum/PBS (60 minutes). The slides were then incubated overnight at 4°C with ANP antibody (1:1000; Abcam) in 1% fetal bovine serum/PBS. Primary antibody detection was visualized following the protocol for SignalStain Boost Detection Reagent (Cell Signaling). Images of stained sections were collected using a Zeiss light microscope with a standard color camera.
Heart sections were also stained with Masson's trichrome to assess collagen/fibrotic deposition (blue staining). This immunohistologic analysis was completed by the Histology Core Facility (University of Ottawa). Quantifications were completed using ImageJ software.
Caspase Inhibition and Gelsolin Adenovirus Infection
Primary cardiomyocytes were infected with the control GFP‐adenovirus, wild‐type gelsolin‐adenovirus, N‐terminal gelsolin‐adenovirus, C‐terminal gelsolin‐adenovirus, or the noncaspase cleavable D401A gelsolin‐adenovirus (MOI=1) in serum‐free medium (24 hours). The following day, primary cardiomyocytes were pretreated with N‐benzyloxycarbonyl‐Asp‐Glu‐Val‐Asp fluoromethyl ketone for 2 hours before induction of hypertrophy by phenylephrine (100 μmol/L; 24 hours) when additional fresh caspase 3 inhibitor was added. Cardiomyocytes were paraformaldehyde fixed, and immunofluorescence analysis and hypertrophy assessment were completed, as previously described.
Conditioned Hypertrophy Medium Analysis
Primary cardiomyocytes were treated with serum‐free medium, phenylephrine (100 μmol/L), or the procaspase activating compound (25 μmol/L; BioVision) for 24 hours. Hypertrophy medium was aspirated, and fresh serum‐free medium was added. The conditioned medium was collected after 24 hours. This conditioned medium, in the presence or absence of a gelsolin antibody (2 μg/mL; No. ab74420; Abcam), preincubated (1 hour at room temperature) gelsolin antibody, and gelsolin blocking peptide (6 μg/mL; No. ab74419; Abcam), or a control noncardiac antibody (MyoD; No. 13812; Cell Signaling) was used to treat additional dishes of primary cardiomyocytes. Twenty‐four hours later, cardiomyocytes were fixed, and cell size and ANP levels were analyzed by immunofluorescence microscopy, as previously described.
Statistical Analysis
All data are expressed as mean±SEM. Significance of multiple‐group comparisons was completed by 1‐way ANOVA, followed by post hoc statistical analysis (GraphPad Prism 7). Tukey's test was used for pairwise comparisons between treatment groups, where P<0.05 was considered significant. Bonferroni‐Holm correction was conducted in cases in which there was unequal variance between groups. For the in vivo study, formal sample size and power calculations were not conducted because existing precedent in our laboratory (and others in the field) was followed.
Results
Gelsolin Is Cleaved by Effector Caspases During Pathologic Cardiac Hypertrophy
First, we examined gelsolin integrity in primary cardiomyocytes treated with the hypertrophy agonist phenylephrine. Gelsolin cleavage was observed at later stages (6–24 hours) and was coincident with hypertrophy‐related cytoskeletal alterations that occur during this process (Figure 1A). Gelsolin cleavage was blocked by caspase inhibition via infection of cardiomyocytes with the p35‐adenovirus caspase inhibitor, demonstrating caspase dependence for this cleavage event. More important, the gelsolin cleavage fragments matched the size of caspase‐produced gelsolin fragments reported by previous groups.11, 12, 14 Baseline (phenylephrine, 0 minutes) caspase activity is observed (Figure 1A) and has also previously been shown.10 To confirm the enzyme substrate relationship, we conducted in vitro cleavage assays using recombinant active caspase 3 and caspase 7 and recombinant gelsolin in the presence or absence of the peptide caspase inhibitor N‐benzyloxycarbonyl‐Asp‐Glu‐Val‐Asp fluoromethyl ketone. Both effector caspases cleaved gelsolin, whereas caspase inhibition blocked the production of the gelsolin cleavage product (Figure 1B). Blots were probed with an antibody corresponding to the C‐terminal portion of gelsolin and, thus, a single band was observed (≈42‐kDa C‐terminal fragment), which also corresponded with the gelsolin fragments observed in hypertrophic cells. Next, we mapped the caspase cleavage site within gelsolin, by extracting N‐ and C‐terminal gelsolin cleavage products from silver‐stained gels, followed by liquid chromatography–tandem mass spectrometry (Figure 1C). A nontryptic cleavage event was observed at aspartic acid residue 401 (D401) within the rat gelsolin amino acid sequence (Figure 1D). This cleavage event is reflective of what has been observed in other studies.11, 12, 14 These studies based their numbering on the cytoplasmic gelsolin sequence, which lacks 49 N‐terminal amino acids compared with the full gelsolin precursor or plasma gelsolin sequence (Figure S1).15, 16
Gelsolin Is Essential for Cardiomyocyte Hypertrophy
We next examined whether gelsolin itself and gelsolin caspase‐mediated cleavage was essential for cardiomyocyte hypertrophy. To test this supposition, we used gelsolin siRNA to knock down gelsolin expression in primary cardiomyocytes during serum‐free or phenylephrine treatment, followed by reintroduction of the caspase‐cleavable wild‐type gelsolin or the noncleavable D401A gelsolin‐adenovirus (Figure 1E and 1F). As previously shown,17 we also observed that gelsolin siRNA knockdown during phenylephrine treatment leads to reduced hypertrophy. Cell size and hypertrophy marker ANP levels were also reduced by gelsolin knockdown, indicating a role for gelsolin protein in hypertrophy induction (Figure 1E and 1G). Cardiomyocytes transfected with gelsolin siRNA and infected with the wild‐type gelsolin‐adenovirus, during phenylephrine treatment, were enlarged compared with those infected with the control GFP‐adenovirus, demonstrating that the reintroduction of a caspase‐cleavable gelsolin can rescue hypertrophy. Alternatively, gelsolin siRNA‐mediated knockdown, followed by infection with the caspase cleavage site mutated gelsolin‐adenovirus, did not lead to a significant increase in cell size or ANP levels, suggesting that caspase cleavage of gelsolin may be a critical step in the development of the hypertrophy phenotype (Figure 1E and 1G).
Full‐Length or Caspase‐Cleaved N‐Terminal Gelsolin Induces Cardiomyocyte Hypertrophy
To investigate the biological role of caspase‐mediated gelsolin cleavage in pathologic cardiac hypertrophy, we compared a panel of gelsolin‐adenovirus constructs, which included the wild‐type and D401A (as previously noted) along with N‐ and C‐terminal caspase‐cleavage fragments. When comparing these adenovirus constructs, significant changes in cell size (serum‐free medium, 24 hours; serum‐free medium, 48 hours; phenylephrine, 3 hours) and ANP levels (serum‐free medium, 48 hours) were observed. Each gelsolin adenovirus was further compared with the control GFP‐adenovirus and, interestingly, cardiomyocytes infected with the wild‐type or N‐terminal gelsolin‐adenovirus in serum‐free conditions were significantly enlarged compared with those infected with the GFP‐adenovirus at 24 and 48 hours (Figure 2A and 2B). These same gelsolin adenoviruses also elicited an increased expression of ANP. Limited phenylephrine treatment (3 hours) further enhanced the hypertrophy response. Conversely, cardiomyocytes infected with the C‐terminal gelsolin fragment or D401A gelsolin‐adenovirus did not display any increase in size or ANP expression at any of the time points tested. We measured whether these same gelsolin constructs affected transcriptional activity of known hypertrophy responsive genes. Herein, primary cardiomyocytes were transfected with reporter plasmids for ANP, B‐type natriuretic peptide, MEF2, nuclear factor‐κB, or serum response factor (with a Renilla luciferase internal control) and monitored for the response to gelsolin expression during serum‐free treatment. With each prohypertrophy marker, significant changes were observed among the adenovirus groups (Figure 2C). When compared with the control GFP‐adenovirus, only wild‐type and N‐terminal gelsolin‐adenovirus infection resulted in a significant increase in reporter activity during serum‐free treatment, which were comparable to those observed during phenylephrine stimulation (Figure 2C). Because gelsolin is a potent actin‐remodeling agent, we also measured the capacity of the various gelsolin‐adenovirus constructs to modify cytoskeletal/sarcomeric structure. We noted that both wild‐type and N‐terminal gelsolin‐adenovirus infected cardiomyocytes displayed a significant increase in bundled actin structures compared with all other adenovirus‐infected cells, a structural reorganization that was similar to that induced by the hypertrophy agonist phenylephrine (Figure 2D). Finally, we tested the ability of the various gelsolin‐adenovirus constructs to remodel cardiomyocytes in the absence of caspase signaling. We noted that both the wild‐type and N‐terminal gelsolin‐adenoviruses could induce hypertrophy when cardiomyocytes were exposed to the effector peptide caspase inhibitor N‐benzyloxycarbonyl‐Asp‐Glu‐Val‐Asp fluoromethyl ketone (Figure 3), although the caspase‐cleaved N‐terminal gelsolin provided a more significant rescue. This suggests both caspase‐dependent and caspase‐independent gelsolin functions.
Figure 2.
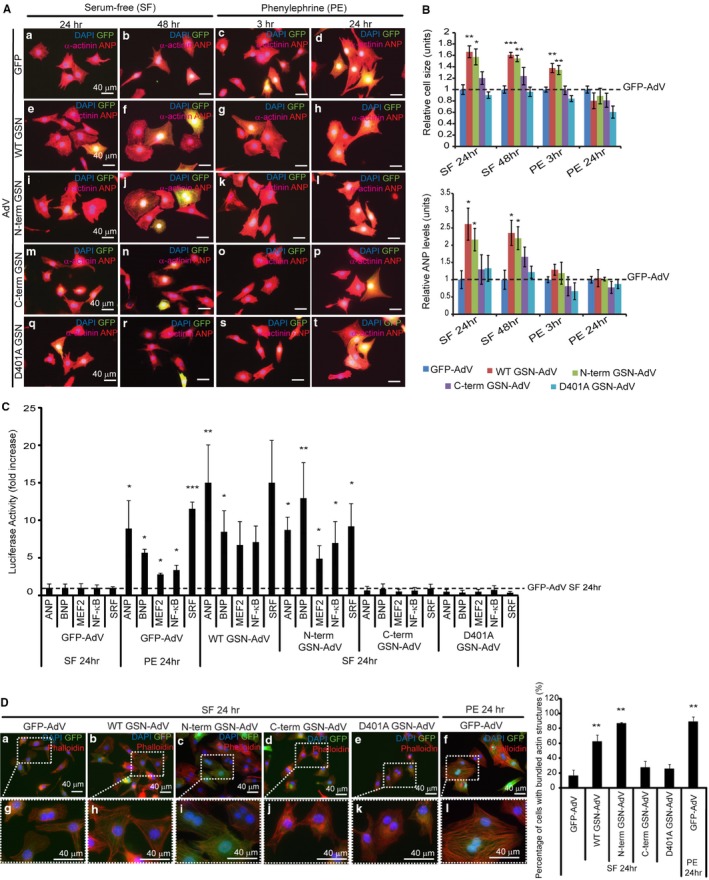
Expression of wild‐type or N‐terminal gelsolin can induce hypertrophy in primary cardiomyocytes. Primary cardiomyocytes were infected with green fluorescent protein (GFP) control adenovirus, wild‐type gelsolin‐adenovirus, N‐terminal gelsolin‐adenovirus, C‐terminal gelsolin‐adenovirus, or D401A gelsolin‐adenovirus (multiplicity of infection [MOI]=1) during serum‐free or phenylephrine treatment (bar=40 μm). Immunofluorescence analysis was completed (A), and cell size and atrial natriuretic peptide (ANP) levels were evaluated (B). All values were normalized to the GFP‐adenovirus–infected cardiomyocytes within each treatment. A significant increase in cell size was observed after wild‐type (n=3, **P<0.01) or N‐terminal gelsolin infection (n=3, *P<0.05) during 24 hours of serum‐free treatment, whereas the C‐terminal gelsolin or D401A gelsolin‐adenovirus did not significantly affect cell size. Similar results were observed after serum‐free treatment over 48 hours (wild‐type, n=3, ***P<0.001; N‐terminus, n=3, **P<0.01) and phenylephrine treatment over 3 hours (wild‐type, n=3, **P<0.01; N‐terminus, n=3, **P<0.01). ANP levels were also significantly increased after wild‐type and N‐terminal gelsolin‐adenovirus infection after 24 and 48 hours of serum‐free treatment (n=3, *P<0.05). C, Cardiomyocytes were transfected with luciferase reporter plasmids for prohypertrophic markers (ANP, B‐type natriuretic peptide [BNP], myocyte enhancer factor 2 [MEF2], nuclear factor [NF]‐κB, and serum response factor [SRF]). Reporter activity was measured after cardiomyocytes were infected with GFP control adenovirus, wild‐type gelsolin‐adenovirus, N‐terminal gelsolin‐adenovirus, C‐terminal gelsolin‐adenovirus, or D401A gelsolin‐adenovirus (MOI=1) during serum‐free or phenylephrine treatment. Wild‐type (ANP, n=3, **P<0.01; BNP, n=3, *P<0.05) and N‐terminal (ANP, n=3, *P<0.05; BNP, n=3, **P<0.01; MEF2, n=3, *P<0.05; NF‐κB, n=3, *P<0.05; SRF, n=3, *P<0.05) gelsolin‐adenovirus infection, during serum‐free treatment, led to a significant increase in hypertrophy reporter activation compared with the GFP‐adenovirus control, similar to what is observed during phenylephrine‐induced hypertrophy (phenylephrine, 24 hours). D, Actin remodeling was evaluated in cardiomyocytes infected with gelsolin‐adenovirus constructs during serum‐free treatment by phalloidin staining, followed by determination of the percentage of cells with bundled actin. Magnified views are shown in boxed regions. Significant increases in bundled actin/defined striations were observed in cardiomyocytes treated with N‐terminal gelsolin (n=3, **P<0.01) and wild‐type gelsolin‐adenovirus (n=3, **P<0.01). N‐terminal gelsolin treatment led to a similar increase in actin remodeling to that observed during phenylephrine treatment (n=3, **P<0.01). Bar=40 μm. Error bars represent SEM. DAPI indicates 4’,6‐diamidino‐2‐phenylindole.
Figure 3.
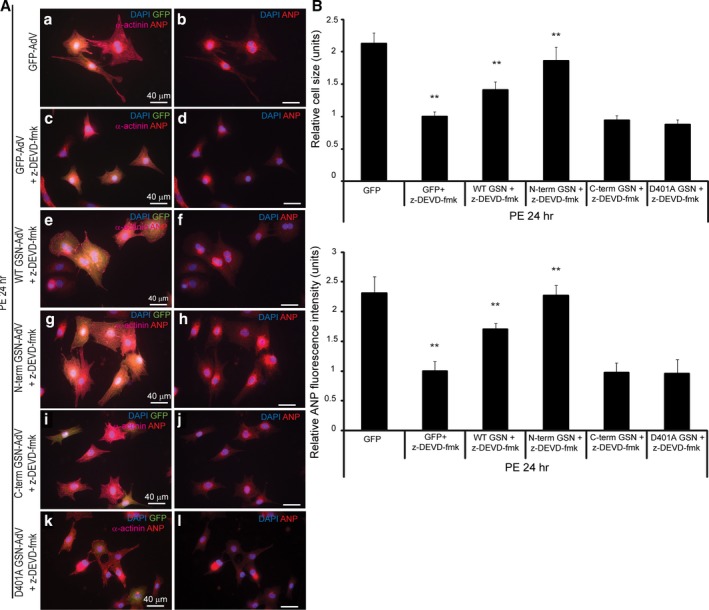
Expression of wild‐type or N‐terminal gelsolin can rescue the hypertrophy response reduced by caspase inhibition. Primary cardiomyocytes were treated with 20 μmol/L of the caspase 3 inhibitor N‐benzyloxycarbonyl‐Asp‐Glu‐Val‐Asp fluoromethyl ketone (z‐DEVD‐fmk); infected with green fluorescent protein (GFP) control adenovirus, wild‐type gelsolin‐adenovirus, N‐terminal gelsolin‐adenovirus, C‐terminal gelsolin‐adenovirus, or D401A gelsolin‐adenovirus (multiplicity of infection=1); and treated with phenylephrine for 24 hours. Immunofluorescence analysis was completed (A), and cell size and atrial natriuretic peptide (ANP) levels were evaluated (B). All values were normalized to the caspase‐inhibited and GFP‐adenovirus–infected cardiomyocytes, which were reduced in size, and ANP levels were compared with those lacking caspase inhibitor treatment (n=3, **P<0.01; and n=3, **P<0.01, respectively). During caspase inhibition, a hypertrophy rescue was observed after wild‐type (n=3, **P<0.01) or N‐terminal gelsolin infection (n=3, **P<0.01) and identified by a significant increase in cell size and ANP levels compared with GFP‐adenovirus–infected cardiomyocytes (wild‐type, n=3, **P<0.01; N‐terminus, n=3, **P<0.01). The C‐terminal gelsolin or D401A gelsolin‐adenovirus infected cardiomyocytes did not significantly rescue cell size or ANP levels. Bar=40 μm. Error bars represent SEM. DAPI indicates 4’,6‐diamidino‐2‐phenylindole.
Full‐Length or Caspase‐Cleaved N‐Terminal Gelsolin Induces Cardiomyocyte Hypertrophy In Vivo
Next, we examined whether gelsolin and its cleavage products altered heart structure in vivo. We performed ultrasound‐guided intramyocardial injections of the same gelsolin‐ adenovirus constructs, as previously described, followed by echocardiography analysis over 28 days (Figure 4A and Figure S4). N‐terminal gelsolin‐adenovirus injections led to significant reductions in LV internal diameter during diastole compared with the GFP‐adenovirus (Figures 3 and 4B) (day 28). Although no significant increase in LV posterior wall thickness was observed (Figure S5A), the interventricular septum thickness was significantly increased during systole (day 21) in rats injected with the N‐terminal gelsolin‐adenovirus compared with the GFP‐adenovirus (Figure 4B). No significant changes in cardiac structure were noted in hearts injected with the C‐terminal gelsolin‐adenovirus or the D401A gelsolin‐adenovirus. Cardiac function was also evaluated, and N‐terminal gelsolin‐adenovirus injected animals displayed elevated ejection fraction (day 21) and cardiac output (day 14) (Figure 4B). Fractional shortening was also measured but did not show any significant changes between adenovirus‐infected animals (Figure S4A). Moreover, long‐term N‐terminal gelsolin expression (ie, at day 28) led to a decline in ejection fraction and cardiac output measurements, with no significant difference compared with GFP‐adenovirus, consistent with a transition to decompensation and failure (Figure 4B). Consistent with the progression of pathologic cardiac hypertrophy, we also observed elevated fibrosis/fibrotic deposition in heart tissues infected with wild‐type and N‐terminal gelsolin‐adenoviruses (Figure S5). Cell structure was also evaluated, and full‐length and N‐terminal gelsolin‐adenovirus infections resulted in increased cardiomyocyte size compared with those infected with the GFP control adenovirus (Figure 4C). Furthermore, enhanced ANP levels were also observed in wild‐type and N‐terminal gelsolin‐adenovirus infected hearts (Figure S6). Conversely, hearts infected with the C‐terminal or caspase cleavage mutant gelsolin adenoviruses did not induce a similar cell hypertrophy response.
Figure 4.
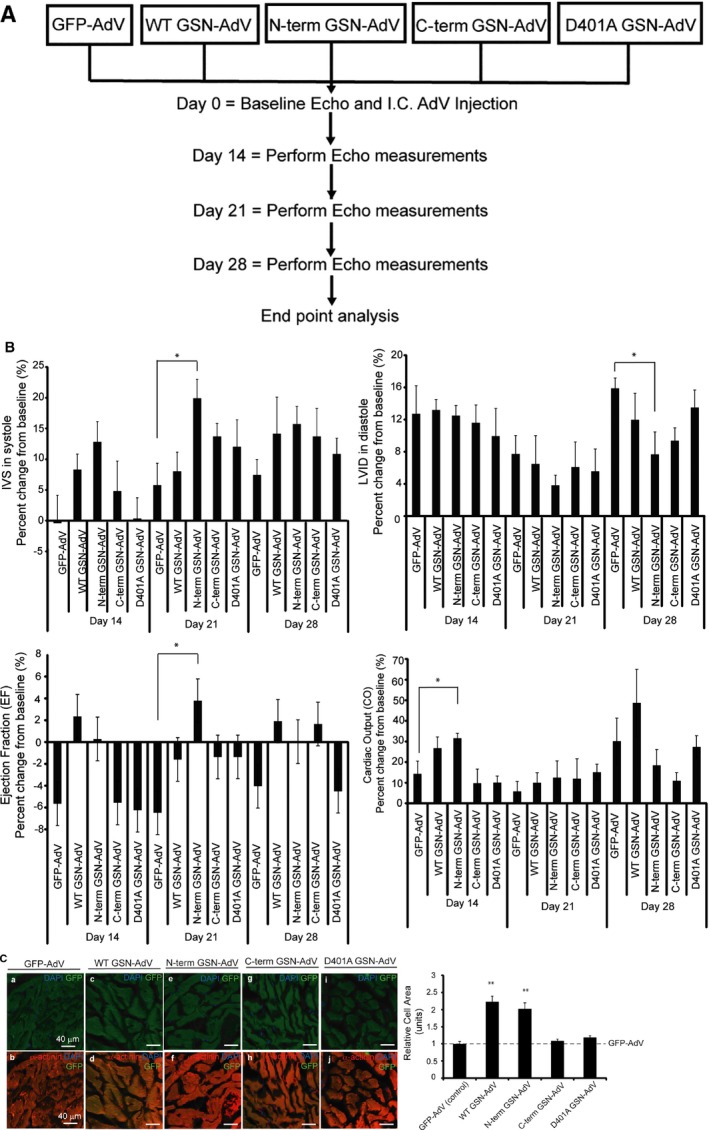
Wild‐type or N‐terminal gelsolin overexpression can induce a hypertrophy response in the intact myocardium. A, Outline of in vivo study. Sprague‐Dawley rats were echo‐guided intramyocardial injected with either the control green fluorescent protein (GFP) adenovirus or one of the gelsolin adenoviruses. Echocardiography was performed at days 0, 14, 21, and 28. Rats were euthanized at day 35, and hearts and tibia were isolated. Three hearts per adenovirus group were optimal cutting temperature (OCT) compound embedded and cryosectioned. B, Echocardiographic data were taken on days 0, 14, 21, and 28 and represent the percentage change from the baseline measurement. Significant differences in these measurements were observed when comparing the gelsolin‐injected rats with those injected with the control GFP‐adenovirus. Significantly reduced left ventricular internal diameter (LVID) was observed in rats injected with N‐terminal gelsolin‐adenovirus compared with the GFP‐adenovirus (day 28) (n=7, *P<0.05). Although no significant increase in left ventricular posterior wall thickness (Figure S4) was observed, interventricular septum (IVS) measurements showed thickening in N‐terminal gelsolin rats compared with GFP during contraction (day 21) (n=7, *P<0.05). Increased ejection fraction (EF) was observed in rats infected with the N‐terminal gelsolin adenovirus at day 21 compared with the GFP‐adenovirus (n=7, *P<0.05). Increased cardiac output (CO) measurements were observed in rats infected with the N‐terminal gelsolin adenovirus at day 14 compared with the GFP‐adenovirus (n=7, *P<0.05). No significant changes were observed when comparing the rats injected with C‐terminal or D401A gelsolin‐adenovirus with those injected with the GFP‐adenovirus. C, Heart sections were stained for α‐actinin (red), GFP (green), and 4’,6‐diamidino‐2‐phenylindole (DAPI; blue). Cell size of GFP‐tagged gelsolin‐adenovirus–infected cardiomyocytes (green) was quantified. Hearts infected with wild‐type or N‐terminal gelsolin‐adenoviruses were significantly enlarged compared with those infected with a GFP control adenovirus (n=3, **P<0.01 and **P<0.01, respectively). Hearts infected with C‐terminal gelsolin or caspase cleavage mutant gelsolin (D401A gelsolin‐adenovirus) did not induce the same hypertrophy response. Bar=40 μm. Error bars represent SEM. Echo indicates echocardiography; I.C., intramyocardial.
Secreted Gelsolin Is a Hypertrophy Inductive Cue
Compensatory hypertrophy can rapidly transition to decompensation/heart failure and may occur in a segmental manner.2 This wave of decompensation is consistent with release of a factor(s) that may alter the structure and function of cardiomyocytes. Interestingly, gelsolin has been demonstrated to exist in multiple pools within other cells, one of which can be released into the extracellular space.18, 19 Herein, we tested whether full‐length and/or caspase‐activated gelsolin is secreted from cardiomyocytes to propagate the hypertrophy response in adjacent naïve cardiomyocytes. Primary cardiomyocytes were treated with serum‐free medium, phenylephrine, or the procaspase‐activating compound for 24 hours to induce hypertrophy (Figure 5A). Medium was then aspirated, cells were washed, and fresh serum‐free medium was added and collected after 24 hours from each condition. Initial analysis showed significant changes in both cell size and ANP levels among the treatment groups (Figure 5B). Cardiomyocytes treated with conditioned phenylephrine or procaspase activating compound medium were enlarged compared with serum‐free treated cardiomyocytes, demonstrating that secreted components within the medium may induce hypertrophy. However, cardiomyocytes treated with conditioned phenylephrine or procaspase activating compound medium in the presence of a gelsolin antibody did not display any increase in cell size or ANP levels compared with hypertrophy‐conditioned medium treatment alone. Treatment with a blocking gelsolin peptide abrogated this gelsolin antibody‐induced hypertrophy inhibition, confirming the specificity of gelsolin's effect in propagating the pathologic hypertrophy response.
Figure 5.
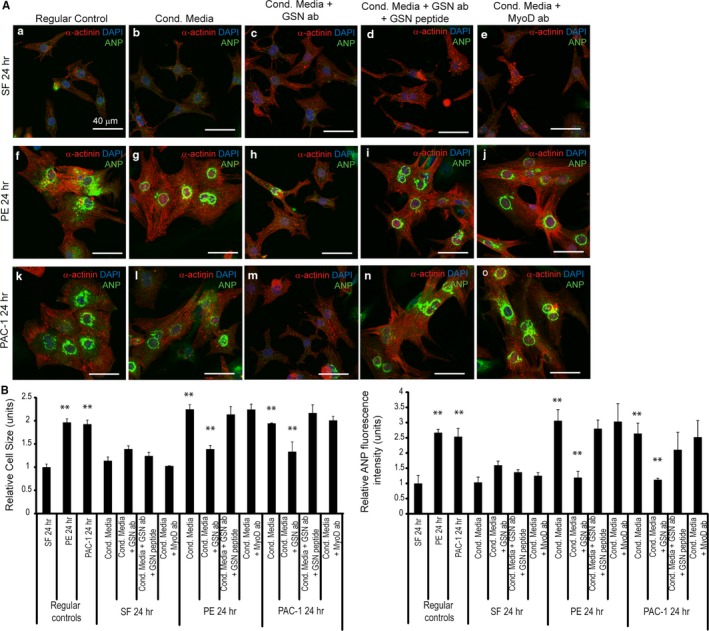
Gelsolin secreted by hypertrophic cardiomyocytes may be involved in the induction of hypertrophy. A, Primary cardiomyocytes were treated with conditioned hypertrophic media (Cond. Media), from phenylephrine‐ or procaspase activating compound (PAC‐1)–treated cardiomyocytes, supplemented with gelsolin antibody to block secreted gelsolin, gelsolin antibody plus gelsolin peptide, or MyoD antibody. Serum‐free medium treatment was used as a control. B, Cell size and atrial natriuretic peptide (ANP) levels were analyzed and are quantified. Phenylephrine (n=3, **P<0.01; ANP, n=3, **P<0.01) and PAC‐1 (n=3, **P<0.01; ANP, n=3, **P<0.01) treatment (regular controls) resulted in hypertrophy induction. Treatment of cardiomyocytes with phenylephrine‐ or PAC‐1–conditioned medium led to enlarged cardiomyocytes (phenylephrine, n=3, **P<0.01; PAC‐1, n=3, **P<0.01) and elevated ANP levels (phenylephrine, n=3, **P<0.01; PAC‐1, n=3, **P<0.01) compared with the serum‐free control. Conversely, cardiomyocytes treated with the conditioned phenylephrine (n=3, **P<0.01; ANP, n=3, **P<0.01) or PAC‐1 (n=3, **P<0.01; ANP, n=3, **P<0.01) hypertrophy medium plus a gelsolin antibody reduced the hypertrophy induction (n=3, **P<0.01). Preincubation with a gelsolin blocking peptide rescued the hypertrophy response. Bar=40 μm. Error bars represent SEM. DAPI indicates 4’,6‐diamidino‐2‐phenylindole.
Discussion
Caspase 3 signaling was previously demonstrated to be necessary and sufficient for the induction of hypertrophy.10 Pharmacologic or biologic caspase inhibition blocked hypertrophy, whereas small‐molecule activation of caspase 3 alone was sufficient to induce a hypertrophic response. Herein, we have demonstrated that gelsolin is a caspase cleavage target during negative remodeling of cardiomyocytes, and the resulting N‐terminal domain is sufficient for the development of pathologic hypertrophy. Prior studies have demonstrated that elevated expression of full‐length gelsolin is a trigger for pathologic hypertrophy,13, 17 yet our data suggest that caspase processing of gelsolin may be the requisite inductive cue. We observed that expression of the N‐terminal gelsolin fragment leads to robust actin/cytoskeletal bundling in cardiomyocytes, which is remarkably similar to the actin reordering that occurs in response to pathologic agonists. These cytoskeletal modifications are the primary target of activated N‐terminal gelsolin, yet we have also observed that the same gelsolin fragment engages the hypertrophy transcriptional program, with increased MEF2, nuclear factor‐κB, and serum response factor activity, along with elevations in B‐type natriuretic peptide and ANP reporters (Figure 2). At this stage, we have not identified the mechanism by which N‐terminal gelsolin relays the transcription signal; however, MCM1, Agamous, Deficiens, SRF (MADS) box transcription factors, such as serum response factor and MEF2, are known to be responsive to perturbations in actin structure.20, 21 We surmise that N‐terminal gelsolin modifies the actin superstructure to engage a kinase‐dependent signal that terminates with activation of these MADS box factors. Our preliminary analysis also suggests that caspase 3 signaling is a parallel independent pathway from the calcineurin‐NFAT axis (Figure S7A), where gelsolin signaling predominately activates transcription factors associated with actin/cytoskeleton. Overexpression of full‐length gelsolin has also been demonstrated to modify a p38/GATA4 signaling pathway.17 Whether this pathway is also active in response to caspase cleaved gelsolin will require further investigation.
Caspase activation is typically identified with the promotion of cell death/apoptosis, yet clear evidence has demonstrated various nondeath roles of these proteases.22, 23, 24, 25, 26, 27, 28 Indeed, the lethality of caspase activation is dependent on the level and duration of caspase activity,23, 25, 29, 30, 31, 32 where lower levels of caspase activation engage physiologic cell functions and higher levels of activity engage cell death. Subcellular localization of caspases and their respective targets is also a determinant in the death versus nondeath proteases.33, 34, 35 Our observations indicate that caspase cleavage of gelsolin is a temporally restricted phenomenon. We have previously demonstrated that caspase 3 cleaves the histone deacetylase HDAC3 to relieve repression of MEF2 factors, which then propels the early transcriptional response in both pathologic and physiologic hypertrophy.9, 10 These prior observations and the current study suggest that the gelsolin protein is only available for caspase 3 targeting at later stages, which coincides with an elevated enzymatic activity of the protease. The corollary to this hypothesis is that gelsolin protein is either inaccessible or actively protected from caspase 3 targeting in earlier stages of remodeling. Preliminary analysis of cardiotrophin 1–treated cardiomyocytes demonstrates almost undetectable processing of gelsolin (Figure S7B). This contrasts with hypertrophy induction via phenylephrine treatment, where gelsolin is robustly targeted by caspase 3, with a notable increase in cleavage products at 12 hours after treatment (Figure 1A). Interestingly, there is precedent for active shielding of caspase 3 substrates. The kinase casein kinase 2 phosphorylates caspase 3 cleavage sites in prospective target proteins, inducing steric hindrance to the protease.36 This posttranslational control of caspase 3 targeting has been noted in both skeletal28 and cardiac9 muscle growth; however, gelsolin has yet to be confirmed as a casein kinase 2 substrate during the early hypertrophy phase in cardiomyocytes. Alternatively, gelsolin may be sequestered by a chaperone‐like protein, a mechanism that is known to be used to protect proteins from effector caspase cleavage.37 Recently, the chaperone protein chaperonin containing Tcp‐1 (CCT) has been shown to directly bind gelsolin and repress its ability to induce actin polymerization.38 Whether this chaperone/gelsolin protein interaction is operative in cardiomyocytes will require further investigation.
Unabated cardiac remodeling is often problematic, because it frequently leads to loss of function and heart failure. As such, there is a fine balance in the capacity of cardiomyocytes to sustain sarcomeric and cytoskeletal protein fluctuations. For example, altered distribution and expression of α‐actinin and myocardial titin have been observed during cardiomyopathy,39 and the upregulation of microtubules and desmin filaments has been reported to be a contributing factor to cardiac malfunction.40 Notably, β‐adrenergic stimulation in cardiomyocytes leads to caspase‐mediated cleavage of sarcomeric proteins, including α‐actin, α‐actinin, and cardiac troponin T.41 Therefore, it is likely that continued caspase activation leads to decompensation/heart failure through combinatorial targeting of sarcomeric proteins and gelsolin, which acts to promote unrestrained actin polymerization. Clearly, long‐term expression of N‐terminal gelsolin is consistent with this hypothesis, because our experiments demonstrate initial improvement in cardiac function, which was followed by a significant decline at 28 days after N‐terminal gelsolin delivery (Figure 4B and Figure S6A). Scheubel et al showed conflicting results during human heart failure42; however, an overwhelming amount of evidence in the literature corroborates that caspase 3 activity is, in fact, robustly induced during heart failure.43, 44
We propose that paracrine‐mediated release of gelsolin may propel the transition from hypertrophy to decompensation and heart failure. In a physiologic hypertrophy setting, cardiomyocytes release paracrine factors to stimulate angiogenesis, ensuring that the growth in the myocardium is matched to appropriate vascular support.9 Herein, our experiments demonstrate that gelsolin acts as a paracrine factor to induce a pathologic hypertrophy response in otherwise naïve cells. Therefore, it is reasonable to conjecture that cardiomyocyte hypertrophy induced by endogenous caspase‐activated gelsolin, coupled with the release of gelsolin, would spur a global negative remodeling of the myocardium and accelerate the development of heart failure. In support of this concept, robust levels of gelsolin have been measured in exosomes released from noncardiac cell types,18, 19 whereas other studies have confirmed elevated serum concentrations of gelsolin in the post‐infarct heart.13, 45 Our observations suggest that antibodies directed against gelsolin may provide a means to titrate a gelsolin paracrine signal, limiting or reducing pathologic hypertrophy and its physiologic end point of heart failure.
In summary, our results show evidence indicating a crucial role for gelsolin and its caspase‐mediated processing in pathologic cardiac hypertrophy. Our work suggests that caspase signaling acts to engage both the transcriptional program and cytoskeletal accommodations that characterize pathologic cardiac hypertrophy. More important, this suggests that the identification of inhibitors that suppress caspase activity and/or activity of its substrates, including gelsolin, may offer novel therapeutic targets to limit the development of pathologic cardiac hypertrophy and/or prevent the transition to fulminant heart failure.
Sources of Funding
This work was supported by grants from the Canadian Institutes of Health Research (Megeney) and by the Ontario Graduate Scholarship (Putinski).
Disclosures
None.
Supporting information
Figure S1. Cytoplasmic and plasma Gelsolin start sites within the precursor Rattus norvegicus Gelsolin amino acid sequence.
Figure S2. Confirmation of proper expression from gelsolin adenoviruses.
Figure S3. Green fluorescence levels in no adenovirus treated rat heart.
Figure S4. Left ventricular posterior wall thickness and fractional shortening measured throughout gelsolin adenovirus in vivo study.
Figure S5. Additional analysis of heart sections 28 days after Gelsolin Adenovirus infection.
Figure S6. Atrial natriuretic peptide (ANP) expression levels in Gelsolin Adenovirus infected hearts.
Figure S7. Minimal NFAT transcriptional activity at 12 and 24 hours stimulation with GSN‐AdVs and attenuation of GSN cleavage upon stimulation with human cardiotrophin 1 (CT1) growth factor.
Acknowledgments
We thank members of the Megeney laboratory for helpful discussions; Dr Lawrence Puente for the mass spectrometry work and data analysis (Proteomics Core Facility, Ottawa Hospital Research Institute); Rick Seymour for performing ultrasound‐guided intracardiac injections and echocardiography measurements (University of Ottawa Heart Institute); and Dr Jeffery D. Molkentin for providing the serum response factor luciferase reporter plasmid (Cincinnati Children's Hospital Medical Center).
(J Am Heart Assoc. 2018;7:e010404 DOI: 10.1161/JAHA.118.010404.)
References
- 1. Kong SW, Bodyak N, Yue P, Liu Z, Brown J, Izumo S, Kang PM. Genetic expression profiles during physiological and pathological cardiac hypertrophy and heart failure in rats. Physiol Genomics. 2005;21:34–42. [DOI] [PubMed] [Google Scholar]
- 2. Hill JA, Olson EN. Cardiac plasticity. N Engl J Med. 2008;358:1370–1380. [DOI] [PubMed] [Google Scholar]
- 3. Dorn GW. The fuzzy logic of physiological cardiac hypertrophy. Hypertension. 2007;49:962–970. [DOI] [PubMed] [Google Scholar]
- 4. Chung E, Leinwand LA. Pregnancy as a cardiac stress model. Cardiovasc Res. 2014;101:561–570. [DOI] [PMC free article] [PubMed] [Google Scholar]
- 5. Roh J, Rhee J, Chaudhari V, Rosenzweig A. The role of exercise in cardiac aging. Circ Res. 2016;118:279–295. [DOI] [PMC free article] [PubMed] [Google Scholar]
- 6. Heineke J, Molkentin JD. Regulation of cardiac hypertrophy by intracellular signalling pathways. Nat Rev Mol Cell Biol. 2006;7:589–600. [DOI] [PubMed] [Google Scholar]
- 7. Frey N, Olson EN. Cardiac hypertrophy: the good, the bad, and the ugly. Annu Rev Physiol. 2003;65:45–79. [DOI] [PubMed] [Google Scholar]
- 8. van Berlo JH, Maillet M, Molkentin JD. Signaling effectors underlying pathologic growth and remodeling of the heart. J Clin Invest. 2013;123:37–45. [DOI] [PMC free article] [PubMed] [Google Scholar]
- 9. Abdul‐Ghani M, Suen C, Jiang B, Deng Y, Weldrick JJ, Putinski C, Brunette S, Fernando P, Lee TT, Flynn P, Leenen FHH, Burgon PG, Stewart DJ, Megeney LA. Cardiotrophin 1 stimulates beneficial myogenic and vascular remodeling of the heart. Cell Res. 2017;27:1195–1215. [DOI] [PMC free article] [PubMed] [Google Scholar]
- 10. Putinski C, Abdul‐Ghani M, Stiles R, Brunette S, Dick SA, Fernando P, Megeney LA. Intrinsic‐mediated caspase activation is essential for cardiomyocyte hypertrophy. Proc Natl Acad Sci USA. 2013;110:E4079–E4087. [DOI] [PMC free article] [PubMed] [Google Scholar]
- 11. Geng YJ, Azuma T, Tang JX, Hartwig JH, Muszynski M, Wu Q, Libby P, Kwiatkowski DJ. Caspase‐3‐induced gelsolin fragmentation contributes to actin cytoskeletal collapse, nucleolysis, and apoptosis of vascular smooth muscle cells exposed to proinflammatory cytokines. Eur J Cell Biol. 1998;77:294–302. [DOI] [PubMed] [Google Scholar]
- 12. Kothakota S, Azuma T, Reinhard C, Klippel A, Tang J, Chu K, McGarry TJ, Kirschner MW, Koths K, Kwiatkowski DJ, Williams LT. Caspase‐3‐generated fragment of gelsolin: effector of morphological change in apoptosis. Science. 1997;278:294–298. [DOI] [PubMed] [Google Scholar]
- 13. Li GH, Shi Y, Chen Y, Sun M, Sader S, Maekawa Y, Arab S, Dawood F, Chen M, De Couto G, Liu Y, Fukuoka M, Yang S, Da Shi M, Kirshenbaum LA, McCulloch CA, Liu P. Gelsolin regulates cardiac remodeling after myocardial infarction through DNase I‐mediated apoptosis. Circ Res. 2009;104:896–904. [DOI] [PubMed] [Google Scholar]
- 14. Martin P, Pardo J, Schill N, Jöckel L, Berg M, Froelich CJ, Wallich R, Simon MM. Granzyme B‐induced and caspase 3‐dependent cleavage of gelsolin by mouse cytotoxic T cells modifies cytoskeleton dynamics. J Biol Chem. 2010;285:18918–18927. [DOI] [PMC free article] [PubMed] [Google Scholar]
- 15. Kwiatkowski DJ, Stossel TP, Orkin SH, Mole JE, Colten HR, Yin HL. Plasma and cytoplasmic gelsolins are encoded by a single gene and contain a duplicated actin‐binding domain. Nature. 1986;323:455–458. [DOI] [PubMed] [Google Scholar]
- 16. Nag S, Larsson M, Robinson RC, Burtnick LD. Gelsolin: the tail of a molecular gymnast. Cytoskeleton. 2013;70:360–384. [DOI] [PubMed] [Google Scholar]
- 17. Hu W‐S, Ho T‐J, Pai P, Chung L‐C, Kuo C‐H, Chang S‐H, Tsai F‐J, Tsai C‐H, Jie Y‐C, Liou Y‐M, Huang C‐Y. Gelsolin (GSN) induces cardiomyocyte hypertrophy and BNP expression via p38 signaling and GATA‐4 transcriptional factor activation. Mol Cell Biochem. 2014;390:263–270. [DOI] [PubMed] [Google Scholar]
- 18. Ji H, Erfani N, Tauro BJ, Kapp EA, Zhu H‐J, Moritz RL, Lim JWE, Simpson RJ. Difference gel electrophoresis analysis of Ras‐transformed fibroblast cell‐derived exosomes. Electrophoresis. 2008;29:2660–2671. [DOI] [PubMed] [Google Scholar]
- 19. Welton JL, Khanna S, Giles PJ, Brennan P, Brewis IA, Staffurth J, Mason MD, Clayton A. Proteomics analysis of bladder cancer exosomes. Mol Cell Proteomics. 2010;9:1324–1338. [DOI] [PMC free article] [PubMed] [Google Scholar]
- 20. Sotiropoulos A, Gineitis D, Copeland J, Treisman R. Signal‐regulated activation of serum response factor is mediated by changes in actin dynamics. Cell. 1999;98:159–169. [DOI] [PubMed] [Google Scholar]
- 21. Kircher P, Hermanns C, Nossek M, Drexler MK, Grosse R, Fischer M, Sarikas A, Penkava J, Lewis T, Prywes R, Gudermann T, Muehlich S. Filamin A interacts with the coactivator MKL1 to promote the activity of the transcription factor SRF and cell migration. Sci Signal. 2015;8:ra112. [DOI] [PubMed] [Google Scholar]
- 22. Zermati Y, Garrido C, Amsellem S, Fishelson S, Bouscary D, Valensi F, Varet B, Solary E, Hermine O. Caspase activation is required for terminal erythroid differentiation. J Exp Med. 2001;193:247–254. [DOI] [PMC free article] [PubMed] [Google Scholar]
- 23. Fernando P, Kelly JF, Balazsi K, Slack RS, Megeney LA. Caspase 3 activity is required for skeletal muscle differentiation. Proc Natl Acad Sci USA. 2002;99:11025–11030. [DOI] [PMC free article] [PubMed] [Google Scholar]
- 24. Arama E, Agapite J, Steller H. Caspase activity and a specific cytochrome C are required for sperm differentiation in Drosophila. Dev Cell. 2003;4:687–697. [DOI] [PubMed] [Google Scholar]
- 25. Fernando P, Brunette S, Megeney LA. Neural stem cell differentiation is dependent upon endogenous caspase 3 activity. FASEB J. 2005;19:1671–1673. [DOI] [PubMed] [Google Scholar]
- 26. Fujita J, Crane AM, Souza MK, Dejosez M, Kyba M, Flavell RA, Thomson JA, Zwaka TP. Caspase activity mediates the differentiation of embryonic stem cells. Cell Stem Cell. 2008;2:595–601. [DOI] [PMC free article] [PubMed] [Google Scholar]
- 27. Abdul‐Ghani M, Dufort D, Stiles R, De Repentigny Y, Kothary R, Megeney LA. Wnt11 promotes cardiomyocyte development by caspase‐mediated suppression of canonical Wnt signals. Mol Cell Biol. 2011;31:163–178. [DOI] [PMC free article] [PubMed] [Google Scholar]
- 28. Dick SA, Chang NC, Dumont NA, Bell RAV, Putinski C, Kawabe Y, Litchfield DW, Rudnicki MA, Megeney LA. Caspase 3 cleavage of Pax7 inhibits self‐renewal of satellite cells. Proc Natl Acad Sci USA. 2015;112:E5246–E5252. [DOI] [PMC free article] [PubMed] [Google Scholar]
- 29. Adams JW, Sakata Y, Davis MG, Sah VP, Wang Y, Liggett SB, Chien KR, Brown JH, Dorn GW II. Enhanced Galphaq signaling: a common pathway mediates cardiac hypertrophy and apoptotic heart failure. Proc Natl Acad Sci USA. 1998;95:10140–10145. [DOI] [PMC free article] [PubMed] [Google Scholar]
- 30. Yang JY, Widmann C. Antiapoptotic signaling generated by caspase‐induced cleavage of RasGAP. Mol Cell Biol. 2001;21:5346–5358. [DOI] [PMC free article] [PubMed] [Google Scholar]
- 31. Yang J‐Y, Michod D, Walicki J, Murphy BM, Kasibhatla S, Martin SJ, Widmann C. Partial cleavage of RasGAP by caspases is required for cell survival in mild stress conditions. Mol Cell Biol. 2004;24:10425–10436. [DOI] [PMC free article] [PubMed] [Google Scholar]
- 32. Weber GF, Menko AS. The canonical intrinsic mitochondrial death pathway has a non‐apoptotic role in signaling lens cell differentiation. J Biol Chem. 2005;280:22135–22145. [DOI] [PubMed] [Google Scholar]
- 33. De Botton S, Sabri S, Daugas E, Zermati Y, Guidotti JE, Hermine O, Kroemer G, Vainchenker W, Debili N. Platelet formation is the consequence of caspase activation within megakaryocytes. Blood. 2002;100:1310–1317. [DOI] [PubMed] [Google Scholar]
- 34. Fernando P, Megeney LA. Is caspase‐dependent apoptosis only cell differentiation taken to the extreme? FASEB J. 2007;21:8–17. [DOI] [PubMed] [Google Scholar]
- 35. Koenig A, Russell JQ, Rodgers WA, Budd RC. Spatial differences in active caspase‐8 defines its role in T‐cell activation versus cell death. Cell Death Differ. 2008;15:1701–1711. [DOI] [PMC free article] [PubMed] [Google Scholar]
- 36. Duncan JS, Turowec JP, Duncan KE, Vilk G, Wu C, Luscher B, Li SS‐C, Gloor GB, Litchfield DW. A peptide‐based target screen implicates the protein kinase CK2 in the global regulation of caspase signaling. Sci Signal. 2011;4:ra30. [DOI] [PubMed] [Google Scholar]
- 37. Bell RAV, Megeney LA. Evolution of caspase‐mediated cell death and differentiation: twins separated at birth. Cell Death Differ. 2017;24:1359–1368. [DOI] [PMC free article] [PubMed] [Google Scholar]
- 38. Svanström A, Grantham J. The molecular chaperone CCT modulates the activity of the actin filament severing and capping protein gelsolin in vitro. Cell Stress Chaperones. 2016;21:55–62. [DOI] [PMC free article] [PubMed] [Google Scholar]
- 39. Kawaguchi N, Fujitani N, Schaper J, Onishi S. Pathological changes of myocardial cytoskeleton in cardiomyopathic hamster. Mol Cell Biochem. 1995;144:75–79. [DOI] [PubMed] [Google Scholar]
- 40. Wang X, Li F, Campbell SE, Gerdes AM. Chronic pressure overload cardiac hypertrophy and failure in guinea pigs, II: cytoskeletal remodeling. J Mol Cell Cardiol. 1999;31:319–331. [DOI] [PubMed] [Google Scholar]
- 41. Communal C, Sumandea M, de Tombe P, Narula J, Solaro RJ, Hajjar RJ. Functional consequences of caspase activation in cardiac myocytes. Proc Natl Acad Sci USA. 2002;99:6252–6256. [DOI] [PMC free article] [PubMed] [Google Scholar]
- 42. Scheubel RJ, Bartling B, Simm A, Silber R‐E, Drogaris K, Darmer D, Holtz J. Apoptotic pathway activation from mitochondria and death receptors without caspase‐3 cleavage in failing human myocardium. J Am Coll Cardiol. 2002;39:481–488. [DOI] [PubMed] [Google Scholar]
- 43. Narula J, Pandey P, Arbustini E, Haider N, Narula N, Kolodgie FD, Dal Bello B, Semigran MJ, Bielsa‐Masdeu A, Dec GW, Israels S, Ballester M, Virmani R, Saxena S, Kharbanda S. Apoptosis in heart failure: release of cytochrome c from mitochondria and activation of caspase‐3 in human cardiomyopathy. Proc Natl Acad Sci USA. 1999;96:8144–8149. [DOI] [PMC free article] [PubMed] [Google Scholar]
- 44. Saraste A, Pulkki K, Kallajoki M, Heikkilä P, Laine P, Mattila S, Nieminen MS, Parvinen M, Voipio‐Pulkki LM. Cardiomyocyte apoptosis and progression of heart failure to transplantation. Eur J Clin Invest. 1999;29:380–386. [DOI] [PubMed] [Google Scholar]
- 45. Li GH, Arora PD, Chen Y, McCulloch CA, Liu P. Multifunctional roles of gelsolin in health and diseases. Med Res Rev. 2012;32:999–1025. [DOI] [PubMed] [Google Scholar]
Associated Data
This section collects any data citations, data availability statements, or supplementary materials included in this article.
Supplementary Materials
Figure S1. Cytoplasmic and plasma Gelsolin start sites within the precursor Rattus norvegicus Gelsolin amino acid sequence.
Figure S2. Confirmation of proper expression from gelsolin adenoviruses.
Figure S3. Green fluorescence levels in no adenovirus treated rat heart.
Figure S4. Left ventricular posterior wall thickness and fractional shortening measured throughout gelsolin adenovirus in vivo study.
Figure S5. Additional analysis of heart sections 28 days after Gelsolin Adenovirus infection.
Figure S6. Atrial natriuretic peptide (ANP) expression levels in Gelsolin Adenovirus infected hearts.
Figure S7. Minimal NFAT transcriptional activity at 12 and 24 hours stimulation with GSN‐AdVs and attenuation of GSN cleavage upon stimulation with human cardiotrophin 1 (CT1) growth factor.