

Abstract
Background
Dietary interventions may play a role in secondary cardiovascular prevention. hsCRP (High‐sensitivity C‐reactive protein) is a marker of risk for major adverse cardiovascular outcomes in coronary artery disease.
Methods and Results
The open‐label, blinded end‐point, EVADE CAD (Effects of a Vegan Versus the American Heart Association‐Recommended Diet in Coronary Artery Disease) trial randomized participants (n=100) with coronary artery disease to 8 weeks of a vegan or American Heart Association–recommended diet with provision of groceries, tools to measure dietary intake, and dietary counseling. The primary end point was high‐sensitivity C‐reactive protein. A linear regression model compared end points after 8 weeks of a vegan versus American Heart Association diet and adjusted for baseline concentration of the end point. Significance levels for the primary and secondary end points were set at 0.05 and 0.0015, respectively. A vegan diet resulted in a significant 32% lower high‐sensitivity C‐reactive protein (β, 0.68, 95% confidence interval [0.49–0.94]; P=0.02) when compared with the American Heart Association diet. Results were consistent after adjustment for age, race, baseline waist circumference, diabetes mellitus, and prior myocardial infarction (adjusted β, 0.67 [0.47–0.94], P=0.02). The degree of reduction in body mass index and waist circumference did not significantly differ between the 2 diet groups (adjusted β, 0.99 [0.97–1.00], P=0.10; and adjusted β, 1.00 [0.98–1.01], P=0.66, respectively). There were also no significant differences in markers of glycemic control between the 2 diet groups. There was a nonsignificant 13% reduction in low‐density lipoprotein cholesterol with the vegan diet when compared with the American Heart Association diet (adjusted β, 0.87 [0.78–0.97], P=0.01). There were no significant differences in other lipid parameters.
Conclusions
In patients with coronary artery disease on guideline‐directed medical therapy, a vegan diet may be considered to lower high‐sensitivity C‐reactive protein as a risk marker of adverse outcomes.
Clinical Trial Registration
URL: http://www.clinicaltrials.gov. Unique identifier: NCT02135939.
Keywords: C‐reactive protein, diet, inflammation
Subject Categories: Diet and Nutrition, Secondary Prevention
Clinical Perspective
What Is New?
In a patient with coronary artery disease on guideline‐directed medical therapy, a plant‐based vegan diet may be an adjunctive treatment to lower high‐sensitivity C‐reactive protein.
A vegan diet does not appear to provide greater benefit when compared with the American Heart Association–recommended diet in terms of weight loss, glycemic control, or dyslipidemia.
What Are the Clinical Implications?
A vegan diet may be used to lower inflammation as measured by high‐sensitivity C‐reactive protein, a key player in the development of major adverse cardiovascular events.
Introduction
Inflammation plays a central role in the progression of atherosclerosis and is associated with adverse cardiovascular events.1, 2, 3, 4, 5, 6 Targeted anti‐inflammatory therapy and reductions in hsCRP (high sensitivity C‐reactive protein) have been shown to reduce major adverse cardiovascular events in patients with established coronary artery disease (CAD).7, 8, 9 Approximately one third of patients with stable CAD have an hsCRP above the upper limit of normal, and there is a complex interplay between inflammation and glucometabolic disease that may further exacerbate cardiovascular risk.10, 11, 12, 13, 14, 15, 16, 17, 18 Furthermore, up to 45% of patients will continue to have elevated hsCRP and thus residual risk despite anti‐inflammatory therapy.7 Therefore, investigation of additional strategies to address the residual risk associated with inflammation in these patients are warranted.
The American Heart Association's (AHA) strategy to reduce the health burden associated with CAD has a focus on a healthy diet and lifestyle.19 Although multiple dietary factors influence CAD, few studies examine a particular diet compared with the standard recommended heart‐healthy diet in patients with CAD.20, 21, 22 A plant‐based vegan diet has been shown to significantly reduce adverse markers of poor cardiovascular health over time, but limited data include a heart‐healthy diet as the comparator arm in patients receiving guideline‐directed medical therapy.23, 24, 25, 26 Lack of the same support resources in the intervention and control groups have confounded prior direct comparisons of the diets alone. Furthermore, several prior studies of a vegan diet provided full meals, limiting the generalizability of the results to patients in their home environment who do not have access to prepared meals.23, 24 In sum, data on the effects of dietary strategies on systemic inflammation incremental to medical therapy are limited.
The aim of this study was to determine the effects of a vegan versus AHA‐recommended diet on hsCRP, as well as other markers of inflammation, glucometabolic markers, and lipid profiles in patients with established CAD on guideline‐directed medical therapy.
Methods
The data, analytic methods, and study materials will not be made available to other researchers for purposes of reproducing the results or replicating the procedure, as additional analyses may be forthcoming.
Study Cohort
The EVADE CAD (Effects of a Vegan Versus the American Heart Association‐Recommended Diet in Coronary Artery Disease) trial design and rationale have been described in detail.27 Briefly, between March 11, 2014, and February 2, 2017, 100 participants from New York University Langone Medical Center with a history of angiographically defined CAD (≥50% lesion in an artery with ≥2‐mm caliber) underwent 1:1 randomization to either a vegan diet or the AHA‐recommended diet. Major exclusion criteria included (1) history of an eating disorder; (2) already on a vegetarian or vegan diet; (3) use of steroids or nonsteroidal anti‐inflammatory medications other than aspirin; (4) history of a myocardial infarction or coronary artery bypass graft surgery within the preceding 3 months; (5) presence of infection within the preceding 3 months; and (6) have a planned staged coronary revascularization or other surgical procedure during study period. Potential participants were also excluded if they had a score of >4 on any of the amotivational items or if the relative autonomy index (defined as average of answers for the 6 autonomous items—average of answers for the 6 controlled items) was ≤0 on a treatment self‐regulation questionnaire28 (Figure 1).
Figure 1.
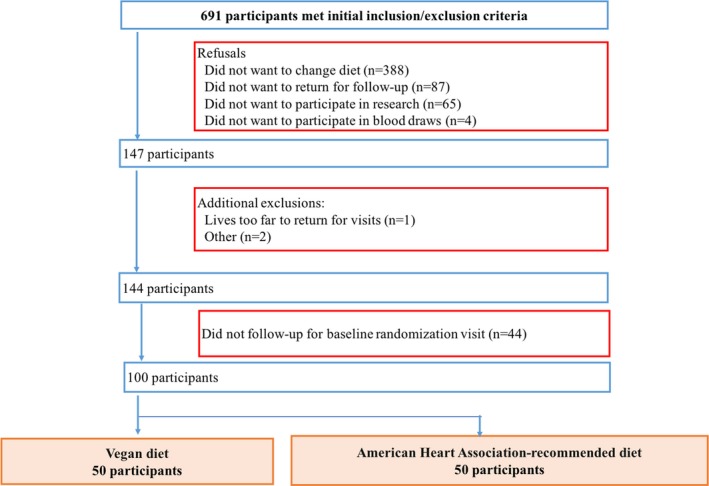
Study cohort.
The New York University School of Medicine Institutional Review Board approved the study, and all participants provided written informed consent. The trial is registered at clinicaltrials.gov (NCT02135939). The Purjes Foundation (Salt Lake City, UT) was the primary sponsor of the trial and did not contribute to the study design or data analysis.
Study Design
This trial utilized a prospective, randomized, open‐label, blinded end point study design.29 A 1‐to‐1 randomization sequence was computer generated by the study biostatistician. Only the biostatistician and a member of the cardiovascular clinical research center, who was not a member of the study team, had access to this sequence and provided the dietary assignment via e‐mail after the participant provided written informed consent. Participants were randomized at least 7 days after invasive coronary angiography so that medication regimens would be as stable as possible during the study period. The active study duration was 8 weeks, with an interim visit at 4 weeks and a final visit at 8 weeks. Between visits, participants in both treatment groups had access to the study's registered dietitian by telephone and e‐mail, and a 24‐hour dietary recall was performed twice a week on random days. In addition, participants were instructed to fill out a 4‐day food record during the 1 week before each of the 3 visits. Groceries that supported the dietary recommendations of the intervention assignment were provided on a weekly basis, along with a cookbook (Simply Vegan, Baltimore: Vegetarian Resource Group, 2012; or AHA Low‐Fat, Low‐Cholesterol Cookbook, New York: Clarkson Potter, 2008), handouts from the Nutrition Care Manual of the Academy of Nutrition and Dietetics (http://www.eatright.org), a 2‐week sample menu, food scale, measuring spoons, and measuring cups. As previously described, the dietary intervention was kept as similar as possible, with only substitution of animal‐based protein for plant‐based protein on handouts, grocery menus, 2‐week sample menus, and recipes.27 Physical activity was assessed at each of the 3 study visits using the International Physical Activity Questionnaire‐Short Form questionnaire.30
Measures of Dietary Adherence
Adherence was assessed each week using the information collected during the two 24‐hour dietary recalls as previously described.27 Briefly, the following adherence method was developed with the aim to use a practical and quantifiable way of capturing animal protein in a diet using similar criteria for both groups. Furthermore, the data to evaluate adherence were obtained in the same manner in both groups. A script was developed by the study registered dietitian to allow for consistent interactions with the study participants and reduce bias throughout the study. Participants in the vegan diet group received 1 point for abstinence from each of the following: (1) meat/poultry/eggs, (2) dairy, and (3) seafood. Participants in the vegan diet group could earn up to 3 points on each of the two 24‐hour dietary recalls, and a score of 5 to 6 was defined as adherent to the vegan diet for that week. Participants in the AHA‐recommended diet group received 1 point for consumption of each of the following: (1) ≤5 oz of animal protein/day, (2) only low‐fat/fat‐free dairy if dairy was consumed, (3) fish ≥2 times/week. A score of 4 to 5 defined adherence to the AHA‐recommended diet for that week. Of note, if a participant in the AHA group did not report fish intake on both dietary recalls, participants were asked if they had been eating fish at least 2 times per week at the end of the second 24‐hour dietary recall. Participants were determined to be adherent at the 4‐week interim and 8‐week final follow‐up visits if they were adherent for at least 2 of the 3 weeks evaluated between visits. To better examine whether the dietary intakes of the participants were in the spirit of the guidelines, MyPlate servings of fruits, vegetables, and whole grains were also determined in each diet group using Food Processor 11.0.137 (ESHA Research, Salem, OR).
End Points
The primary end point was hsCRP concentration. Secondary end points included the following inflammatory markers: white blood cell count and subtypes (neutrophil/lymphocyte ratio and monocyte subtypes), white blood cell cellular adhesion molecules (neutrophil‐surface expression of L‐selectin to CD11b ratio, soluble L‐selectin, soluble E‐selectin, intracellular adhesion molecule, vascular cellular adhesion molecule), other markers of neutrophil activity (neutrophil gelatinase‐associated lipocalin, myeloperoxidase), and urine F2‐isoprostane/creatinine ratio.
Other secondary end points included anthropometric data (body mass index, waist circumference), glycemic markers (fasting blood glucose concentration, hemoglobin A1c level, blood insulin concentration), lipid profiles (total cholesterol concentration, non–high‐density lipoprotein [HDL] cholesterol concentration, low‐density lipoprotein [LDL] cholesterol concentration [calculated], LDL size, LDL particle number, small LDL particle number, oxidized LDL concentration, very low‐density lipoprotein size, large very low‐density lipoprotein particle number, triglycerides concentration, HDL cholesterol concentration, HDL size, HDL particle number, large HDL particle number), and quality of life as measured by the EuroQol 5 dimensions questionnaire.
Endothelium activity was measured, as an exploratory end point, in a subset of participants using the EndoPat Device (Itamar Medical Ltd, Caesarea, Israel). Major adverse cardiovascular and cerebrovascular event was defined as the composite of all‐cause mortality, myocardial infarction, stroke or transient ischemic attack, and repeat coronary revascularization. Participants were directly asked about interim clinical events during study visits. Source documents were collected, and the reported events were adjudicated by the study investigators blinded to treatment allocation.
The Cleveland HeartLab, Inc (Cleveland, OH) measured certain markers of inflammation (hsCRP, myeloperoxidase, hemogram with differential), the comprehensive lipid profiles, and glucometabolic parameters at no cost. Itamar Medical Ltd (Caesarea, Israel) provided the EndoPat machine to measure endothelial function. These sponsors also did not contribute to the study design or data analysis. All other secondary end points were measured at New York University School of Medicine.
Statistical Analyses
As previously described,27 sample size was calculated using preliminary data from our cardiac catheterization laboratory (mean hsCRP concentration, 2.07±0.57 mg/L), and based on an estimated decrease in mean hsCRP concentration by 20% with the vegan diet as compared with the AHA diet, significance level of 0.05, and power of 0.80. Using a 2‐sided 2‐sample t test, the number of participants needed in each group was estimated to be 30. After adjusting for a 40% floor effect (including possible participant drops), the sample size in each group was increased to 50.
Summary data are presented as median [interquartile range] for continuous variables and proportion (frequency) for categorical variables. Continuous data were compared between the 2 dietary groups with the Mann–Whitney test, and categorical data were compared between the 2 dietary groups with Fisher's exact test or chi‐squared test. Changes in dietary and physical activity data within each dietary group over time were compared using a related‐samples Wilcoxon signed‐rank test.
The primary analyses compared the 2 dietary strategies for the change in end points from baseline to 8 weeks. End points after 8 weeks of dietary intervention were assessed in the vegan diet group with AHA‐recommended diet group as the reference using a linear regression model. Model 1 was adjusted for the baseline concentration of the end point. Model 2 was additionally adjusted for covariates that may affect systemic inflammation—age, race, baseline waist circumference, diabetes mellitus, and prior myocardial infarction. Given their skewed distribution, the end points were log‐transformed for these analyses and then transformed back to their original scale for presentation. Back‐transformed beta estimates of treatment (vegan versus AHA‐recommended diet) along with 95% confidence intervals were reported to assess the magnitude of the effect size. Statistical significance was tested using a 2‐sided alpha level of 0.05 for the primary end point and 0.0015 for the secondary end points after Bonferroni adjustment for multiple comparisons. All analyses were performed as intention‐to‐treat. Statistical analyses were performed using the IBM SPSS Statistics software, version 23 (IBM Corporation, Armonk, NY) and SAS 9.4 (SAS Institute Inc, Cary, NC).
Results
Baseline Characteristics
Baseline demographic and clinical characteristics are shown in Table 1. Participants in the vegan diet group were older than those in the AHA diet group (63.0 [57.0–68.0] versus 59.5 [53.0–67.0], P=0.06). The majority of participants were white males and had a history of coronary revascularization. More than three quarters of the participants had dyslipidemia, and more than half had hypertension. Although more than half of the participants had a history of tobacco use, only a minority of participants actively smoked. Diabetes mellitus and prior myocardial infarction were present in ≈30% of participants, but other major comorbidities were present in less than one fifth of the participants.
Table 1.
Baseline Demographic and Clinical Characteristics of Participants With Angiographically Defined Coronary Artery Disease Randomized to the Vegan Versus American Heart Association–Recommended Diet
| Vegan Diet (n=50) | American Heart Association–Recommended Diet (n=50) | P Value | |
|---|---|---|---|
| Age, y | 63.0 [57.0–68.0] | 59.5 [53.0–67.0] | 0.06 |
| Male sex | 86% (43) | 84% (42) | 0.99 |
| Race | 0.17 | ||
| White | 92% (46) | 80% (40) | |
| Black | 2% (1) | 12% (6) | |
| Asian | 6% (3) | 6% (3) | |
| Other | 0 | 2% (1) | |
| Hispanic ethnicity | 8% (4) | 10% (5) | 0.99 |
| Tobacco usea | 58% (29) | 50% (25) | 0.55 |
| Current tobacco use | 8% (4) | 2% (1) | 0.36 |
| Hypertension | 64% (32) | 62% (31) | 0.99 |
| Dyslipidemia | 78% (39) | 78% (39) | 0.99 |
| Diabetes mellitus | 24% (12) | 36% (18) | 0.28 |
| Prior myocardial infarction | 24% (12) | 38% (19) | 0.19 |
| Prior coronary revascularization | 90% (45) | 92% (46) | 0.99 |
| Congestive heart failure requiring diuretic treatment | 0 | 4% (2) | 0.50 |
| Stroke or transient ischemic attack | 0 | 2% (1) | 0.99 |
| Carotid artery diseaseb | 14% (7) | 18% (9) | 0.60 |
| Lower extremity artery diseasec | 2% (1) | 6% (3) | 0.62 |
| Chronic renal dysfunction | 0 | 4% (2) | 0.50 |
| Dialysis | 0 | 2% (1) | 0.99 |
| Aspirin | 92% (46) | 96% (48) | 0.68 |
| Any P2Y12 inhibitor | 86% (43) | 84% (42) | 0.99 |
| Statin | 94% (47) | 96% (48) | 0.99 |
| High‐dose statind | 58% (29) | 56% (28) | 0.99 |
| β‐Blocker | 66% (33) | 62% (31) | 0.84 |
| Calcium channel blocker | 20% (10) | 16% (8) | 0.80 |
| Angiotensin‐converting enzyme inhibitor or angiotensin receptor blocker | 56% (28) | 52% (26) | 0.84 |
| Long‐acting nitrate | 4% (2) | 4% (2) | 0.99 |
| Ranolazine | 2% (1) | 6% (3) | 0.62 |
| Left ventricular ejection fraction | 0.31 | ||
| Normal or borderline | 94% (45) | 87% (39) | |
| Mildly/moderately reduced | 6% (3) | 13% (6) | |
| Severely reduced | 0 | 0 | |
| Number of vessels diseased on invasive coronary angiographye | 0.49 | ||
| 1 | 30% (15) | 38% (19) | |
| 2 | 38% (19) | 40% (20) | |
| 3 | 32% (16) | 22% (11) | |
| Number of vessels diseased on invasive coronary angiographyf | 0.69 | ||
| 0 | 6% (3) | 2% (1) | |
| 1 | 46% (23) | 52% (26) | |
| 2 | 30% (15) | 32% (16) | |
| 3 | 18% (9) | 14% (7) |
Continuous data are presented as median [interquartile range] and compared using the Mann–Whitney test. Categorical data are presented as proportion (frequency) and compared using Fisher's exact test or χ2 test.
Tobacco use was defined as ever smoked >100 cigarettes or 5 cigars or pipes in lifetime, and current tobacco use was defined as use within past 6 months.
Carotid disease was defined as ≥50% stenosis or qualitatively moderate or severe stenosis reported on carotid imaging or prior carotid artery revascularization.
Lower extremity peripheral artery disease was defined as ≥50% stenosis or qualitatively moderate or severe stenosis reported on lower extremity arterial imaging or prior lower extremity artery revascularization.
Atorvastatin 40 to 80 mg or rosuvastatin 20 to 40 mg.
Defined as ≥50% diameter stenosis by visual estimate, physiologically significant lesion as assessed by pressure gradient, or prior revascularization.
Defined as ≥70% diameter stenosis by visual estimate, physiologically significant by pressure gradient, or prior revascularization.
Baseline medication use and ancillary cardiac data are also shown in Table 1. Almost all participants in both diet groups were on aspirin and statin therapy, while a majority were also on a P2Y12‐inhibitor. More than half of the patients were on high‐dose statin therapy (atorvastatin 40–80 mg or rosuvastatin 20–40 mg). The majority of participants had normal left ventricular function and significant CAD on invasive coronary angiography.
Follow‐Up Characteristics
Two participants withdrew from the trial, both of whom were from the vegan diet group. One withdrew after 1 week and the other after 2 weeks. One participant in the AHA diet group refused a blood draw at the 8‐week final visit.
Clinical covariates
Of the 4 users of tobacco within the 6 months before randomization in the vegan diet group, 2 did not use tobacco during the 8‐week study period, 1 did not use tobacco between the 4‐week interim and 8‐week final visit, and 1 continued to use tobacco throughout the 8 weeks of the active study. The 1 user of tobacco within the 6 months before randomization in the AHA diet group did not use tobacco during the 8‐week study period.
A low proportion of participants underwent a cardiac rehabilitation program during the 8‐week study period in both the vegan (n=4) and AHA (n=5) diet groups.
Nutrient and physical activity data
Dietary intake data over the active study period are shown in Table 2. At baseline, there were no significant differences in reported dietary intake of key nutrients between the 2 diet groups. Over time, reported intakes of energy, protein, fat, and saturated fat significantly decreased in both groups. However, at the end of the study period, reported energy intake was higher (P=0.01), while protein intake was lower (P<0.001), in the vegan versus AHA diet group. Reported carbohydrate intake increased over the active study period in the vegan diet group (P=0.02) and, at the end of the study period, was higher in the vegan versus AHA diet group (P<0.001). Although the reported dietary fiber intake increased over the study period in both diet groups, at the end of the study period, dietary fiber intake was higher in the vegan versus AHA diet group (P<0.001). While intake of grains and vegetables increased in the vegan diet group over the study period (P=0.01 and P<0.001, respectively), at the end of the study period, only the intake of grains was significantly higher in the vegan versus AHA diet groups (P<0.001). Finally, micronutrient data show a lower intake of vitamin B12, zinc, and omega‐3 fatty acids over the study period in the vegan group (P<0.001), and at the end of the study period, these micronutrients were significantly lower in the vegan versus AHA diet groups (P<0.001).
Table 2.
Nutrient Data in Participants With Angiographically Defined Coronary Artery Disease Randomized to the Vegan Versus American Heart Association–Recommended Diet for 8 Weeks
| Vegan Diet (n=50) | American Heart Association–Recommended Diet (n=50) | P Value Between Groups | ||||||
|---|---|---|---|---|---|---|---|---|
| Baseline | 8 Weeks | P Value | Baseline | 8 Weeks | P Value | Baseline | 8 Weeks | |
| Energy, kcal | 1871 [1470–2447] | 1715 [1482–2052] | 0.07 | 1761 [1452–2295] | 1531 [1197–1817] | <0.001 | 0.66 | 0.01 |
| Protein, g | 96 [72–110] | 50 [40–70] | <0.001 | 86 [64–116] | 80 [66–92] | 0.04 | 0.39 | <0.001 |
| Energy from protein, % | 20.2 [15.4–24.2] | 12.9 [10.5–14.1] | <0.001 | 18.7 [16.9–20.3] | 21.4 [18.2–23.7] | 0.001 | 0.30 | <0.001 |
| Carbohydrates, g | 216 [164–283] | 242 [210–289] | 0.02 | 205 [158–258] | 170 [140–222] | 0.01 | 0.52 | <0.001 |
| Energy from carbohydrates, % | 45.4 [37.6–52.0] | 57.5 [52.5–63.3] | <0.001 | 43.2 [38.8–50.1] | 47.9 [39.8–54.0] | 0.10 | 0.64 | <0.001 |
| Fiber, g | 21 [15–27] | 36 [30–43] | <0.001 | 22 [15–28] | 25 [20–30] | 0.003 | 0.56 | <0.001 |
| Fat, g | 69 [46–100] | 56 [46–72] | 0.006 | 68 [50–94] | 48 [37–65] | <0.001 | 0.79 | 0.05 |
| Energy from fat, % | 35.3 [27.1–41.0] | 29.9 [26.5–36.4] | 0.03 | 37.1 [31.2–40.8] | 30.2 [25.8–37.1] | 0.002 | 0.28 | 0.88 |
| Saturated fat, g | 20 [12–36] | 9 [6–12] | <0.001 | 18 [12–28] | 10 [8–15] | <0.001 | 0.38 | 0.03 |
| Energy from saturated fat, % | 11.0 [7.2–13.5] | 4.5 [3.6–5.3] | <0.001 | 9.2 [7.0–11.8] | 6.6 [4.7–8.1] | <0.001 | 0.22 | <0.001 |
| Trans fatty acids, g | 0.52 [0.10–0.93] | 0.06 [0.00–0.74] | 0.15 | 0.38 [0.11–0.67] | 0.14 [0.05–0.43] | 0.005 | 0.41 | 0.40 |
| Cholesterol, mg | 271 [169–403] | 0 [0–2] | <0.001 | 227 [135–368] | 142 [110–240] | 0.003 | 0.13 | <0.001 |
| Sodium, mg | 2347 [1540–3130] | 1890 [1547–2269] | 0.03 | 2226 [1370–2872] | 1497 [1139–2090] | <0.001 | 0.22 | 0.006 |
| Vitamin B12, μg | 4.6 [2.4–8.6] | 1.2 [0.1–2.6] | <0.001 | 3.2 [1.7–4.6] | 3.5 [2.3–5.4] | 0.54 | 0.009 | <0.001 |
| Calcium, mg | 750 [489–1010] | 577 [438–807] | 0.01 | 610 [411–770] | 695 [477–847] | 0.14 | 0.032 | 0.25 |
| Iron, mg | 14.3 [9.7–19.4] | 14 [11–20] | 0.56 | 13.7 [10.0–20.8] | 12.4 [8.7–16.4] | 0.12 | 0.864 | 0.06 |
| Zinc, mg | 8 [5–14] | 5.1 [3.6–6.2] | <0.001 | 7.7 [5.1–10.3] | 7.4 [5.6–9.3] | 0.73 | 0.241 | <0.001 |
| Omega‐3 fatty acids, mg | 1.3 [0.8–2.0] | 0.5 [0.3–1.1] | <0.001 | 1.4 [0.7–2.0] | 1.3 [0.8–1.7] | 0.10 | 0.761 | <0.001 |
| MyPlate—graina | 4.9 [3.4–6.5] | 6.0 [4.8–7.6] | 0.01 | 5.2 [3.7–6.0] | 4.7 [3.1–6.0] | 0.20 | 0.71 | <0.001 |
| MyPlate—vegetableb | 1.6 [1.1–2.4] | 2.5 [1.7–4.3] | <0.001a | 2.1 [1.3–3.0] | 2.4 [1.5–3.3] | 0.32 | 0.10 | 0.29 |
| MyPlate—fruitb | 1.3 [0.5–2.4] | 1.7 [0.8–2.8] | 0.07 | 1.3 [0.2–2.1] | 1.5 [0.8–2.0] | 0.13 | 0.67 | 0.22 |
Data are presented as median [interquartile range] and compared within groups using related‐samples Wilcoxon signed‐rank test and between groups using the Mann–Whitney test. Four‐day food record data were used to generate these data. Baseline food record data were missing from 1 participant in the AHA‐recommended diet group. Final food record data at 8 weeks were missing from 2 participants in the vegan diet group.
Ounce equivalent.
Cup equivalent.
Physical activity data over the active study period are shown in Table 3. Overall, measures of physical activity did not differ between diet groups at baseline or at the end of the study period.
Table 3.
Physical Activity Data in Participants With Angiographically Defined Coronary Artery Disease Randomized to the Vegan Versus American Heart Association Recommended Diet for 8 Weeks
| Vegan Diet (n=50) | American Heart Association‐Recommended Diet (n=50) | P Value Between Groups | ||||||
|---|---|---|---|---|---|---|---|---|
| Baseline | 8 Weeks | P Value | Baseline | 8 Weeks | P Value | Baseline | 8 Weeks | |
| Vigorous metabolic equivalents (METs) | 0 [0–1920] | 360 [0–2040] | 0.27 | 0 [0–960] | 120 [0–1440] | 0.03 | 0.27 | 0.54 |
| Moderate METs | 480 [0–1680] | 720 [180–1560] | 0.67 | 110 [0–1440] | 480 [0–1120] | 0.32 | 0.33 | 0.24 |
| Walking METs | 1386 [495–2426] | 1386 [693–2772] | 0.87 | 718 [248–2079] | 743 [594–2376] | 0.08 | 0.07 | 0.21 |
| Total METs | 3612 [1386–7971] | 3947 [2106–5493] | 0.43 | 2120 [668–4512] | 2541 [1040–4434] | 0.03 | 0.05 | 0.10 |
| Moderate+vigorous activity (min) | 240 [0–660] | 360 [105–683] | 0.81 | 143 [0–450] | 210 [0–520] | 0.09 | 0.24 | 0.18 |
Data are presented as median [interquartile range] and compared within groups using related‐samples Wilcoxon signed‐rank test and between groups using Mann–Whitney test and. Physical activity data are shown as time over 7 days. Baseline physical activity data were missing from 2 participants in the vegan diet group and 2 participants in the AHA‐recommended diet group. Final physical activity data at 8 weeks were missing from 4 participants in the vegan diet group.
Dietary adherence
Even with inclusion of the 2 trial withdrawals from the vegan diet group, there was a higher rate of dietary adherence as determined by 24‐hour dietary recall data among participants in the vegan versus AHA diet groups (4‐week interim visit: 96% versus 84%, P=0.09; 8‐week final visit: 94% versus 70%, P=0.003).
End Points
Markers of inflammation
HsCRP concentrations over time with the vegan and AHA diet groups are shown in Table 4. The median change in hsCRP concentration over the study period was significantly lower in the vegan versus AHA diet groups (Figure 2). After adjustment for baseline concentrations, the vegan diet resulted in a significant 32% lower concentration of hsCRP when compared with the AHA diet (β estimate, 0.68 [95% confidence interval, 0.49–0.94], P=0.02) (Table 5). After additional adjustment for age, race, baseline waist circumference, presence of diabetes mellitus, and prior myocardial infarction, there remained a significant 33% lower concentration of hsCRP with the vegan versus AHA diet (adjusted β estimate, 0.67 [0.47–0.94], P=0.02). Measures of white blood cell activity did not differ over time between groups (Table 5).
Table 4.
Markers of Cardiovascular Risk in Participants With Angiographically Defined Coronary Artery Disease Randomized to the Vegan Versus American Heart Association–Recommended Diet for 8 Weeks
| Vegan Diet (n=50) | American Heart Association‐Recommended Diet (n=50) | |||||
|---|---|---|---|---|---|---|
| Baseline | 4 Weeks | 8 Weeks | Baseline | 4 Weeks | 8 Weeks | |
| Primary endpoint | ||||||
| High‐sensitivity C‐reactive protein, mg/L | 1.25 [0.9–2.3] | 1.00 [0.6–2.3] | 1.10 [0.7–2.1] | 1.15 [0.7–2.8] | 1.10 [0.6–3.6] | 1.10 [0.7–2.9] |
| Secondary end points | ||||||
| White blood cell subtypes | ||||||
| White blood cells, K/μL | 6.5 [5.1–7.9] | 6.2 [5.1–7.3] | 5.9 [4.8–7.4] | 5.7 [5.0–7.0] | 5.3 [4.6–6.6] | 5.3 [4.5–6.4] |
| Neutrophil/lymphocyte ratio | 2.5 [1.9–3.5] | 2.6 [2.0–3.4] | 2.6 [1.8–3.3] | 2.1 [1.4–2.8] | 1.8 [1.4–2.6] | 2.0 [1.6–2.6] |
| Monocytes, classical subtype, % | 73 [65–81] | 75 [68–79] | 71 [65–80] | 71 [65–75] | 70 [63–73] | 68 [49–72] |
| Monocytes, intermediate subtype, % | 3.6 [2.1–5.4] | 4.4 [2.4–6.6] | 4.2 [2.1–5.1] | 3.9 [2.4–6.1] | 4.6 [3.1–7.5] | 4.8 [3.0–6.1] |
| Monocytes, nonclassical subtype, % | 9 [7–16] | 10 [7–16] | 11 [5–16] | 14 [9–17] | 14 [11–23] | 15 [12–20] |
| White blood cell cellular adhesion molecules | ||||||
| Neutrophil surface expression ratio of L‐selectin to CD11b, MFI | 1.3 [0.7–2.4] | 0.7 [0.4–1.9] | 1.2 [0.9–2.7] | 1.1 [0.8–2.1] | 0.9 [0.6–1.6] | 1.4 [0.8–1.9] |
| Soluble L‐selectin, ng/mL | 12.7 [8.4–15.3] | 13.4 [9.3–15.6] | 13.7 [101–15.7] | 14.6 [10.2–17.7] | 13.3 [9.8–18.3] | 13.6 [9.4–18.2] |
| Soluble E‐selectin, ng/mL | 37.8 [28.0–71.9] | 37.6 [29.3–68.5] | 37.2 [30.9–47.6] | 50.6 [32.5–89.8] | 46.7 [32.4–70.6] | 42.4 [30.4–68.4] |
| Soluble intercellular adhesion molecule‐1, ng/mL | 225.1 [158.5–366.4] | 224.9 [154.2–308.5] | 229.5 [153.9–343.2] | 235.5 [159.6–357.7] | 230.3 [167.7–307.3] | 251.5 [159.1–372.9] |
| Soluble vascular cell adhesion molecule‐1, ng/mL | 304.7 [250.1–358.2] | 325.2 [249.6–428.3] | 316.9 [257.1–400.2] | 343.1 [247.5–420.6] | 325.1 [247.1–440.4] | 346.2 [244.8–422.7] |
| Other markers of neutrophil activity | ||||||
| Neutrophil gelatinase‐associated lipocalin, ng/mL | 59.8 [51.3–78.0] | 58.9 [49.6–82.6] | 60.9 [49.9–75.4] | 53.8 [40.1–79.0] | 56.7 [42.6–79.8] | 57.0 [42.5–78.3] |
| Myeloperoxidase, pmol/L | 277 [232–330] | 267 [219–322] | 267 [213–351] | 274 [220–368] | 262 [202–357] | 276 [187–343] |
| Other inflammatory marker | ||||||
| Urine F2‐isoprostane/creatinine ratio | 0.36 [0.25–0.52] | 0.41 [0.06–0.52] | 0.35 [0.01–0.54] | 0.21 [0.01–0.40] | 0.21 [0.01–0.36] | 0.20 [0.01–0.35] |
| Anthropometric data | ||||||
| Body mass index, kg/m2 | 30.5 [26.7–34.2] | 29.4 [25.7–32.9] | 29.0 [25.5–32.4] | 30.9 [25.8–33.4] | 29.8 [25.4–32.6] | 29.5 [25.2–32.4] |
| Waist circumference, cm | 107 [96–120] | 103 [95–118] | 102 [94–117] | 107 [98–117] | 106 [98–113] | 105 [97–113] |
| Glycemic markers | ||||||
| Fasting glucose, mg/dL | 101 [92–115] | 97 [93–108] | 97 [91–109] | 103 [94–121] | 102 [94–123] | 100 [95–125] |
| Hemoglobin A1c, % | 5.8 [5.6–6.3] | 5.7 [5.5–6.2] | 5.7 [5.5–6.0] | 6.0 [5.7–6.8] | 5.9 [5.6–6.5] | 5.9 [5.6–6.5] |
| Insulin, μU/mL | 10.9 [8.1–17.4] | 10.3 [7.0–16.4] | 10.5 [6.8–14.6] | 12.0 [5.6–19.7] | 10.0 [5.5–16.3] | 10.2 [5.6–13.8] |
| Lipid profile | ||||||
| Total cholesterol, mg/dL | 136 [120–164] | 121 [111–150] | 127 [116–154] | 146 [123–169] | 138 [119–163] | 142 [124–160] |
| Non‐HDL cholesterol, mg/dL | 95 [74–114] | 81 [66–103] | 89 [71–106] | 97 [79–114] | 95 [78–116] | 91 [82–113] |
| LDL cholesterol (calculated), mg/dL | 73 [54–90] | 58 [47–77] | 63 [50–85] | 75 [60–94] | 71 [55–91] | 73 [60–88] |
| LDL size, nm | 20.6 [20.3–21.1] | 20.5 [20.2–20.9] | 20.5 [20.2–20.9] | 20.6 [20.3–20.8] | 20.5 [20.3–21.0] | 20.6 [20.2–21.0] |
| LDL particle number, nmol/L | 924 [704–1118] | 759 [593–1014] | 840 [656–1045] | 924 [680–1109] | 861 [675–1144] | 842 [764–1110] |
| Small LDL particle number, nmol/L | 444 [276–571] | 421 [318–532] | 469 [385–580] | 400 [264–572] | 398 [295–592] | 396 [321–579] |
| Oxidized LDL, U/L | 34 [25–41] | 30 [25–35] | 31 [26–38] | 36 [28–40] | 33 [27–42] | 33 [28–41] |
| VLDL size, nm | 47 [45–52] | 47 [45–51] | 48 [46–51] | 47 [44–50] | 46 [44–50] | 47 [44–49] |
| Large VLDL‐particle number, nmol/L | 2.6 [1.5–4.3] | 2.6 [1.7–4.1] | 2.5 [1.9–3.7] | 2.3 [1.5–3.5] | 2.3 [1.4–3.3] | 2.2 [1.4–3.5] |
| Triglycerides, mg/dL | 112 [78–126] | 107 [78–126] | 102 [81–132] | 105 [68–142] | 100 [73–138] | 85 [70–134] |
| HDL cholesterol, mg/dL | 45 [38–53] | 44 [35–50] | 43 [40–51] | 45 [35–55] | 39 [35–54] | 43 [36–56] |
| HDL size, nm | 9.0 [8.7–9.4] | 8.9 [8.5–9.3] | 8.9 [8.6–9.3] | 9.0 [8.5–9.5] | 8.8 [8.7–9.4] | 9.0 [8.5–9.6] |
| HDL particle number, μmol/L | 30 [28–33] | 30 [27–33] | 31 [28–34] | 31 [27–37] | 29 [26–33] | 29 [25–34] |
| Large HDL particle number, μmol/L | 4.4 [2.1–6.7] | 3.9 [2.6–5.6] | 4.1 [2.4–5.7] | 3.4 [2.0–6.6] | 3.4 [21–6.2] | 3.8 [1.7–7.2] |
| Quality‐of‐life survey | ||||||
| EuroQol 5 dimensions index | 0.84 [0.80–1.00] | 1.00 [0.83–1.00] | 1.00 [0.83–1.00] | 0.84 [0.81–1.00] | 1.00 [0.83–1.00] | 1.00 [0.83–1.00] |
| Current health state score | 75 [65–82] | 81 [75–90] | 85 [80–90] | 70 [60–80] | 75 [70–85] | 80 [75–85] |
End points are presented as median [interquartile range]. HDL indicates high‐density lipoprotein; LDL, low‐density lipoprotein; VLDL, very low‐density lipoprotein.
Figure 2.
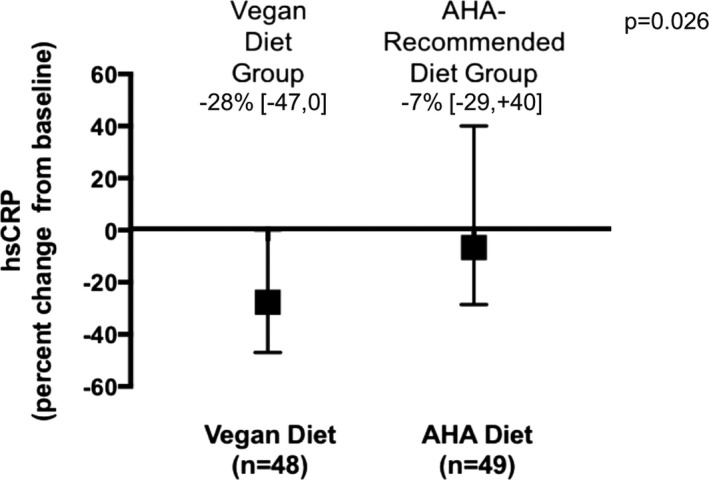
Percent change in hsCRP (high‐sensitivity C‐reactive protein) over the study period in participants with angiographically defined coronary artery disease randomized to the vegan vs American Heart Association (AHA)‐Recommended diet. Data shown as median [interquartile range] and compared between diet groups using the Mann–Whitney test.
Table 5.
Between Group Comparison of Markers of Cardiovascular Risk in Participants With Angiographically Defined Coronary Artery Disease Randomized to the Vegan Versus AHA‐Recommended Diet for 8 Weeks
| Model 1 | Model 2 | |||||
|---|---|---|---|---|---|---|
| β Estimate | 95% Confidence Interval | P Value | β Estimate | 95% Confidence Interval | P Value | |
| AHA‐recommended diet | Reference | ··· | ··· | Reference | ··· | ··· |
| Vegan diet | ||||||
| Primary end point | ||||||
| High‐sensitivity C‐reactive protein, mg/L | 0.68 | 0.49–0.94 | 0.02 | 0.67 | 0.47–0.94 | 0.02 |
| Secondary end points | ||||||
| White blood cell subtypes | ||||||
| White blood cells, K/μL | 1.04 | 0.92–1.16 | 0.55 | 1.06 | 0.93–1.20 | 0.37 |
| Neutrophil/lymphocyte ratio | 1.15 | 0.94–1.41 | 0.16 | 1.20 | 0.96–1.49 | 0.10 |
| Monocytes, classical subtype, % | 1.25 | 1.07–1.45 | 0.005 | 1.09 | 1.04–1.45 | 0.02 |
| Monocytes, intermediate subtype, % | 0.65 | 0.44–0.95 | 0.03 | 0.69 | 0.46–1.05 | 0.08 |
| Monocytes, nonclassical subtype, % | 0.54 | 0.36–0.81 | 0.003 | 0.56 | 0.37–0.85 | 0.008 |
| White blood cell cellular adhesion molecules | ||||||
| Neutrophil surface expression ratio of L‐selectin to CD11b, MFI | 1.75 | 0.44–6.95 | 0.42 | 3.05 | 0.77–12.00 | 0.11 |
| Soluble L‐selectin, ng/mL | 1.05 | 0.93–1.18 | 0.46 | 1.04 | 0.92–1.18 | 0.55 |
| Soluble E‐selectin, ng/mL | 0.79 | 0.58–1.07 | 0.12 | 0.84 | 0.60–1.17 | 0.30 |
| Soluble intercellular adhesion molecule‐1, ng/mL | 1.03 | 0.71–1.50 | 0.86 | 1.11 | 0.75–1.64 | 0.62 |
| Soluble vascular cell adhesion molecule‐1, ng/mL | 1.07 | 0.97–1.19 | 0.18 | 1.09 | 0.97–1.22 | 0.13 |
| Other markers of neutrophil activity | ||||||
| Neutrophil gelatinase‐associated lipocalin, ng/mL | 0.99 | 0.88–1.12 | 0.87 | 1.03 | 0.91–1.18 | 0.61 |
| Myeloperoxidase, pmol/L | 1.04 | 0.92–1.18 | 0.53 | 1.03 | 0.90–1.17 | 0.68 |
| Other inflammatory marker | ||||||
| Urine F2‐isoprostane/creatinine ratio | 1.17 | 0.64–2.15 | 0.61 | 1.30 | 0.68–2.48 | 0.43 |
| Anthropometric data | ||||||
| Body mass index, kg/m2 | 0.99 | 0.98–1.00 | 0.07 | 0.99 | 0.97–1.00 | 0.10 |
| Waist circumference, cm | 1.00 | 0.98–1.01 | 0.73 | 1.00 | 0.98–1.01 | 0.66 |
| Glycemic markers | ||||||
| Fasting glucose, mg/dL | 0.92 | 0.85–1.00 | 0.06 | 0.93 | 0.86–1.01 | 0.10 |
| Hemoglobin A1c, % | 0.99 | 0.97–1.01 | 0.36 | 1.00 | 0.98–1.02 | 0.91 |
| Insulin, μU/mL | 1.04 | 0.86–1.26 | 0.70 | 1.04 | 0.85–1.26 | 0.72 |
| Lipid profile | ||||||
| Total cholesterol, mg/dL | 0.95 | 0.89–1.01 | 0.08 | 0.94 | 0.88–1.01 | 0.09 |
| Non‐HDL cholesterol, mg/dL | 0.92 | 0.84–1.00 | 0.05 | 0.92 | 0.84–1.01 | 0.08 |
| LDL cholesterol (calculated), mg/dL | 0.88 | 0.80–0.96 | 0.008 | 0.87 | 0.78–0.97 | 0.01 |
| LDL size, nm | 1.00 | 0.99–1.00 | 0.40 | 1.00 | 0.99–1.00 | 0.32 |
| LDL particle number, nmol/L | 0.91 | 0.82–1.02 | 0.10 | 0.91 | 0.81–1.03 | 0.13 |
| Small LDL particle number, nmol/L | 1.17 | 0.96–1.42 | 0.12 | 1.20 | 0.97–1.47 | 0.09 |
| Oxidized LDL, U/L | 0.92 | 0.82–1.03 | 0.13 | 0.93 | 0.83–1.05 | 0.24 |
| VLDL size, nm | 1.03 | 0.99–1.07 | 0.21 | 1.02 | 0.98–1.07 | 0.29 |
| Large VLDL particle number, nmol/L | 1.15 | 0.92–1.43 | 0.22 | 1.15 | 0.91–1.46 | 0.23 |
| Triglycerides, mg/dL | 1.06 | 0.94–1.21 | 0.35 | 1.06 | 0.93–1.22 | 0.38 |
| HDL‐cholesterol, mg/dL | 1.02 | 0.97–1.08 | 0.42 | 1.02 | 0.96–1.08 | 0.47 |
| HDL size, nm | 0.99 | 0.96–1.01 | 0.23 | 0.99 | 0.96–1.01 | 0.32 |
| HDL particle number, μmol/L | 1.07 | 1.02–1.13 | 0.01 | 1.07 | 1.02–1.13 | 0.01 |
| Large HDL particle number, μmol/L | 1.00 | 0.85–1.18 | 0.98 | 0.98 | 0.83–1.16 | 0.82 |
| Quality‐of‐life survey | ||||||
| EuroQol 5 dimensions index | 1.00 | 0.96–1.04 | 0.96 | 1.00 | 0.96–1.05 | 0.13 |
| Current health state score | 1.00 | 0.94–1.07 | 0.95 | 1.01 | 0.94–1.08 | 0.22 |
End points after 8 weeks of dietary intervention were assessed in the vegan diet group with AHA‐recommended diet group as the reference using a linear regression model. Model 1: adjusted for the baseline concentration of the end point. Model 2: adjusted for the baseline concentration of the end point, age, race, baseline waist circumference, diabetes mellitus, and prior myocardial infarction. Significance for primary end point is set at an alpha level of 0.05 and for the secondary end points at an alpha level of 0.0015 after Bonferroni correction. AHA indicates American Heart Association; HDL, high‐density lipoprotein; LDL, low‐density lipoprotein; VLDL, very low‐density lipoprotein.
Anthropometric data, glycemic markers, and lipid profiles
Although weight loss, as measured by body mass index and waist circumference, was observed in both diet groups (Table 4), the degree of these reductions did not significantly differ between diet groups (Table 5). Furthermore, there were no significant differences in fasting glucose, hemoglobin A1c, or insulin concentrations between diet groups (Table 5).
After adjustment for baseline concentration, the vegan diet resulted in a nonsignificant 12% reduction in LDL cholesterol compared with the AHA diet (β estimate, 0.88 [0.80–0.96], P=0.008) (Table 5). After additional adjustment for age, race, baseline waist circumference, presence of diabetes mellitus, and prior myocardial infarction, there remained a nonsignificant 13% reduction in LDL cholesterol with the vegan versus AHA diet (adjusted β estimate, 0.87 [0.78–0.97], P=0.01). Other lipid parameters did not significantly differ over time between diet groups (Table 5).
Quality of life
Quality of life as measured by the EuroQol 5 dimensions index increased over time in both groups (Table 4). However, these increases were not significantly different between the vegan and AHA diet groups (EuroQol 5 dimensions index adjusted β estimate, 1.00 [0.96–1.05], P=0.13; current health state score adjusted β estimate, 1.01 [0.94–1.08], P=0.22) (Table 5).
Endothelial function
Endothelial function, as assessed by the EndoPat device, was available in 80% (n=40) of participants in the vegan diet group and 74% (n=37) of participants in the AHA group at both baseline and 8‐week final visits. There was no significant change in endothelial function over time (vegan diet: baseline 1.96 [1.62–2.70] to 8‐week final 1.88 [1.61–2.61], P=0.86; AHA diet: baseline 2.12 [1.85–2.48] to 8‐week final 1.84 [1.68–2.13], P=0.12). When abnormal endothelial function was defined as an EndoPat score <1.67, no significant change in status of endothelial function (abnormal versus normal) was noted in 75% of vegan and 84% of AHA diet participants (P=0.41); a change was noted to go from normal to abnormal in 10% of vegan and 14% of AHA diet participants (P=0.73); and a change was noted to go from abnormal to normal in 15% of vegan and 3% of AHA diet participants (P=0.11).
Clinical events
No participants had a myocardial infarction, underwent a repeat coronary revascularization, or died during the 8‐week study period. No participants had a cerebrovascular event in the vegan diet group; 2 participants in the AHA diet group had a probable transient ischemic attack as determined by a clinical neurologist consultant.
Discussion
This randomized, open‐label, blinded end‐point trial demonstrated a significantly greater reduction in hsCRP with a vegan versus AHA‐recommended diet in patients with established CAD on guideline‐directed medical therapy. The degree of weight loss, as measured by both body mass index and waist circumference, did not significantly differ between the 2 diet groups. Markers of glycemic control and lipid profiles, overall, also did not significantly differ in the vegan diet group when compared with the AHA‐recommended diet group.
Strengths of the current study include the use of the AHA‐recommended diet as the comparator arm and the use of similar dietary counseling strategies and pharmacologic interventions in both arms with a focus on the only difference being consumption of plant‐based versus animal‐based protein.27 Earlier studies evaluated the effects of a vegan diet versus a control group that consisted of no intervention.23, 24, 25, 26 One study randomized 46 patients with established or likely CAD to either a 1‐month program of vegan diet with prepared meals and stress management or no intervention.23 This study demonstrated an increase in exercise duration and a decrease in plasma cholesterol concentrations with the vegan diet. The 48 patients with angiographically documented CAD randomized to a low‐fat vegetarian diet in the Lifestyle Heart Trial demonstrated regression of atherosclerosis burden over 1 year, while the no‐intervention group demonstrated progression of disease over the study period.25 Of note, none of these patients were on lipid‐lowering medications during the study period. A more recent single‐arm prospective cohort study evaluated the effects of the MultiSite Cardiac Lifestyle Intervention Program, which consisted of a low‐fat, whole‐foods, plant‐based diet; exercise; stress management; and group support meetings, in 56 patients with established or likely CAD and 75 patients with at least 3 cardiac risk factors or diabetes mellitus.26 This intervention demonstrated significant decreases in multiple indices, including C‐reactive protein concentrations, body mass index, waist/hip ratio, insulin concentrations, and lipid profiles over the 3 months of the study.
An additional strength of the current study is that the changes in end points noted were in participants with established CAD already on guideline‐directed medical therapy. Although only 35% of participants in the current study had hsCRP concentrations ≥2.0 mg/L at baseline, >90% of participants had prior coronary revascularization, >60% of participants had a prior myocardial infarction, and <5% of participants had nonobstructive CAD on invasive angiography. Despite significant reductions in major adverse cardiovascular outcomes with lipid‐lowering statin therapy in patients with CAD,31, 32 there remains a residual risk of adverse outcomes in this patient population. In the Further Cardiovascular Outcomes Research with PCSK9 Inhibition in Subjects with Elevated Risk study, there remained a 9.8% rate of major adverse cardiovascular events in the PCSK9 (proprotein convertase subtilisin/kexin type 9) inhibitor therapy group where the median LDL cholesterol was decreased to 30 mg/dL.33 Anti‐inflammatory strategies, on the other hand, provide incremental benefit on clinical outcomes. The recently published CANTOS (Canakinumab Antiinflammatory Thrombosis Outcome Study) demonstrated significant reductions in major adverse cardiovascular events with a monoclonal antibody to interleukin‐1β in patients with prior myocardial infarction and elevated baseline hsCRP concentrations.8 This reduction in outcomes was noted on a background of optimal medical therapy independent of lipid profiles. Notably, there was a heterogeneity of treatment effect among CANTOS participants, who achieved an hsCRP <2 mg/dL compared with ≥2 mg/dL. Although the current study was not powered for clinical outcomes, it is possible that decrease in hsCRP with the vegan diet may provide added secondary cardiovascular prevention benefit when compared with the AHA‐recommended diet.
The observed reductions in hsCRP and LDL cholesterol concentrations with the vegan diet may be independent or interdependent. The decrease in LDL cholesterol in the vegan group did not meet statistical significance, and there was no significant difference in oxidized LDL concentrations over time in either group or between groups. If the anti‐inflammatory effect of the vegan diet is independent of its lipid‐lowering effects, the underlying mechanism remains unclear. Subtypes of inflammatory cells nor the cellular adhesion molecules that play a significant role in adhesion of inflammatory cells to injured or inflamed endothelium did not differ over time between the 2 diet interventions. However, a significantly higher amount of dietary fiber was observed in the vegan arm of the current study, and studies have shown that a diet high in fiber and low in fat is associated with less inflammation and lower incidence of major cardiovascular outcomes.34, 35, 36 While the anti‐inflammatory effect of fiber is well established, the underlying mechanism remains unclear. Data suggest increased fiber intake may restore gut microbiota, which may, in turn, improve the inflammatory profile.34
Other dietary components such as carbohydrate intake may provide important context for the findings in the current study. A recent interim analysis from the international PURE (Prospective Urban Rural Epidemiology) study, a prospective observational cohort study, which did not include the United States, evaluated 135 335 participants and demonstrated a greater likelihood of all‐cause mortality in participants who ate the most carbohydrates (average 77% of energy intake) versus those who ate the least (average 46% of energy intake).37 In the current study, although there was a significantly higher carbohydrate intake in the vegan group, the median proportion of carbohydrate intake was 57% of the energy intake, much lower than the group at risk in the PURE analysis. Nonetheless, patients on a vegan diet should be encouraged to monitor their carbohydrate intake. In the PURE study, participants who ate the most total fat (average 35% of energy intake) compared with those who ate the least (average 11% of energy intake) had a lower likelihood of all‐cause mortality. These results were consistent across the different types of fats. In the current study, there were no significant differences in the reported intake of total fat as a proportion of total energy intake between the 2 diet groups (30%). However, the intake of saturated fat was significantly lower in the vegan group, which may explain the numerical improvement in LDL‐cholesterol concentration in that group.
There are several limitations to the current study. First, the study cohort reflects 14% of the patients who met initial inclusion/exclusion criteria, so generalizability may be limited. Second, the study is not powered to assess for differences in major adverse cardiovascular and cerebrovascular event. However, lowering hsCRP has been shown to be associated with lower outcomes in patients with prior myocardial infarction, and study participants will be followed for 5 years during which clinical event data are captured.7 Third, the vegan diet was only compared with 1 other diet—the AHA‐recommended diet. The study did not include additional comparator arms, such as the Mediterranean Diet. However, both groups were counseled to incorporate protein from plant‐based sources, including nuts and nut butters, and encouraged to use unsaturated oils, including olive oil.20 Furthermore, olive oil was used as an ingredient for food preparation in recipes provided to both groups. Fourth, participants may have underreported their intake on the food records. Fifth, in the context of the dietary adherence protocol used, an AHA group participant who consumed no animal protein or no dairy would be considered adherent to the AHA‐recommended diet. However, such a participant would favor the null hypothesis. Finally, the exact mechanism of potential underlying benefit remains incompletely elucidated given the lack of change in the white blood cell–related markers. Nonetheless, this is the first randomized trial to evaluate the effects of a vegan diet compared with one of the more commonly referenced dietary recommendations in the United States on multiple parameters of inflammation, glucometabolic, and lipid profiles in patients with established CAD on guideline‐directed medical therapy.
In conclusion, in patients with CAD and an elevated hsCRP despite guideline‐directed medical therapy, a vegan diet may be considered to further lower this marker of adverse outcomes. The vegan diet does not appear to provide significant added benefit when compared with the AHA‐recommended diet in terms of weight loss, glycemic control, or lipid profile improvement.
Sources of Funding
The Purjes Foundation (Salt Lake City, UT) was the primary sponsor of the trial and did not contribute to the study design or data analysis. Dr Shah was supported in part by the National Center for Advancing Translational Sciences (NYU CTSA UL1TR000038) and New York State (Empire Clinical Research Investigator Program) in 2015 and the Biomedical Laboratory Research & Development Service of the VA Office of Research and Development (iK2CX001074) in 2016 and 2017. Dr Newman was partially funded by the National Heart, Lung, and Blood Institute of the National Institute of Health (K23HL125991) and the American Heart Association Mentored Clinical and Population Research Award (15MCPRP24480132). The New York University Langone Laura and Isaac Perlmutter Cancer Center support grant (P30CA016087) partially funds the New York University Langone Precision Immunology Laboratory where soluble white blood cell cellular adhesion molecules and other soluble markers of neutrophil activity were measured using Luminex technology. Statistical support was provided in part by the New York University School of Medicine Cardiovascular Outcomes Group.
Disclosures
None.
Acknowledgments
We would like to acknowledge the contributions of Bryan Velez de Villa, BS; Francisco Ujueta, MD; Erini Farid, BS; Christine A. Berthoumieux, BA; Elissa Driggin, MD; Melissa Goldman, MA; Tamsin Shephard, BS; Abigail Taft, BA; Michael Gleeson, MD; Emmanual Budis; and Thomas Sanchez to the data collection and electronic entry for this study.
(J Am Heart Assoc. 2018;7:e011367 DOI: 10.1161/JAHA.118.011367)
References
- 1. Zhang R, Brennan ML, Fu X, Aviles RJ, Pearce GL, Penn MS, Topol EJ, Sprecher DL, Hazen SL. Association between myeloperoxidase levels and risk of coronary artery disease. JAMA. 2001;286:2136–2142. [DOI] [PubMed] [Google Scholar]
- 2. Horne BD, Anderson JL, John JM, Weaver A, Bair TL, Jensen KR, Renlund DG, Muhlestein JB; Intermountain Heart Collaborative Study Group . Which white blood cell subtypes predict increased cardiovascular risk? J Am Coll Cardiol. 2005;45:1638–1643. [DOI] [PubMed] [Google Scholar]
- 3. Tzoulaki I, Murray GD, Lee AJ, Rumley A, Lowe GD, Fowkes FG. Relative value of inflammatory, hemostatic and rheological factors for incident MI and stroke. Circulation. 2007;115:2119–2127. [DOI] [PubMed] [Google Scholar]
- 4. Kwaijtaal M, van Diest R, Bar FW, van der Ven AJ, Bruggeman CA, de Baets MH, Appels A. Inflammatory markers predict late cardiac events in patients who are exhausted after percutaneous coronary intervention. Atherosclerosis. 2005;182:341–348. [DOI] [PubMed] [Google Scholar]
- 5. Buffon A, Liuzzo G, Biascucci LM, Pasqualetti P, Ramazzotti V, Rebuzzi AG, Crea F, Maseri A. Preprocedural serum levels of C‐reactive protein predict early complications and late restenosis after coronary angioplasty. J Am Coll Cardiol. 1999;34:1512–1521. [DOI] [PubMed] [Google Scholar]
- 6. Walter DH, Fichtlscherer S, Sellwig M, Auch‐Schwelk W, Schachinger V, Zeiher AM. Preprocedural C‐reactive protein and cardiovascular events after coronary stent implantation. J Am Coll Cardiol. 2001;37:839–846. [DOI] [PubMed] [Google Scholar]
- 7. Ridker PM, MacFadyen JG, Everett BM, Libby P, Thuren T, Glynn RJ; CANTOS Trial Group . Relationship of C‐reactive protein reduction to cardiovascular event reduction following treatment with canakinumab: a secondary analysis from the CANTOS randomized controlled trial. N Engl J Med. 2008;359:2195–2207. [DOI] [PubMed] [Google Scholar]
- 8. Ridker PM, Everett BM, Thuren T, MacFadyen JG, Chang WH, Ballantyne C, Fonseca F, Nicolau J, Koenig W, Anker SD, Kastelein JJP, Cornel JH, Pais P, Pella D, Genest J, Cifkova R, Lorenzatti A, Forster T, Kobalava Z, Vida‐Simiti L, Flather M, Shimokawa H, Ogawa H, Dellborg M, Rossi PRF, Troquay RPT, Libby P, Glynn RJ; CANTOS Trial Group . Antiinflammatory therapy with canakinumab for atherosclerotic disease. N Engl J Med. 2017;377:1119–1131. [DOI] [PubMed] [Google Scholar]
- 9. Nidorf SM, Eikelboom JW, Budgeon CA, Thompson PL. Low‐dose colchicine for secondary prevention of cardiovascular disease. J Am Coll Cardiol. 2013;61:404–410. [DOI] [PubMed] [Google Scholar]
- 10. Selvin E, Steffes MW, Zhu H, Matsushita K, Wagenknecht L, Pankow J, Coresh J, Brancati FL. Glycated hemoglobin, diabetes, and cardiovascular risk in nondiabetic adults. N Engl J Med. 2010;362:800–811. [DOI] [PMC free article] [PubMed] [Google Scholar]
- 11. Khaw KT, Wareham N, Luben R, Bingham S, Oakes S, Welch A, Day N. Glycated haemoglobin, diabetes, and mortality in men in Norfolk cohort of European Prospective Investigation of Cancer and Nutrition (EPIC‐Norfolk). BMJ. 2001;322:15–18. [DOI] [PMC free article] [PubMed] [Google Scholar]
- 12. Suleiman M, Hammerman H, Boulos M, Kapeliovich MR, Suleiman A, Agmon Y, Markiewicz W, Aronson D. Fasting glucose is an important independent risk factor for 30‐day mortality in patients with acute myocardial infarction. Circulation. 2005;111:754–760. [DOI] [PubMed] [Google Scholar]
- 13. Shah B, Liou M, Grossi E, Mass H, Lorin JD, Danoff A, Sedlis SP. Relation of elevated periprocedural blood glucose to long‐term survival after percutaneous coronary intervention. Am J Cardiol. 2005;96:543–546. [DOI] [PubMed] [Google Scholar]
- 14. Prior JO, Quiñones MJ, Hernandez‐Pampaloni M, Facta AD, Schindler TH, Sayre JW, Hsueh WA, Schelbert HR. Coronary circulatory dysfunction in insulin resistance, impaired glucose tolerance, and type 2 diabetes mellitus. Circulation. 2005;111:2291–2298. [DOI] [PubMed] [Google Scholar]
- 15. Ford ES, Zhao G, Li C. Pre‐diabetes and the risk for cardiovascular disease: a systematic review of the evidence. J Am Coll Cardiol. 2010;55:1310–1317. [DOI] [PubMed] [Google Scholar]
- 16. Wilson PW, D'Agostino RB, Parise H, Sullivan L, Meigs JB. Metabolic syndrome as a precursor of cardiovascular disease and type 2 diabetes mellitus. Circulation. 2005;112:3066–3072. [DOI] [PubMed] [Google Scholar]
- 17. Stern MP, Williams K, González‐Villalpando C, Hunt KJ, Haffner SM. Does the metabolic syndrome improve identification of individuals at risk of type 2 diabetes and/or cardiovascular disease? Diabetes Care. 2004;27:2676–2681. [DOI] [PubMed] [Google Scholar]
- 18. Mottillo S, Filion KB, Genest J, Joseph L, Pilote L, Poirier P, Rinfret S, Schiffrin EL, Eisenberg MJ. The metabolic syndrome and cardiovascular risk a systematic review and meta‐analysis. J Am Coll Cardiol. 2010;56:1113–1132. [DOI] [PubMed] [Google Scholar]
- 19. Eckel RH, Jakicic JM, Ard JD, de Jesus JM, Houston Miller N, Hubbard VS, Lee IM, Lichtenstein AH, Loria CM, Millen BE, Nonas CA, Sacks FM, Smith SC Jr, Svetkey LP, Wadden TA, Yanovski SZ. 2013 AHA/ACC guideline on lifestyle management to reduce cardiovascular risk: a report of the American College of Cardiology/American Heart Association Task Force on Practice Guidelines. Circulation. 2014;129:S76–S99. [DOI] [PubMed] [Google Scholar]
- 20. Estruch R, Ros E, Salas‐Salvadó J, Covas MI, Corella D, Arós F, Gómez‐Gracia E, Ruiz‐Gutiérrez V, Fiol M, Lapetra J, Lamuela‐Raventos RM, Serra‐Majem L, Pintó X, Basora J, Muñoz MA, Sorlí JV, Martínez JA, Fitó M, Gea A, Hernán MA, Martínez‐González MA; PREDIMED Study Investigators . Primary prevention of cardiovascular disease with a Mediterranean diet. N Engl J Med. 2013;368:1279–1290. [DOI] [PubMed] [Google Scholar]
- 21. Appel LJ, Moore TJ, Obarzanek E, Vollmer WM, Svetkey LP, Sacks FM, Bray GA, Vogt TM, Cutler JA, Windhauser MM, Lin PH, Karanja N. A clinical trial of the effects of dietary patterns on blood pressure. DASH Collaborative Research Group. N Engl J Med. 1997;336:1117–1124. [DOI] [PubMed] [Google Scholar]
- 22. Appel LJ, Sacks FM, Carey VJ, Obarzanek E, Swain JF, Miller ER III, Conlin PR, Erlinger TP, Rosner BA, Laranjo NM, Charleston J, McCarron P, Bishop LM; OmniHeart Collaborative Research Group . Effects of protein, monounsaturated fat, and carbohydrate intake on blood pressure and serum lipids: results of the OmniHeart randomized trial. JAMA. 2005;294:2455–2464. [DOI] [PubMed] [Google Scholar]
- 23. Ornish D, Scherwitz LW, Doody RS, Kesten D, McLanahan SM, Brown SE, DePuey E, Sonnemaker R, Haynes C, Lester J, McAllister GK, Hall RJ, Burdine JA, Gotto AM Jr. Effects of stress management training and dietary changes in treating ischemic heart disease. JAMA. 1983;249:54–59. [PubMed] [Google Scholar]
- 24. Ornish D, Brown SE, Scherwitz LW, Billings JH, Armstrong WT, Ports TA, McLanahan SM, Kirkeeide RL, Brand RJ, Gould KL. Can lifestyle changes reverse coronary heart disease? The Lifestyle Heart Trial. Lancet. 1990;336:129–133. [DOI] [PubMed] [Google Scholar]
- 25. Dod HS, Bhardwaj R, Sajja V, Weidner G, Hobbs GR, Konat GW, Manivannan S, Gharib W, Warden BE, Nanda NC, Beto RJ, Ornish D, Jain AC. Effect of intensive lifestyle changes on endothelial function and on inflammatory markers of atherosclerosis. Am J Cardiol. 2010;105:362–367. [DOI] [PubMed] [Google Scholar]
- 26. Chainani‐Wu N, Weidner G, Purnell DM, Frenda S, Merritt‐Worden T, Pischke C, Campo R, Kemp C, Kersh ES, Ornish D. Changes in emerging cardiac biomarkers after an intensive lifestyle intervention. Am J Cardiol. 2011;108:498–507. [DOI] [PubMed] [Google Scholar]
- 27. Shah B, Ganguzza L, Slater J, Newman JD, Allen N, Fisher E, Larigakis J, Ujueta F, Gianos E, Guo Y, Woolf K. The effect of a Vegan versus AHA DiEt in Coronary Artery Disease (EVADE CAD) trial: study design and rationale. Contemp Clin Trials Commun. 2017;8:90–98. [DOI] [PMC free article] [PubMed] [Google Scholar]
- 28. Levesque CS, Williams GC, Elliot D, Pickering MA, Bodenhamer B, Finley PJ. Validating the theoretical structure of the Treatment Self‐Regulation Questionnaire (TSRQ) across three different health behaviors. Health Educ Res. 2007;22:691–702. [DOI] [PubMed] [Google Scholar]
- 29. Hansson L, Hedner T, Dahlöf B. Prospective randomized open blinded end‐point (PROBE) study. A novel design for intervention trials. Prospective Randomized Open Blinded End‐Point. Blood Press. 1992;1:113–119. [DOI] [PubMed] [Google Scholar]
- 30. Craig CL, Marshall AL, Sjöström M, Bauman AE, Booth ML, Ainsworth BE, Pratt M, Ekelund U, Yngve A, Sallis JF, Oja P. International physical activity questionnaire: 12‐country reliability and validity. Med Sci Sports Exerc. 2003;35:1381–1395. [DOI] [PubMed] [Google Scholar]
- 31. Scandinavian Simvastatin Survival Study Group . Randomised trial of cholesterol lowering in 4444 patients with coronary heart disease: the Scandinavian Simvastatin Survival Study (4S). Lancet. 1994;344:1383–1389. [PubMed] [Google Scholar]
- 32. Cannon CP, Braunwald E, McCabe CH, Rader DJ, Rouleau JL, Belder R, Joyal SV, Hill KA, Pfeffer MA, Skene AM; Pravastatin or Atorvastatin Evaluation and Infection Therapy‐Thrombolysis in Myocardial Infarction 22 Investigators . Intensive versus moderate lipid lowering with statins after acute coronary syndromes. N Engl J Med. 2004;350:1495–1504. [DOI] [PubMed] [Google Scholar]
- 33. Sabatine MS, Giugliano RP, Keech AC, Honarpour N, Wiviott SD, Murphy SA, Kuder JF, Wang H, Liu T, Wasserman SM, Sever PS, Pedersen TR; FOURIER Steering Committee and Investigators . Evolocumab and clinical outcomes in patients with cardiovascular disease. N Engl J Med. 2017;376:1713–1722. [DOI] [PubMed] [Google Scholar]
- 34. Zou J, Chassaing B, Singh V, Pellizzon M, Ricci M, Fythe MD, Kumar MV, Gewirtz AT. Fiber‐mediated nourishment of gut microbiota protects against diet‐induced obesity by restoring IL‐22‐mediated colonic health. Cell Host Microbe. 2018;23:41–53.e4. [DOI] [PMC free article] [PubMed] [Google Scholar]
- 35. King DE, Egan BM, Geesey ME. Relation of dietary fat and fiber to elevation of C‐reactive protein. Am J Cardiol. 2003;92:1335–1339. [DOI] [PubMed] [Google Scholar]
- 36. Wolk A, Manson JE, Stampfer MJ, olditz GA, Hu FB, Speizer FE, Hennekens CH, Willett WC. Long‐term intake of dietary fiber and decreased risk of coronary heart disease among women. JAMA. 1999;281:1998–2004. [DOI] [PubMed] [Google Scholar]
- 37. Dehghan M, Mente A, Zhang X, Swaminathan S, Li W, Mohan V, Iqbal R, Kumar R, Wentzel‐Viljoen E, Rosengren A, Amma LI, Avezum A, Chifamba J, Diaz R, Khatib R, Lear S, Lopez‐Jaramillo P, Liu X, Gupta R, Mohammadifard N, Gao N, Oguz A, Ramli AS, Seron P, Sun Y, Szuba A, Tsolekile L, Wielgosz A, Yusuf R, Hussein Yusufali A, Teo KK, Rangarajan S, Dagenais G, Bangdiwala SI, Islam S, Anand SS, Yusuf S; Prospective Urban Rural Epidemiology (PURE) study investigators . Associations of fats and carbohydrate intake with cardiovascular disease and mortality in 18 countries from five continents (PURE): a prospective cohort study. Lancet. 2017;390:2050–2062. [DOI] [PubMed] [Google Scholar]