

Abstract
Background
The role of adipokine dysregulation in determining the metabolic fate of obesity is not well studied. We aimed to examine whether the matricellular protein osteonectin and the profiles of certain adipokines could differentiate metabolically healthy obese (MHO) versus metabolically unhealthy obese phenotypes in childhood.
Methods and Results
This study included 1137 obese children and 982 normal‐weight healthy (NWH) controls recruited from the BCAMS (Beijing Child and Adolescent Metabolic Syndrome) study. MHO was defined by the absence of insulin resistance and/or any metabolic syndrome components. Six adipokines—osteonectin, leptin, adiponectin, resistin, FGF21 (fibroblast growth factor 21), and RBP‐4 (retinol binding protein 4)—were assessed. Approximately 20% of obese children displayed the MHO phenotype. MHO children had a more favorable adipokine profile than metabolically unhealthy obese children, with lower osteonectin, leptin, and RBP‐4 and higher adiponectin (all P<0.05). Compared with normal‐weight healthy controls, MHO children displayed increased leptin, resistin, and RBP‐4 levels and reduced adiponectin concentrations (all P<0.05) but similar osteonectin and FGF21 levels. Among obese subjects, decreased osteonectin (odds ratio [OR]: 0.82; 95% confidence interval [CI] per standard deviation, 0.70–0.97), RBP‐4 (OR: 0.77; 95% CI per standard deviation, 0.64–0.93), and leptin/adiponectin ratio (OR: 0.58; 95% CI per standard deviation, 0.43–0.77) were independent predictors of MHO. In addition, compared with children without abnormalities, those with any 3 adipokine abnormalities were 80% less likely to exhibit the MHO phenotype (OR: 0.20; 95% CI, 0.10–0.43) and 3 times more likely to have metabolic syndrome (OR: 2.77; 95% CI, 1.52–5.03).
Conclusions
These findings suggest that dysregulation of adipokines might govern the metabolic consequences of obesity in children. Low osteonectin levels, along with a healthy adipokine profile, might be used as an early marker of the MHO phenotype.
Keywords: adipokine, children, metabolic syndrome, metabolism, obesity, osteonectin
Subject Categories: Obesity, Pediatrics, Vascular Disease, Biomarkers
Clinical Perspective
What Is New?
Serum levels of osteonectin, a matricellular protein recently identified as an adipokine, clearly distinguish metabolically healthy obese (MHO) individuals from their metabolically unhealthy obese counterparts and are comparable in MHO and normal‐weight healthy people.
The MHO (versus metabolically unhealthy obese) phenotype in children was also characterized by more favorable profiles of several other adipokines (leptin, adiponectin, and RBP‐4 [retinol binding protein 4]) in this study.
In this large study of Chinese youth, abnormal adipokine levels were associated with increased risk of the metabolic syndrome and reduced likelihood of exhibiting the MHO phenotype.
What Are the Clinical Implications?
Osteonectin, combined with other adipokines, may be useful in distinguishing between the MHO and metabolically unhealthy obese phenotypes during childhood.
Dysregulation of adipokines, including the matricellular protein osteonectin, may govern the metabolic consequences of obesity and provide novel therapeutic targets to combat its deleterious effects.
Introduction
The rapid increase in the prevalence and severity of obesity in children and adolescents is likely to increase the incidence of metabolic syndrome (MS) and lower the age of onset of cardiovascular disease (CVD) worldwide.1 However, the presence of these metabolic disturbances varies widely among obese subjects. A unique group of obese people who exhibit better insulin sensitivity than expected for their level of adiposity, labeled as insulin‐sensitive obese or metabolically healthy obese (MHO), display a less deleterious metabolic profile.2, 3, 4 Several studies have suggested that MHO individuals are more resistant to the development of diabetes mellitus and CVD than metabolically unhealthy obese (MUO) individuals.5, 6, 7, 8, 9 However, several recent large studies in adult populations have called into question the existence of an MHO versus MUO phenotype.10, 11, 12, 13, 14, 15, 16
To date, the preponderance of studies examining the existance of obesity phenotypes have focused on adults, with limited investigation into the MHO phenotype in childhood. Because childhood obesity and its metabolic consequences may track into adulthood, leading to increased CVD risk,17 investigating metabolic health and adiposity in childhood may have widespread implications. Better understanding of childhood obesity may uncover novel targets for prevention of insulin resistance and metabolic disorders in children and guide therapeutic decision‐making and the allocation of limited medical resources.18
The potential mechanisms that may underlie the differing metabolic profiles in MHO versus MUO individuals are still poorly understood. However, preliminary evidence suggests that adipose tissue itself might be a vital determining factor in the metabolic fate of obesity.3, 4 Adipose tissue is now recognized as an important endocrine organ that secretes a variety of bioactive proteins (adipokines), which can greatly influence a host of metabolic effects, insulin resistance, systemic inflammation, and abnormal cardiovascular function.19 Several adipokines such as leptin,20 adiponectin,20 resistin,21 RBP‐4 (retinol binding protein 4),22 and FGF21 (fibroblast growth factor 21)23 are being considered as potential novel biomarkers for insulin resistance and CVD risk, and an imbalance in the production of these pro‐ and anti‐inflammatory adipokines in the obese condition may result in multiple complications.1 Although the number of studies assessing adipokine profiles in the MHO phenotype is still limited, the observed associations between adiponectin,24 leptin/adiponectin ratio,25 resistin,26 RBP‐4,27 and FGF2128 and the MHO phenotype provide evidence that differing adipokine profiles might contribute to the dissociation of the MHO and MUO phenotypes.3 However, systematic studies of these obesity phenotypes and their accompanying adipokine profiles are still lacking in the pediatric and young adult populations.
Another novel adipokine, osteonectin—alternatively named SPARC (secreted protein acidic and rich in cysteine)—has been recognized recently as a key component in the deleterious effects of obesity, insulin resistance, and diabetes mellitus.29 Osteonectin was known to be a regulator of the extracellular matrix linked to adipose tissue fibrosis. Based on the concept that adipose tissue's capacity for expansion under caloric excess is essential for obese individuals to maintain metabolic health, we hypothesized that lower osteonectin levels might be a novel biomarker for the MHO phenotype. Using a large representative sample of Chinese children and adolescents from the BCAMS (Beijing Child and Adolescent Metabolic Syndrome) study, we examined the associations among 6 functionally prominent adipokines and various metabolic phenotypes. Our hypothesis was that a favorable adipokine profile, as the reflection of healthy adipose tissue function,4 may play a vital role in establishing the MHO phenotype. And, if so, then these adipokine profiles may be essential to the elucidation of factors underlying the development of metabolic imbalance and comorbidities associated with obesity, particularly in childhood.
Method
Population
Participants were recruited from the BCAMS study,21 an ongoing prospective population‐based study of obesity and related metabolic disorders from childhood to adulthood, which is registered at http://www.clinicaltrials.gov (identifier NCT03421444). A representative sample of 19 593 children (aged 6–18 years, 50% male) was recruited from the Beijing area (7 districts: 4 urban and 3 rural) between April and October 2004. Within this cohort, a total of 4500 participants were identified as being at risk for MS based on having ≥1 of the following conditions: overweight by body mass index (BMI) ≥85th percentile, elevated blood pressure (BP) (systolic and/or diastolic BP ≥90th percentile), increased total cholesterol ≥5.2 mmol/L, triglyceride ≥1.7 mmol/L, or fasting blood glucose (FBG) ≥5.6 mmol/L based on initial finger capillary blood tests. Furthermore, all children at risk for MS, together with a parallel reference population of 1095 schoolchildren, were invited to participate in a medical examination including venipuncture blood sample tests. In total, 3211 participants, including 2226 with MS risk, ultimately completed the examination. Of these, 1137 obese participants and 982 normal‐weight healthy (NWH) controls with complete data are included in this analysis. A CONSORT (Consolidated Standards of Reporting Trials) diagram of the study sample is shown in Figure S1. Age‐ and sex‐specific BMI percentiles, developed by the Working Group for Obesity in China,30 were used to classify participants as normal weight (<85th percentile for BMI), overweight (≥85th and <95th percentiles for BMI), or obese (≥95th percentile for BMI). Signed informed consent was obtained from participants and/or parents or guardians. The BCAMS study was approved by the ethics committee at the Capital Institute of Pediatrics and Peking Union Medical College Hospital in Beijing. All phases of the study complied with the Ethical Principles for Medical Research Involving Human Subjects expressed in the Declaration of Helsinki. The data, analytic methods, and study materials will not be made available to other researchers for purposes of reproducing the results or replicating the procedure.
Clinical and Anthropometric Measurements and Questionnaires
Participants’ height, weight, waist circumference, and systolic and diastolic BPs were measured according to our standard protocol.21 BMI was calculated as weight (kg) divided by height in square meters (m2). Percentage of body fat was assessed by bioelectrical impedance analysis (Tanita TBF‐300A). Pubertal development was assessed by a pediatrician of the same sex as the child, and pubertal status was scored by Tanner stage from breast development in girls and testicular volume in boys.31
In addition, customized questionnaires were used to collect physical activity and dietary information.27 Physical activity was scored as low (<3 times per week) or as moderate to vigorous (≥3 times per week), according to the frequency of participation in extracurricular physical activities (eg, cycling, hiking, running, swimming) for at least 30 minutes each time. Diet scores were calculated according to the consumption frequency of several items including breakfast, beans, seafood, milk, vegetables, fruits, red meat, sugar‐sweetened beverages, snacks, and Western fast food in the past 2 weeks. The response options were presented as a 5‐point Likert scale of the frequency of consumption, from seldom or never to every day. We assigned ascending values for more frequent consumption of favorable foods (seldom or never=1; 1 time every 2 weeks=2; 1–2 times per week=3; 3–5 times per week=4; >5 times per week=5) and descending values for more frequent consumption of unfavorable foods such as red meat, soft drinks, snacks, and Western fast food (seldom or never=5; >5 times per week=1), according to the presumed association of these food items with metabolic variables in the current study. Dietary scores were summed for each participant; a higher score indicated better dietary quality, and vice versa.32 Place of residence was collected as urban or rural area.
Laboratory Measurement
Venous blood samples were collected after an overnight (≥10‐hour) fast. The samples were aliquoted and immediately frozen for future analysis. Blood lipids and glucose were assayed using the Hitachi 7060 C automatic biochemistry analysis system. Insulin, leptin, and adiponectin were measured by ELISA, which was developed in the Key Laboratory of Endocrinology, Peking Union Medical College Hospital. The insulin assay had an interassay coefficient of variation of <9.0% and no cross‐reactivity to proinsulin (<0.05%).21 An insulin resistance index was calculated by homeostasis model assessment of insulin resistance (HOMA‐IR) as (fasting insulin mIU/L)×(FBG mmol/L)/22.5. The intra‐ and interassay coefficients of variation for leptin were <7.4% and <9.3%, respectively,33 and <5.4% and <8.5% for adiponectin, respectively.34 Serum resistin and FGF21 were measured by an ELISA kit (Phoenix Pharmaceuticals). The intra‐ and interassay coefficients of variation for resistin were <5.2% and <10.1%, respectively,21 and <6.0% and <8.6% for FGF21, respectively.35, 36 RBP‐4 was measured by commercial ELISA kits (Dou set; R&D Systems), with intra‐ and interassay coefficients of variation of <6.2% and <8.5%, respectively. For measurement of osteonectin/SPARC, mouse anti–human SPARC monoclonal antibody ON1‐1, biotinylated polyclonal goat anti–human SPARC antibody EYR01, and human SPARC HON‐3030 were used to establish an ELISA system. The intra‐ and interassay coefficients of variation were <5.2% and <9.1%, respectively.35 All samples were tested in duplicate in a blinded manner.
Definitions
The pediatric MS was defined by the modified criteria of Adult Treatment Panel III, that is, the presence of ≥3 of the following 5 components: (1) central obesity, defined as waist circumference ≥90th percentile for age and sex (established based on the BCAMS study); (2) systolic and/or diastolic BP ≥90th percentile for age, sex, and height; (3) hypertriglyceridemia, defined as triglyceride ≥1.24 mmol/L; (4) low serum HDL‐C (high‐density lipoprotein cholesterol), defined as ≤1.03 mmol/L; and (5) impaired FBG, defined as ≥5.6 mmol/L.21
MHO children were defined as those with HOMA‐IR <3.0 (95th percentile of our reference NHW children in BCAMS)37 and absence of elevated systolic and/or diastolic BP, triglyceride ≥1.24 mmol/L, HDL‐C ≤1.03 mmol/L, or FBG ≥5.6 mmol/L. Obese participants with ≥1 of these abnormalities were classified as MUO. In addition, the NWH children in the control group did not have insulin resistance or any classical feature of MS.
The presence of an abnormal adipokine profile among obese participants for identifying MHO children was determined by the optimal cut point of the receiver operating characteristic curve for each adipokine.
Statistical Analysis
All statistical analyses were carried out using SPSS v19.0 for Windows (IBM Corp). Level of statistical significance was accepted at P<0.05. All skewed distributions were natural logarithmically transformed before analysis. ANOVA with Bonferroni post hoc comparison was utilized for continuous outcomes. We recognized that body fat distribution and adipokine levels may be influenced by sex and pubertal stage. Thus, we analyzed the levels of adipokines in relation to stage of pubertal development and sex in our study (Tables S1 and S2). We found that the selected 3 adipokines (ie, leptin/adiponectin ratio, RBP‐4, and osteonectin) were not affected by pubertal development but yielded a difference by sex. Consequently, we utilized a sex‐adjusted z score for adipokines in predicting the MHO phenotype, calculated as (observed value−sex‐specific mean]/sex‐specific standard deviation). Logistic regression models were applied to analyze the association between each adipokine and metabolic status among obese participants after controlling for sex, age, pubertal stage, residence, diet score, physical activity, and BMI. To facilitate comparisons between adipokines, odds ratios (ORs) and 95% confidence intervals (CIs) were expressed as units per standard deviation. The receiver operating characteristic curve for MUO was used to determine the optimal cut points for abnormality of adipokine levels among obese participants. The optimal cutoff points were defined based on obtaining the maximum Youden index, calculated as sensitivity+specificity−1.38 In considering the sexual dimorphism in the levels of leptin/adiponectin ratio, we explored sex‐specific cutoff points for leptin/adiponectin ratio.
Results
Anthropometric and Metabolic Features of MHO
Of 1137 obese participants, 232 exhibited the MHO phenotype and 905 exhibited MUO, representing a prevalence of 20.4% for the MHO phenotype in this obese cohort. The basic features of the study groups are summarized in Table 1. Compared with MUO, a higher proportion of the MHO participants were prepubertal, female, and urban residents. The MHO phenotype was associated with younger age, more frequent physical activity, and lower adiposity indices (BMI, waist circumference, and percentage of body fat by bioelectrical impedance analysis). After adjusting for BMI and other confounding factors, the MHO phenotype had a more favorable metabolic profile than MUO, with lower BPs, total cholesterol, triglyceride, LDL‐C (low‐density lipoprotein cholesterol), FBG, fasting insulin, and HOMA‐IR but higher HDL‐C levels. Compared with NWH controls, in addition to higher BMI, waist circumference, and percent body fat, the MHO phenotype was accompanied by higher BPs, triglyceride, fasting insulin, and HOMA‐IR and lower HDL‐C levels.
Table 1.
General Characteristics of Study Participants According to Study Groups
| Variables | NWH (n=982) | MHO (n=232) | MUO (n=905) | P Values | |||
|---|---|---|---|---|---|---|---|
| P 1 | P 2 | ||||||
| MHO vs NWH | MUO vs NWH | MHO vs MUO | |||||
| Unadjusted | |||||||
| Male, % | 42.1 | 59.9 | 65.1 | <0.001a | ··· | ··· | ··· |
| Age, y, mean±SD | 12.1±3.2 | 10.8±2.9 | 11.9±2.8 | <0.001a | <0.001a | 0.133 | <0.001a |
| Pubertal stage, % | <0.001a | ··· | ··· | ··· | |||
| 1 | 34.4 | 56.9 | 36.2 | ··· | ··· | ··· | |
| 2 | 14.8 | 11.6 | 17.7 | ··· | ··· | ··· | |
| 3 | 17.9 | 12.5 | 15.9 | ··· | ··· | ··· | |
| 4 | 26.9 | 8.6 | 19.0 | ··· | ··· | ··· | |
| 5 | 6.0 | 10.3 | 11.1 | ··· | ··· | ··· | |
| Residence, urban (%) | 74.8 | 72.0 | 61.2 | <0.001a | ··· | ··· | ··· |
| Diet score, mean±SD | 36.2±4.8 | 36.2±5.0 | 35.9±4.7 | 0.292 | 0.969 | 0.138 | 0.333 |
| MVPA, % | 62.3 | 60.1 | 52.1 | <0.001a | ··· | ··· | ··· |
| Adjusted (mean±SEM)b | |||||||
| BMI, kg/m2 | 17.4±0.1 | 25.3±0.2 | 26.8±0.1 | <0.001a | <0.001a | <0.001a | <0.001a |
| BMI, z score | −0.28±0.02 | 1.89±0.04 | 2.00±0.02 | <0.001a | <0.001a | <0.001a | 0.018a |
| Waist circumference, cm | 61.5±0.2 | 79.7±0.4 | 84.3±0.2 | <0.001a | <0.001a | <0.001a | <0.001a |
| FAT% | 16.9±0.2 | 30.0±0.4 | 31.8±0.2 | <0.001a | <0.001a | <0.001a | <0.001a |
| SBP, mm Hg | 98±0.3 | 105±0.7 | 116±0.3 | <0.001a | <0.001a | <0.001a | <0.001a |
| DBP, mm Hg | 61±0.3 | 67±0.5 | 73±0.3 | <0.001a | <0.001a | <0.001a | <0.001a |
| Total cholesterol, mmol/L | 4.06±0.03 | 3.93±0.05 | 4.17±0.03 | <0.001a | <0.001a | <0.001a | <0.001a |
| Triglyceride, mmol/L | 0.71±0.02 | 0.86±0.03 | 1.31±0.02 | <0.001a | 0.022a | 0.003a | <0.001a |
| LDL‐C, mmol/L | 2.42±0.02 | 2.48±0.05 | 2.70±0.02 | <0.001a | 0.296 | <0.001a | <0.001a |
| HDL‐C, mmol/L | 1.59±0.01 | 1.38±0.02 | 1.25±0.01 | <0.001a | <0.001a | <0.001a | <0.001a |
| FBG, mmol/L | 4.9±0.02 | 4.9±0.03 | 5.2±0.02 | <0.001a | 0.169 | <0.001a | <0.001a |
| Fasting insulin, mU/Lc | 1.46±0.02 | 2.06±0.04 | 2.62±0.02 | <0.001a | <0.001a | <0.001a | <0.001a |
| HOMA‐IRc | −0.07±0.02 | 0.54±0.04 | 1.15±0.02 | <0.001a | <0.001a | <0.001a | <0.001a |
ANOVA (continuous variables) and the χ2 test (categorical variables) were used in unadjusted analysis, and data were expressed as percentage or mean±SD. GLM was used in adjusted analysis, and data were expressed as mean±SEM. P 1 values were for ANOVA or χ2 test of difference in variables including age, sex, pubertal stages, residence, diet score, and physical activity or for GLM of other variables adjusted for age, sex, pubertal stages, residence, diet score, and physical activity. P 2 was from a post hoc analysis between MHO and NWH, MUO and NWH, and MUO and MHO groups. BMI indicates body mass index; FAT%, percentage of body fat; DBP, diastolic blood pressure; FBG, fasting blood glucose; GLM, general linear model; HDL‐C, high‐density lipoprotein cholesterol; HOMA‐IR, homeostasis model assessment for insulin resistance; LDL‐C, low‐density lipoprotein cholesterol; MHO, metabolically healthy obese; MUO, metabolically unhealthy obese; MVPA, moderate‐to‐vigorous physical activity; NWH, normal‐weight healthy; SBP, systolic blood pressure.
P<0.05.
Adjusted for age, sex, pubertal stages, residence, diet score, and physical activity.
Skewed distributions were natural logarithmically transformed.
Comparisons of Adipokine Profiles
Figure 1 shows the different levels of various adipokines across the 3 groups (NWH, MHO, and MUO) after adjusting for age, pubertal status, residence, diet score, and physical activity. Serum leptin, leptin/adiponectin ratio, and RBP‐4 levels increased gradually and adiponectin concentrations decreased gradually from NWH to MHO and MUO groups (all P<0.05; Figure 1A, 1C, 1F, and 1B). No consistent pattern was observed between MHO and MUO groups with respect to resistin and FGF21 levels, whereas the NWH phenotype had lower concentrations of resistin than either obese group and higher concentrations of FGF21 than the MUO group (P<0.05; Figure 1D and 1E). Interestingly, the levels of osteonectin showed no difference between the MHO and NWH groups but were significantly higher in the MUO group (P<0.01; Figure 1G). Notably, the differences in leptin, adiponectin, leptin/adiponectin ratio, RBP‐4, and osteonectin between the MHO and MUO groups remained significant even after adjusting for BMI or waist circumference (Figure S2).
Figure 1.
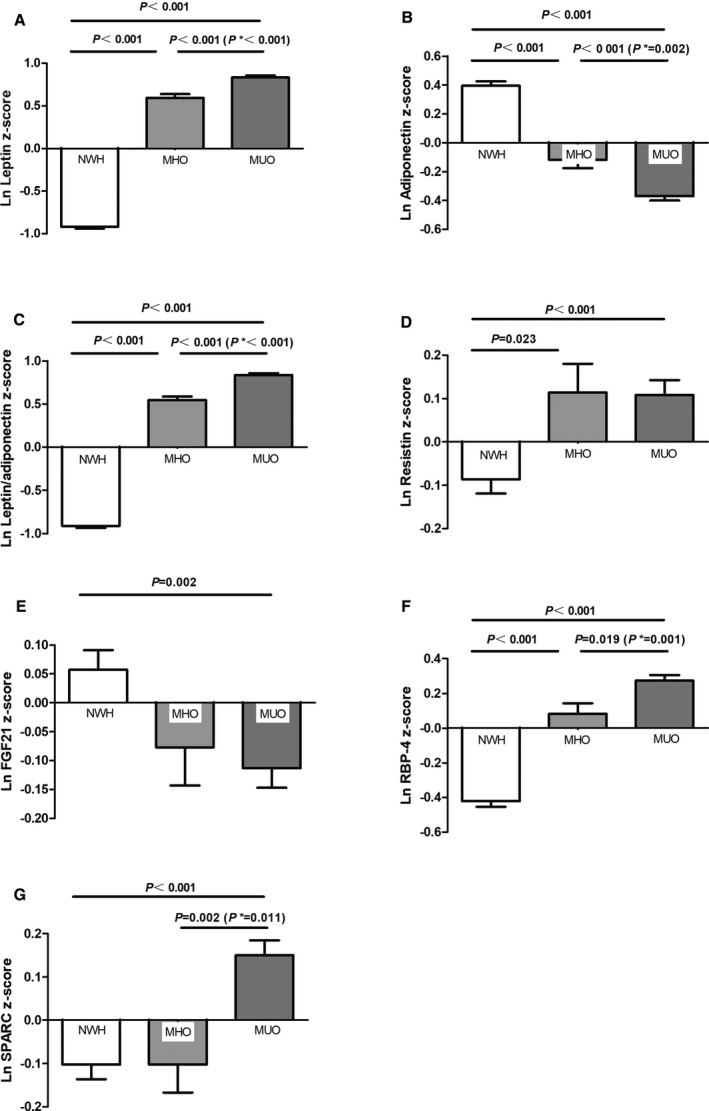
Comparison of adipokines levels across the 3 groups. Data were natural logarithmically (ln) transformed and expressed in standard deviations after adjusting for age, pubertal stages, residence, diet score, and physical activity. P* was further adjusted for body mass index based on the former models. Comparisons are shown across the 3 groups: ln leptin z score (A), ln adiponectin z score (B), ln leptin/adiponectin z score (C), ln resistin z score (D), ln FGF21 z score (E), ln RBP‐4 z score (F), and ln osteonectin z score (G). FGF21 indicates fibroblast growth factor 21; MHO, metabolically healthy obese; MUO, metabolically unhealthy obese; NWH, normal‐weight healthy; RBP‐4, retinol binding protein 4.
Adipokines as the Independent Predictor of MHO Phenotype in Multivariable Regression Analysis
Separate multivariable logistic regression analysis was performed to examine each adipokine (with sex‐specific z score) as a predictor of the MHO phenotype among obese participants. As shown in Table 2A, after adjustment for age, pubertal stages, residence, diet score, physical activity, and BMI, decreased osteonectin (OR: 0.82; 95% CI, 0.70–0.96), RBP‐4 (OR: 0.74; 95% CI, 0.62–0.88), leptin (OR: 0.65; 95% CI, 0.50–0.83), and leptin/adiponectin ratio (OR: 0.56; 95% CI, 0.43–0.73) and increased adiponectin (OR: 1.28; 95% CI, 1.07–1.54) were independent predictors of the MHO phenotype; however, FGF21 and resistin were not predictive (all P>0.10) of the MHO phenotype. When all significant adipokines were assessed together (Table 2B), after adjusting for age, sex, pubertal status, residence, diet score, physical activity, and BMI, decreased osteonectin (P=0.021), RBP‐4 (P=0.005), and leptin/adiponectin (P<0.001) levels remained significantly associated with the MHO phenotype. For every decrease in standard deviation, the odds of being MHO increased by 17.9% for osteonectin, 22.8% for RBP‐4, and 42.4% for leptin/adiponectin ratio. After further adjustment for waist circumference, the predictive roles of osteonectin (OR: 0.83; 95% CI, 0.70–0.98), RBP‐4 (OR: 0.78; 95% CI, 0.65–0.93), and leptin/adiponectin ratio (OR: 0.60; 95% CI, 0.45–0.80) were unaltered.
Table 2.
Associations Between Individual Adipokine and MHO Status
| Adipokines | β | SE | OR (95% CI) | P Value |
|---|---|---|---|---|
| (A) Adipokines modeled separately | ||||
| Leptina | −0.44 | 0.13 | 0.65 (0.50–0.83) | 0.001b |
| Adiponectina | 0.25 | 0.09 | 1.28 (1.07–1.54) | 0.007b |
| Leptin/adiponectina | −0.59 | 0.14 | 0.56 (0.43–0.73) | <0.001b |
| Resistina | 0.06 | 0.08 | 1.06 (0.91–1.23) | 0.482 |
| FGF21a | 0.00 | 0.08 | 1.00 (0.85–1.18) | 0.988 |
| RBP‐4a | −0.30 | 0.09 | 0.74 (0.62–0.88) | 0.001b |
| Osteonectina | −0.21 | 0.08 | 0.82 (0.70–0.96) | 0.012b |
| (B) Adipokines modeled together | ||||
| Leptin/adiponectina | −0.55 | 0.15 | 0.58 (0.43–0.77) | <0.001b |
| RBP‐4a | −0.26 | 0.09 | 0.77 (0.64–0.93) | 0.005b |
| Osteonectina | −0.20 | 0.09 | 0.82 (0.70–0.97) | 0.021b |
Data were natural logarithmically transformed, and all ORs were expressed in standard deviations and adjusted for age, pubertal stages, residence, diet score, physical activity, and body mass index. CI indicates confidence interval; FGF21, fibroblast growth factor 21; OR, odds ratio; RBP‐4, retinol binding protein 4.
Per sex‐specific standard deviation increment of each natural logarithmic unit of adipokine.
P<0.05.
Comparisons of Metabolic Features Among Obese Participants With the Clustering of Adipokine Abnormalities
Because decreased osteonectin, RBP‐4, and leptin/adiponectin ratio were each independent predictors of the MHO phenotype, we established optimal cutoff points for these variables in the obese groups, using receiver operating characteristic analysis. Accordingly, the abnormalities of adipokines were defined as >1.11 μg/mL for osteonectin, >37.08 μg/mL for RBP‐4, and >2.44 (male) or >2.78 (female) for leptin/adiponectin ratio (Table S3). Thus, obese participants were further stratified by the number (from 0 to 3) of associated adipokine abnormalities. As shown in Table 3, obese participants with a greater number of adipokine abnormalities were older and had higher BMI, waist circumference, BP, triglyceride, fasting insulin, and HOMA‐IR levels but lower HDL‐C. Correspondingly, obese participants with more adipokine abnormalities exhibited a higher proportion of central obesity, high BP, high triglyceride, HOMA‐IR ≥3, MS, and a lower proportion of the MHO phenotype (all P<0.05).
Table 3.
Relationships Between the Number of Adipokine Abnormalities and Metabolic Characters in Obese Participants
| Phenotype | Number of Adipokine Abnormalities | P Values | |||
|---|---|---|---|---|---|
| 0 (n=170) | 1 (n=406) | 2 (n=415) | 3 (n=146) | ||
| Unadjusted | |||||
| Male, % | 35.8 | 40.8 | 32.4 | 32.9 | 0.044a |
| Age, y, mean±SD | 10.1±2.5 | 11.5±2.9b | 12.3±2.7b, c | 12.6±2.9b, c | <0.001a |
| Pubertal stages, % | <0.001a | ||||
| 1 | 64.6 | 42.0 | 34.9 | 29.8 | |
| 2 | 12.2 | 15.2 | 19.6 | 19.1 | |
| 3 | 10.4 | 14.2 | 15.3 | 20.6 | |
| 4 | 7.9 | 13.9 | 19.6 | 18.4 | |
| 5 | 4.9 | 13.9 | 9.7 | 12.1 | |
| Residence, rural (%) | 37.6 | 42.4 | 32.8 | 30.1 | 0.011a |
| Diet score, mean±SD | 36.5±4.7 | 35.8±4.9 | 35.7±4.8 | 36.4±4.7 | 0.161 |
| MVPA, % | 61.0 | 52.6 | 52.1 | 52.8 | 0.251 |
| BMI, kg/m2, mean±SD | 24.1±2.9 | 26.0±3.5b | 27.3±3.5b, c | 28.3±3.8b, c, d | <0.001a |
| Adjusted (mean±SEM)e | |||||
| Waist circumference, cm | 76.1±0.70 | 81.7±0.5 | 86.3±0.5b, c | 88.9±0.9b, c | <0.001a |
| SBP, mm Hg | 108±0.8 | 113±0.6b | 116±0.6b, c | 119±1.1b, c | 0.034a |
| DBP, mm Hg | 69±0.7 | 71±0.4 | 73±0.4b, c | 74±0.8b, c | 0.054 |
| Triglyceride, mmol/L | 0.99±0.04 | 1.05±0.02 | 1.34±0.03b, c | 1.48±0.06b, c | <0.001a |
| HDL‐C, mmol/L | 1.35±0.02 | 1.28±0.01b | 1.25±0.01b | 1.23±0.02b | 0.772 |
| FBG, mmol/L | 5.10±0.03 | 5.17±0.02 | 5.15±0.03 | 5.15±0.04 | 0.656 |
| Fasting insulin, mU/Lf | 2.07±0.04 | 2.38±0.03b | 2.63±0.03b, c | 2.79±0.06b, c, d | <0.001a |
| HOMA‐IRf | 0.58±0.04 | 0.91±0.03b | 1.15±0.03b, c | 1.31±0.06b, c, d | <0.001a |
| Adipokines | |||||
| RBP‐4, μg/mLf | 3.35±0.02 | 3.46±0.02b | 3.61±0.02b, c | 3.85±0.02b, c, d | <0.001a |
| Osteonectin, μg/mLf | −0.24±0.02 | −0.01±0.02b | 0.23±0.02b, c | 0.55±0.03b, c, d | <0.001a |
| Leptin/adiponectinf | 0.12±0.06 | 0.78±0.05b | 1.42±0.04b, c | 1.82±0.05b, c, d | <0.001a |
| MS components (%) | |||||
| Central obesity | 77.6 | 76.1 | 84.3 | 92.5 | 0.050a |
| High BP | 32.4 | 46.3b | 52.5b | 56.2b | 0.043a |
| High triglyceride | 21.8 | 26.6 | 42.9b | 55.5b | <0.001a |
| Low HDL‐C | 11.8 | 15.8 | 18.3 | 19.9 | 0.948 |
| Hyperglycemia | 12.4 | 16.0 | 15.4 | 15.1 | 0.846 |
| HOMA‐IR ≥3 | 15.3 | 37.4b | 51.8b | 62.3b | <0.001a |
| MS | 14.7 | 24.9 | 34.5b | 45.9b | 0.005a |
| MHO | 38.8 | 25.1b | 12.8b | 7.5b | <0.001a |
ANOVA (continuous variables) and χ2 test (categorical variables) were used in unadjusted analysis, and data were expressed as percentage or mean±SD. GLM (continuous variables) and logistic regression analysis (categorical variables) were used in adjusted analysis, and data were expressed as mean±SEM or percentage. P values were for ANOVA and χ2 test of difference in variables including age, sex, pubertal stages, residence, diet score, physical activity, and BMI or for GLM test and logistic regression analysis of other variables adjusted for age, sex, pubertal stages, residence, diet score, physical activity, and BMI. BMI indicates body mass index; BP, blood pressure; DBP, diastolic blood pressure; FBG, fasting blood glucose; GLM, general linear model; HDL‐C, high‐density lipoprotein cholesterol; HOMA‐IR, homeostasis model assessment for insulin resistance; MHO, metabolically healthy obesity; MS, metabolic syndrome; MVPA, moderate‐to‐vigorous physical activity; RBP‐4, retinol binding protein 4; SBP, systolic blood pressure.
P<0.05.
Statistical significance in a post hoc test after adjusting for age, sex, pubertal stages, residence, diet score, physical activity, and BMI, where differences from the nonadipokine abnormality group are indicated as P<0.05.
Statistical significance in a post hoc test after adjusting for age, sex, pubertal stages, residence, diet score, physical activity, and BMI, where differences vs the group with 1 adipokine abnormality are indicated as P<0.05.
Statistical significance in a post hoc test after adjusting for age, sex, pubertal stages, residence, diet score, physical activity, and BMI, where differences vs the group with 2 adipokine abnormalities are indicated as P<0.05.
Adjusted for age, sex, pubertal stages, residence, diet score, physical activity, and BMI.
Skewed distributions were natural logarithmically transformed.
As shown in Figure 2, increasing numbers of adipokine abnormalities were associated with an increased risk of MS and a reduction in the odds of exhibiting the MHO phenotype. In comparison to those who had no adipokine abnormality, participants with any 3 adipokine abnormalities were significantly less likely to be among the MHO group (OR: 0.20; 95% CI, 0.10–0.43) and more likely to have MS (OR: 2.77; 95% CI, 1.52–5.03), after adjustment for age, sex, pubertal stages, residence, diet score, physical activity, and BMI.
Figure 2.
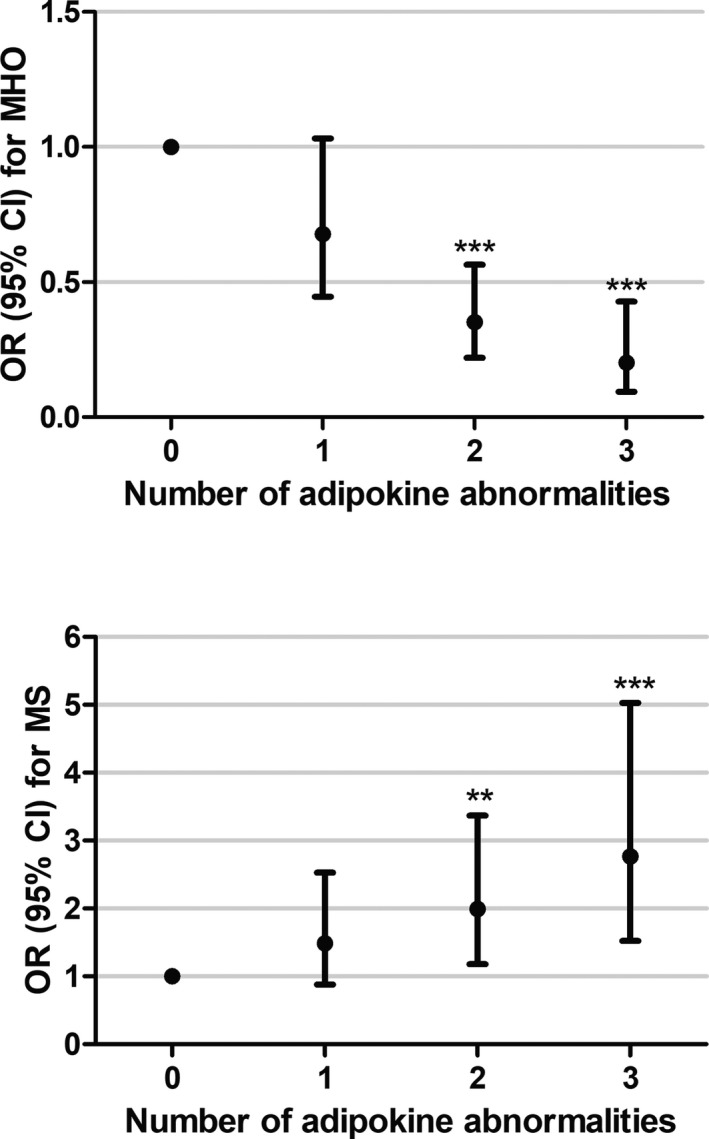
Associations between adipokine abnormalities and MHO and MS in obese participants. Data were calculated by logistic regression with adjustment for age, sex, pubertal stages, residence, diet score, physical activity, and body mass index. Participants with no abnormality of these adipokines were considered as reference. ***P≤0.001. **P≤0.01. CI indicates confidence interval; MHO, metabolically healthy obesity; MS, metabolic syndrome; OR, odds ratio.
Discussion
To identify children with the MHO phenotype, we combined 2 commonly held definitions of MHO (the absence of insulin resistance or any classical MS components) and identified a 20.4% prevalence of the MHO phenotype among obese children in a large pediatric Chinese cohort. Given that adipose tissue secretes a number of adipokines, which can greatly influence metabolism,19 we selected 6 functionally prominent adipokines to examine their associations with this MHO phenotype. First, we found that pediatric participants with the MHO (compared with MUO) phenotype exhibited a more favorable adipokine profile, with lower levels of osteonectin, RBP‐4, and leptin but higher levels of adiponectin. Second, we found that a lower leptin/adiponectin ratio and lower levels of RBP‐4 and osteonectin independently predicted the MHO phenotype among obese participants, even after adjustment for confounding factors including BMI and waist circumference. In addition, those with a greater number of aberrant adipokines (high osteonectin, RBP‐4, and leptin/adiponectin ratio) displayed a higher risk of having central obesity, elevated BP, dyslipidemia, insulin resistance, and MS, with a lower likelihood of the MHO phenotype. Although an association of adiponectin and leptin levels with the MHO phenotype has been reported previously in pediatric and adult African American, Hispanic, and European obese individuals,37, 39, 40, 41 this is the first large study to examine a pediatric Chinese population. The role of adipokine profiles (including RBP‐4 and osteonectin) in differentiating MHO from MUO needs to be confirmed with additional studies; however, our results point to a robust association between circulating adipokines and the metabolic profile in early onset obesity.
This article is the first report of the novel adipokine osteonectin in relation to MHO versus MUO phenotypes. Osteonectin, also called SPARC or BM40, is a predominantly subcutaneous, adipocyte‐expressed, profibrotic protein with pleiotropic functions that has been recently proposed as playing a decisive role in the pathogenesis of insulin resistance, obesity, and type 2 diabetes mellitus.42 The influence of osteonectin in insulin resistance and associated metabolic dysfunction may arise from its role in obesity‐induced adipose tissue fibrosis by regulating extracellular matrix composition and inhibiting adipogenesis.43 Fibrosis of adipose tissue may restrict accumulation of triglycerides in this type of tissue, which could lead to elevated circulating triglycerides, systemic hyperlipidemia, and ectopic lipid deposition in the liver and skeletal muscle, contributing to insulin resistance.35, 44 Our previous study35 and others29, 45 have revealed an association between increased osteonectin/SPARC levels and insulin resistance in gestational diabetes mellitus, type 2 diabetes mellitus, diabetic retinopathy, and nephropathy. In the present study, osteonectin levels were low in MHO and, in fact, comparable to levels found in NWH participants. This result may provide additional evidence in support of the “adipose expandability” hypotheses,46 which states that the adipose tissue in MHO participants might maintain the ability to expand or contract depending on energy needs. Consequently, a low level of the known inhibitor of adipogenesis, osteonectin, in MHO children implies that their adipose tissue may sustain a high degree of flexibility in the extracellular matrix; therefore, MHO children may have a relatively greater capacity to store excess fat mass with less risk of adverse metabolic consequences than those with the MUO phenotype.47 Thus, osteonectin may be useful as a novel early indicator of the MHO phenotype. Further prospective research is needed to confirm these findings.
RBP‐4, secreted by adipocytes and liver, plays an important role in the development of insulin resistance, obesity, and other metabolic abnormalities48 by attenuation of insulin signaling in skeletal muscle and increasing hepatic gluconeogenesis via enhanced expression of phosphoenolpyruvate carboxykinase in liver.22 To date, there is only 1 small study consisting of 60 morbidly obese adults39 shows that RBP‐4 is lower in MHO people. Consistent with this finding, we found that RBP‐4 was significantly lower in MHO than MUO children and that low RBP‐4 levels were significantly associated with the MHO phenotype independent of BMI and/or other adipokines, suggesting that RBP‐4 may be used as an independent predictor of the MHO phenotype in childhood.
Among the 6 adipokines selected for our study, leptin and adiponectin are the 2 most thoroughly examined in the literature. Leptin is a peptide hormone produced by adipose tissues that plays a role in regulating appetite, thermogenesis, lipid oxidation, and insulin sensitivity, with each of these effects being attenuated in obese individuals with leptin resistance.4 In our study, circulating leptin concentrations were significantly higher in the MUO group than in the MHO group. In contrast, 3 previous studies evaluating circulating leptin levels in adults with obesity did not find a significant difference between MHO and MUO groups.39, 40, 41 In addition, a small study (n=28) showed similar leptin levels in insulin‐resistant and insulin‐sensitive adolescents using the hyperinsulinemic–euglycemic clamp.49 Aside from the different criteria used to define the MHO phenotype, these apparently conflicting results might be explained by the different race, age, sex, and sample size characteristics found in the present study.
Adiponectin is the most abundant peptide secreted by adipocytes. It is considered an insulin sensitizer in lipid and glucose metabolism, with antidiabetic, antiatherogenic, and anti‐inflammatory properties. In contrast to leptin and most other adipokines, a decrease in circulating adiponectin levels, which contributes to the development of insulin resistance, diabetes mellitus, and MS, has been observed in patients with obesity.50 Given its important role in metabolism, adiponectin has gained a great deal of attention in recent clinical studies of the MHO phenotype.24, 39, 41, 49, 51, 52 We also found a significant association between higher adiponectin levels and the MHO phenotype in our large pediatric Chinese cohort, which has heretofore never been examined. Because the combination of leptin and adiponectin (ie, leptin/adiponectin ratio) was previously reported to be a better indicator of insulin resistance and MS than any single adipokine,53 we compared the associations of leptin, adiponectin, and their ratio with the MHO phenotype. Not surprisingly, the leptin/adiponectin ratio was more likely to predict the phenotype than either leptin or adiponectin alone.
Unlike the above‐mentioned adipokines, there are no significant differences in levels of FGF21 and resistin between MHO and MUO groups, although levels were increased in comparison to the NWH group. Resistin is secreted mainly by adipocytes in rodents and by mononuclear cells in humans but is hypothesized to play a role in obesity, insulin resistance, and CVD in humans by competing with lipopolysaccharides for binding to TLR4 (Toll‐like receptor 4) to mediate some of its proinflammatory effects.54 Two studies found recently that circulating resistin concentrations were significantly lower in MHO verses MUO people.51 However, another study including 444 middle‐aged obese participants failed to identify a significant correlation between resistin and the MHO phenotype,26 which was defined less strictly than in the present study. FGF21 is mainly produced by liver and is associated with beneficial metabolic characteristics including reduced body weight and hepatic steatosis, as well as improved insulin sensitivity, lipid profiles, and blood sugar.55 A small study (n=20) in morbidly obesity adults recently showed 2‐fold higher FGF21 levels in MUO than MHO participants.28 Nevertheless, there is a clear need for further studies to improve our understanding of the association between FGF21 and resistin levels and metabolic health.
In an attempt to better understand the role of adipokine expression in the MHO versus MUO phenotypes, we compared adipokine profiles within a group of well‐characterized obese participants. As expected, we found that those with more aberrant adipokine levels were more likely to exhibit the MUO phenotype; however, MHO participants still displayed a metabolic profile predisposed to early CVD16 (including elevated BP, triglyceride, FBG, fasting insulin, HOMA‐IR, leptin, leptin/adiponectin ratio, resistin, and RBP‐4, as well as decreased HDL‐C and adiponectin levels in our study) compared with their NWH counterparts. The continuum of metabolic profiles from NWH to MHO to MUO observed in our large pediatric cohort implies that the MHO phenotype may be a precursor to MUO, as increasing evidence in adults has begun to suggest.2 This observation supports the premise that the MHO phenotype should be identified early and preventive strategies used to avoid the subsequent development of the adverse metabolic profile characteristic of the MUO phenotype.
The strength of our study derives from its large, well‐characterized cohort and the systematic analysis of multiple potential adipokines used to distinguish between the MHO and MUO phenotypes. Further impact is derived from our ability to control for pubertal status, dietary habits, and levels of physical activity, which were assessed in this cohort. In addition, insulin resistance as used in our study was defined based on HOMA‐IR cutoff (<3.0) in our own population (95th percentile of the reference NWH children in BCAMS). However, several limitations remain. First, the cross‐sectional nature of the present study cannot be taken as definitive proof of a longitudinal progression in metabolic profiles, nor can it determine whether a cause‐and‐effect relationship exists between adipokine levels and the MHO and MUO phenotypes. Second, we did not validate the optimal cut points of the 3 adipokines that were found to be predictive of MHO/MUO in an independent cohort. This is presently being examined in an ongoing follow‐up study, which may provide a better understanding of how adipokines, particularly the novel adipokine osteonectin, contribute to achieving and sustaining good metabolic health from childhood into adulthood. Third, our findings were obtained from only Chinese participants and therefore cannot be generalized to other ethnic populations without further replication. Finally, although we included 6 functionally prominent adipokines, we are aware that many others have been implicated in obesity‐related disorders.19 Nonetheless, these observations are powerful and contribute to a better understanding of adipokines and their function as mediators or markers of metabolic dysregulation. Unfortunately, the lack of consensus regarding the definitions of MHO versus MUO makes it difficult to compare results across studies. Such comparisons await the development of more uniform definitions for these obesity phenotypes, as has already occurred for diabetes mellitus and the MS.
Conclusions
This study assessed the MHO phenotype among Chinese children by applying a strict definition consisting of preserved insulin sensitivity and the absence of MS criteria. We found that MHO participants were characterized by a relatively favorable adipokine profile, more akin to NWH than the MUO phenotype. Our study indicates that osteonectin and RBP‐4, in combination with more well‐established adipokines (leptin and adiponectin), may serve as novel markers to distinguish MHO from MUO individuals during childhood. Because the alterations in adipokine profiles in obesity precede the presence of metabolic disturbances, more detailed analysis of our data may allow these levels to be assembled into an “adipokine score” that reflects metabolic risk, much the way that NMR LipoProfile (LipoScience, Lnc.) measures have been used to derive the lipoprotein insulin resistance score.56 Nonetheless, our findings suggest that mechanisms affecting adipokine regulation and adipose tissue expansion, beyond simple caloric excess, may contribute to the metabolic consequence of obesity. Consequently, our study may help in the early identification of high‐risk individuals and pave the way for optimization of prevention and treatment strategies to combat obesity.
Sources of Funding
This work was supported by National Key R&D Program of China (2016YFC1304801), Key Program of Beijing Municipal Science and Technology Commission (D111100000611001, D111100000611002), Beijing Natural Science Foundation (7172169), Beijing Science and Technology Star Program (2004A027), Novo Nordisk Union Diabetes Research Talent Fund (2011A002), and National Key Program of Clinical Science (WBYZ2011‐873). We gratefully thank all participants in the BCAMS (Beijing Child and Adolescent Metabolic Syndrome) study.
Disclosures
None.
Supporting information
Table S1. Levels of Adipokines by Pubertal Development
Table S2. Levels of Adipokines by Sex
Table S3. Area Under Receiver Operating Characteristic Curves and Optimal Cutoffs of Adipokines in Predicting the Metabolically Unhealthy Obese Phenotype
Figure S1. CONSORT (Consolidated Standards of Reporting Trials) diagram of the study sample.
Figure S2. Comparison of adipokines levels between metabolically healthy obese and metabolically unhealthy obese participants after adjusting for waist circumference.
(J Am Heart Assoc. 2018;7:e009169 DOI: 10.1161/JAHA.118.009169.)
References
- 1. Balagopal PB, de Ferranti SD, Cook S, Daniels SR, Gidding SS, Hayman LL, McCrindle BW, Mietus‐Snyder ML, Steinberger J; Committee on Atherosclerosis Hypertension and Obesity in Youth of the Council on Cardiovascular Disease in the Young; Council on Nutrition, Physical Activity and Metabolism; Council on Epidemiology and Prevention . Nontraditional risk factors and biomarkers for cardiovascular disease: mechanistic, research, and clinical considerations for youth: a scientific statement from the American Heart Association. Circulation. 2011;123:2749–2769. [DOI] [PubMed] [Google Scholar]
- 2. Phillips CM. Metabolically healthy obesity across the life course: epidemiology, determinants, and implications. Ann N Y Acad Sci. 2017;1391:85–100. [DOI] [PubMed] [Google Scholar]
- 3. Samocha‐Bonet D, Dixit VD, Kahn CR, Leibel RL, Lin X, Nieuwdorp M, Pietilainen KH, Rabasa‐Lhoret R, Roden M, Scherer PE, Klein S, Ravussin E. Metabolically healthy and unhealthy obese—the 2013 Stock Conference report. Obes Rev. 2014;15:697–708. [DOI] [PMC free article] [PubMed] [Google Scholar]
- 4. Samocha‐Bonet D, Chisholm DJ, Tonks K, Campbell LV, Greenfield JR. Insulin‐sensitive obesity in humans—a ‘favorable fat’ phenotype? Trends Endocrinol Metab. 2012;23:116–124. [DOI] [PubMed] [Google Scholar]
- 5. Calori G, Lattuada G, Piemonti L, Garancini MP, Ragogna F, Villa M, Mannino S, Crosignani P, Bosi E, Luzi L, Ruotolo G, Perseghin G. Prevalence, metabolic features, and prognosis of metabolically healthy obese Italian individuals: the Cremona Study. Diabetes Care. 2011;34:210–215. [DOI] [PMC free article] [PubMed] [Google Scholar]
- 6. Kuk JL, Ardern CI. Are metabolically normal but obese individuals at lower risk for all‐cause mortality? Diabetes Care. 2009;32:2297–2299. [DOI] [PMC free article] [PubMed] [Google Scholar]
- 7. Meigs JB, Wilson PW, Fox CS, Vasan RS, Nathan DM, Sullivan LM, D'Agostino RB. Body mass index, metabolic syndrome, and risk of type 2 diabetes or cardiovascular disease. J Clin Endocrinol Metab. 2006;91:2906–2912. [DOI] [PubMed] [Google Scholar]
- 8. St‐Pierre AC, Cantin B, Mauriege P, Bergeron J, Dagenais GR, Despres JP, Lamarche B. Insulin resistance syndrome, body mass index and the risk of ischemic heart disease. CMAJ. 2005;172:1301–1305. [DOI] [PMC free article] [PubMed] [Google Scholar]
- 9. Dobson R, Burgess MI, Sprung VS, Irwin A, Hamer M, Jones J, Daousi C, Adams V, Kemp GJ, Shojaee‐Moradie F, Umpleby M, Cuthbertson DJ. Metabolically healthy and unhealthy obesity: differential effects on myocardial function according to metabolic syndrome, rather than obesity. Int J Obes. 2016;40:153–161. [DOI] [PubMed] [Google Scholar]
- 10. Bradshaw PT, Reynolds KR, Wagenknecht LE, Ndumele CE, Stevens J. Incidence of components of metabolic syndrome in the metabolically healthy obese over 9 years follow‐up: the Atherosclerosis Risk in Communities Study. Int J Obes. 2018;42:295–301. [DOI] [PMC free article] [PubMed] [Google Scholar]
- 11. Espinosa De Ycaza AE, Donegan D, Jensen MD. Long‐term metabolic risk for the metabolically healthy overweight/obese phenotype. Int J Obes. 2018;42:302–309. [DOI] [PMC free article] [PubMed] [Google Scholar]
- 12. Roberson LL, Aneni EC, Maziak W, Agatston A, Feldman T, Rouseff M, Tran T, Blaha MJ, Santos RD, Sposito A, Al‐Mallah MH, Blankstein R, Budoff MJ, Nasir K. Beyond BMI: the “metabolically healthy obese” phenotype & its association with clinical/subclinical cardiovascular disease and all‐cause mortality—a systematic review. BMC Public Health. 2014;14:14. [DOI] [PMC free article] [PubMed] [Google Scholar]
- 13. Kim NH, Seo JA, Cho H, Seo JH, Yu JH, Yoo HJ, Kim SG, Choi KM, Baik SH, Choi DS, Shin C, Cho NH. Risk of the development of diabetes and cardiovascular disease in metabolically healthy obese people: the Korean Genome and Epidemiology Study. Medicine. 2016;95:e3384. [DOI] [PMC free article] [PubMed] [Google Scholar]
- 14. Bell JA, Hamer M, Batty GD, Singh‐Manoux A, Sabia S, Kivimaki M. Incidence of metabolic risk factors among healthy obese adults: 20‐year follow‐up. J Am Coll Cardiol. 2015;66:871–873. [DOI] [PMC free article] [PubMed] [Google Scholar]
- 15. Mongraw‐Chaffin M, Foster MC, Anderson CAM, Burke GL, Haq N, Kalyani RR, Ouyang P, Sibley CT, Tracy R, Woodward M, Vaidya D. Metabolically healthy obesity, transition to metabolic syndrome, and cardiovascular risk. J Am Coll Cardiol. 2018;71:1857–1865. [DOI] [PMC free article] [PubMed] [Google Scholar]
- 16. Caleyachetty R, Thomas GN, Toulis KA, Mohammed N, Gokhale KM, Balachandran K, Nirantharakumar K. Metabolically healthy obese and incident cardiovascular disease events among 3.5 million men and women. J Am Coll Cardiol. 2017;70:1429–1437. [DOI] [PubMed] [Google Scholar]
- 17. Reilly JJ, Kelly J. Long‐term impact of overweight and obesity in childhood and adolescence on morbidity and premature mortality in adulthood: systematic review. Int J Obes. 2011;35:891–898. [DOI] [PubMed] [Google Scholar]
- 18. Bluher S, Schwarz P. Metabolically healthy obesity from childhood to adulthood—does weight status alone matter? Metabolism. 2014;63:1084–1092. [DOI] [PubMed] [Google Scholar]
- 19. Bluher M, Mantzoros CS. From leptin to other adipokines in health and disease: facts and expectations at the beginning of the 21st century. Metabolism. 2015;64:131–145. [DOI] [PubMed] [Google Scholar]
- 20. Alberti KG, Zimmet P, Shaw J; IDF Epidemiology Task Force Consensus Group . The metabolic syndrome—a new worldwide definition. Lancet. 2005;366:1059–1062. [DOI] [PubMed] [Google Scholar]
- 21. Li M, Fisette A, Zhao XY, Deng JY, Mi J, Cianflone K. Serum resistin correlates with central obesity but weakly with insulin resistance in Chinese children and adolescents. Int J Obes. 2009;33:424–439. [DOI] [PubMed] [Google Scholar]
- 22. Yang Q, Graham TE, Mody N, Preitner F, Peroni OD, Zabolotny JM, Kotani K, Quadro L, Kahn BB. Serum retinol binding protein 4 contributes to insulin resistance in obesity and type 2 diabetes. Nature. 2005;436:356–362. [DOI] [PubMed] [Google Scholar]
- 23. Kharitonenkov A, DiMarchi R. FGF21 revolutions: recent advances illuminating FGF21 biology and medicinal properties. Trends Endocrinol Metab. 2015;26:608–617. [DOI] [PubMed] [Google Scholar]
- 24. Ahl S, Guenther M, Zhao S, James R, Marks J, Szabo A, Kidambi S. Adiponectin levels differentiate metabolically healthy vs unhealthy among obese and nonobese white individuals. J Clin Endocrinol Metab. 2015;100:4172–4180. [DOI] [PMC free article] [PubMed] [Google Scholar]
- 25. Labruna G, Pasanisi F, Nardelli C, Caso R, Vitale DF, Contaldo F, Sacchetti L. High leptin/adiponectin ratio and serum triglycerides are associated with an “at‐risk” phenotype in young severely obese patients. Obesity. 2011;19:1492–1496. [DOI] [PubMed] [Google Scholar]
- 26. Gómez‐Ambrosi J, Catalán V, Rodríguez A, Andrada P, Ramírez B, Ibáñez P, Vila N, Romero S, Margall MA, Gil MJ, Moncada R, Valentí V, Silva C, Salvador J, Frühbeck G. Increased cardiometabolic risk factors and inflammation in adipose tissue in obese subjects classified as metabolically healthy. Diabetes Care. 2014;37:2813–2821. [DOI] [PubMed] [Google Scholar]
- 27. Doumatey AP, Zhou J, Zhou M, Prieto D, Rotimi CN, Adeyemo A. Proinflammatory and lipid biomarkers mediate metabolically healthy obesity: a proteomics study. Obesity (Silver Spring). 2016;24:1257–1265. [DOI] [PMC free article] [PubMed] [Google Scholar]
- 28. Berti L, Irmler M, Zdichavsky M, Meile T, Böhm A, Stefan N, Fritsche A, Beckers J, Königsrainer A, Häring H‐U, de Angelis MH, Staiger H. Fibroblast growth factor 21 is elevated in metabolically unhealthy obesity and affects lipid deposition, adipogenesis, and adipokine secretion of human abdominal subcutaneous adipocytes. Mol Metab. 2015;4:519–527. [DOI] [PMC free article] [PubMed] [Google Scholar]
- 29. Kos K, Wilding JPH. SPARC: a key player in the pathologies associated with obesity and diabetes. Nat Rev Endocrinol. 2010;6:225–235. [DOI] [PubMed] [Google Scholar]
- 30.[Body mass index reference norm for screening overweight and obesity in Chinese children and adolescents]. Zhonghua Liu Xing Bing Xue Za Zhi. 2004;25:97–102. [PubMed] [Google Scholar]
- 31. Marshall WA, Tanner JM. Puberty in human growth. 1986.
- 32. Li L, Yin J, Cheng H, Wang Y, Gao S, Li M, Grant SF, Li C, Mi J, Li M. Identification of genetic and environmental factors predicting metabolically healthy obesity in children: data from the BCAMS Study. J Clin Endocrinol Metab. 2016;101:1816–1825. [DOI] [PubMed] [Google Scholar]
- 33. Li M, Yin JH, Zhang K, Wu CY. [A highly sensitive enzyme‐linked immunosorbent assay for measurement of leptin secretion in human adipocytes]. Zhonghua Yi Xue Za Zhi. 2008;88:3293–3297. [PubMed] [Google Scholar]
- 34. Li Q, Lu Y, Sun L, Yan J, Yan X, Fang L, Li M, Fan Z. Plasma adiponectin levels in relation to prognosis in patients with angiographic coronary artery disease. Metabolism. 2012;61:1803–1808. [DOI] [PubMed] [Google Scholar]
- 35. Xu L, Ping F, Yin J, Xiao X, Xiang H, Ballantyne CM, Wu H, Li M. Elevated plasma sparc levels are associated with insulin resistance, dyslipidemia, and inflammation in gestational diabetes mellitus. PLoS One. 2013;8:e81615. [DOI] [PMC free article] [PubMed] [Google Scholar]
- 36. Li G, Yin J, Fu J, Li L, Grant SF, Li C, Li M, Mi J, Li M, Gao S. FGF21 deficiency is associated with childhood obesity, insulin resistance and hypoadiponectinaemia: the BCAMS Study. Diabetes Metab. 2017;43:253–260. [DOI] [PubMed] [Google Scholar]
- 37. Yin J, Li M, Xu L, Wang Y, Cheng H, Zhao X, Mi J. Insulin resistance determined by Homeostasis Model Assessment (HOMA) and associations with metabolic syndrome among Chinese children and teenagers. Diabetol Metab Syndr. 2013;5:71. [DOI] [PMC free article] [PubMed] [Google Scholar]
- 38. Yin J, Tian L. Joint confidence region estimation for area under ROC curve and Youden index. Stat Med. 2014;33:985–1000. [DOI] [PubMed] [Google Scholar]
- 39. Kloting N, Fasshauer M, Dietrich A, Kovacs P, Schon MR, Kern M, Stumvoll M, Bluher M. Insulin‐sensitive obesity. Am J Physiol Endocrinol Metab. 2010;299:E506–E515. [DOI] [PubMed] [Google Scholar]
- 40. Straznicky NE, Lambert GW, Masuo K, Dawood T, Eikelis N, Nestel PJ, McGrane MT, Mariani JA, Socratous F, Chopra R, Esler MD, Schlaich MP, Lambert EA. Blunted sympathetic neural response to oral glucose in obese subjects with the insulin‐resistant metabolic syndrome. Am J Clin Nutr. 2009;89:27–36. [DOI] [PubMed] [Google Scholar]
- 41. Genelhu VA, Celoria BM, Duarte SF, Cabello PH, Francischetti EA. Not all obese subjects of multiethnic origin are at similar risk for developing hypertension and type 2 diabetes. Eur J Intern Med. 2009;20:289–295. [DOI] [PubMed] [Google Scholar]
- 42. Kanauchi M, Nishioka M, Dohi K. Secreted protein acidic and rich in cysteine (SPARC) in patients with diabetic nephropathy and tubulointerstitial injury. Diabetologia. 2000;43:1076–1077. [DOI] [PubMed] [Google Scholar]
- 43. Nie J, Sage EH. SPARC inhibits adipogenesis by its enhancement of beta‐catenin signaling. J Biol Chem. 2009;284:1279–1290. [DOI] [PMC free article] [PubMed] [Google Scholar]
- 44. Lawler HM, Underkofler CM, Kern PA, Erickson C, Bredbeck B, Rasouli N. Adipose tissue hypoxia, inflammation and fibrosis in obese insulin sensitive and obese insulin resistant subjects. J Clin Endocrinol Metab. 2016;101:1422–1428. [DOI] [PMC free article] [PubMed] [Google Scholar]
- 45. Wu D, Li L, Yang M, Liu H, Yang G. Elevated plasma levels of SPARC in patients with newly diagnosed type 2 diabetes mellitus. Eur J Endocrinol. 2011;165:597–601. [DOI] [PubMed] [Google Scholar]
- 46. Virtue S, Vidal‐Puig A. Adipose tissue expandability, lipotoxicity and the metabolic syndrome—an allostatic perspective. Biochem Biophys Acta. 2010;1801:338–349. [DOI] [PubMed] [Google Scholar]
- 47. Sun K, Kusminski CM, Scherer PE. Adipose tissue remodeling and obesity. J Clin Invest. 2011;121:2094–2101. [DOI] [PMC free article] [PubMed] [Google Scholar]
- 48. Graham TE, Yang Q, Bluher M, Hammarstedt A, Ciaraldi TP, Henry RR, Wason CJ, Oberbach A, Jansson PA, Smith U, Kahn BB. Retinol‐binding protein 4 and insulin resistance in lean, obese, and diabetic subjects. N Engl J Med. 2006;354:2552–2563. [DOI] [PubMed] [Google Scholar]
- 49. Weiss R, Taksali SE, Dufour S, Yeckel CW, Papademetris X, Cline G, Tamborlane WV, Dziura J, Shulman GI, Caprio S. The, “obese insulin‐sensitive” adolescent: importance of adiponectin and lipid partitioning. J Clin Endocrinol Metab. 2005;90:3731–3737. [DOI] [PubMed] [Google Scholar]
- 50. Arslanian S, El Ghormli L, Bacha F, Caprio S, Goland R, Haymond MW, Levitsky L, Nadeau KJ, White NH, Willi SM. Adiponectin, insulin sensitivity, beta‐cell function, and racial/ethnic disparity in treatment failure rates in today. Diabetes Care. 2017;40:85–93. [DOI] [PMC free article] [PubMed] [Google Scholar]
- 51. Indulekha K, Surendar J, Anjana RM, Geetha L, Gokulakrishnan K, Pradeepa R, Mohan V. Metabolic obesity, adipocytokines, and inflammatory markers in Asian Indians—CURES‐124. Diabetes Technol Ther. 2015;17:134–141. [DOI] [PubMed] [Google Scholar]
- 52. Doumatey AP, Bentley AR, Zhou J, Huang H, Adeyemo A, Rotimi CN. Paradoxical hyperadiponectinemia is associated with the metabolically healthy obese (MHO) phenotype in African Americans. J Endocrinol Metab. 2012;2:51–65. [DOI] [PMC free article] [PubMed] [Google Scholar]
- 53. Finucane FM, Luan J, Wareham NJ, Sharp SJ, O'Rahilly S, Balkau B, Flyvbjerg A, Walker M, Hojlund K, Nolan JJ, Savage DB. Correlation of the leptin: adiponectin ratio with measures of insulin resistance in non‐diabetic individuals. Diabetologia. 2009;52:2345–2349. [DOI] [PMC free article] [PubMed] [Google Scholar]
- 54. Sanchez‐Solana B, Laborda J, Baladron V. Mouse resistin modulates adipogenesis and glucose uptake in 3T3‐L1 preadipocytes through the ROR1 receptor. Mol Endocrinol. 2012;26:110–127. [DOI] [PMC free article] [PubMed] [Google Scholar]
- 55. Xu J, Lloyd DJ, Hale C, Stanislaus S, Chen M, Sivits G, Vonderfecht S, Hecht R, Li YS, Lindberg RA, Chen JL, Jung DY, Zhang Z, Ko HJ, Kim JK, Veniant MM. Fibroblast growth factor 21 reverses hepatic steatosis, increases energy expenditure, and improves insulin sensitivity in diet‐induced obese mice. Diabetes. 2009;58:250–259. [DOI] [PMC free article] [PubMed] [Google Scholar]
- 56. Jago R, Drews KL, Otvos JD, Willi SM, Buse JB. Novel measures of inflammation and insulin resistance are related to obesity and fitness in a diverse sample of 11‐14 year olds: the HEALTHY Study. Int J Obes. 2016;40:1157–1163. [DOI] [PMC free article] [PubMed] [Google Scholar]
Associated Data
This section collects any data citations, data availability statements, or supplementary materials included in this article.
Supplementary Materials
Table S1. Levels of Adipokines by Pubertal Development
Table S2. Levels of Adipokines by Sex
Table S3. Area Under Receiver Operating Characteristic Curves and Optimal Cutoffs of Adipokines in Predicting the Metabolically Unhealthy Obese Phenotype
Figure S1. CONSORT (Consolidated Standards of Reporting Trials) diagram of the study sample.
Figure S2. Comparison of adipokines levels between metabolically healthy obese and metabolically unhealthy obese participants after adjusting for waist circumference.